VMware vSphere Integration
Elastic Cloud Serverless projects are autoscaled environments, fully managed by Elastic and available on Elastic Cloud. Availability This functionality is generally available and ready for production usage. Elastic Cloud Serverless projects are autoscaled environments, fully managed by Elastic and available on Elastic Cloud. Availability This functionality is generally available and ready for production usage. The Elastic Stack includes Elastic's core products such as Elasticsearch, Kibana, Logstash, and Beats. Availability This functionality is generally available and ready for production usage. Unless stated otherwise on the page, this functionality is available when your Elastic Stack is deployed on Elastic Cloud Hosted, Elastic Cloud Enterprise, Elastic Cloud on Kubernetes, and self-managed environments. This documentation corresponds to the latest patch available for each minor version. If you're not using the latest patch, check the release notes for changes.
Serverless Observability
Generally available
Serverless Security
Generally available
Stack
9.1+
Generally available since 9.1
| Version | 1.25.1 (View all) |
| Subscription level What's this? |
Basic |
| Developed by What's this? |
Elastic |
| Ingestion method(s) | API, Network Protocol |
| Minimum Kibana version(s) | 9.1.0 8.19.0 |
vSphere is VMware's cloud computing virtualization platform, offering tools for managing virtualized data centers.
Use the vSphere integration to:
- Collect vSphere logs, along with datastore, host, and virtualmachine metrics for comprehensive monitoring and analysis.
- Create informative visualizations to track usage trends, measure key metrics, and derive actionable business insights.
- Set up alerts to minimize Mean Time to Detect (MTTD) and Mean Time to Resolve (MTTR) by quickly referencing relevant logs during troubleshooting.
The vSphere integration collects logs and metrics.
Logs help you keep a record of events that happen on your machine. The Log data stream collected by vSphere as integration is log.
Metrics give you insight into the statistics of the vSphere. The Metric data stream collected by the vSphere integration are cluster, datastore, datastorecluster, host, network, resourcepool and virtualmachine so that the user can monitor and troubleshoot the performance of the vSphere instance.
Data Streams:
log: This data stream collects logs generated by VMware vSphere using a syslog daemon.cluster: This data stream collects metrics from VMware vSphere, such as lists of datastores, hosts and networks associated with cluster.datastore: This data stream gathers datastore metrics from VMware vSphere, including performance statistics such as capacity, usage, read/write operations, latency, and throughput.datastorecluster: This data stream gathers metrics for datastore clusters from VMware vSphere, including statistics like cluster capacity and available free space. Additionally, it provides information about the individual datastores that comprise the cluster.host: This data stream collects host metrics from VMware vSphere, including performance statistics such as CPU usage, memory usage, disk I/O, and network activity.resourcepool: This data stream collects metrics from VMware vSphere, such as CPU and memory usage, CPU and memory reservation, and CPU and memory limit.virtualmachine: This data stream gathers virtual machine metrics from VMware vSphere, including performance statistics such as status, uptime, CPU usage, memory usage, and network activity.network: This data stream gathers metrics and status information related to VMware vSphere networks, including network accessibility, connected hosts and virtual machines, configuration health, and network type.
- Users can monitor and see the log inside the ingested documents for vSphere in the
logs-*index pattern fromDiscover, and for metrics, the index pattern ismetrics-*. - Supported Periods:
- Real-time data collection – An ESXi Server collects data for each performance counter every 20 seconds by default.
- The Datastore and Host datastreams support performance data collection using the vSphere performance API.
- Since the performance API has usage restrictions based on data collection intervals, users should ensure that the period is configured optimally to receive real-time data. Users can still collect summary metrics if performance metrics are not supported for the configured instance.
- Period configuration can be determined based on the Data Collection Intervals and Data Collection Levels.
You can store and search your data using Elasticsearch and visualize and manage it with Kibana. We recommend using our hosted Elasticsearch Service on Elastic Cloud or self-managing the Elastic Stack on your own hardware.
This integration has been tested and verified against VMware ESXi and vCenter versions 7.0.3 and 8.0.
For step-by-step instructions on how to set up an integration, see the Getting started guide.
This is the log data stream. This data stream collects logs generated by VMware vSphere using a syslog daemon.
Note:
- To collect logs, a syslog daemon is used. First, you must configure the listening host/IP address (default: localhost) and host port (default: 9525) in the integration. Then, configure vSphere to send logs to a remote syslog host and provide the configured hostname/IP and port of the Elastic Agent host.
Example
{
    "@timestamp": "2021-09-06T14:40:05.753Z",
    "agent": {
        "ephemeral_id": "c4a1df82-7a9c-4a3e-8546-6d7cc04538e6",
        "id": "5096d7cc-1e4b-4959-abea-7355be2913a7",
        "name": "docker-fleet-agent",
        "type": "filebeat",
        "version": "8.8.1"
    },
    "data_stream": {
        "dataset": "vsphere.log",
        "namespace": "ep",
        "type": "logs"
    },
    "ecs": {
        "version": "8.11.0"
    },
    "elastic_agent": {
        "id": "5096d7cc-1e4b-4959-abea-7355be2913a7",
        "snapshot": false,
        "version": "8.8.1"
    },
    "event": {
        "agent_id_status": "verified",
        "dataset": "vsphere.log",
        "ingested": "2023-06-29T08:05:57Z",
        "original": "<14>1 2021-09-06T14:40:05.753710+00:00 vcenter applmgmt-audit - - -  2021-09-06T14:40:05.753: INFO AuthorizationResponse = { authorized=True, method=LOCAL }",
        "timezone": "+00:00"
    },
    "host": {
        "architecture": "aarch64",
        "containerized": false,
        "hostname": "docker-fleet-agent",
        "id": "d08b346fbb8f49f5a2bb1a477f8ceb54",
        "ip": [
            "172.23.0.7"
        ],
        "mac": [
            "02-42-AC-17-00-07"
        ],
        "name": "vcenter",
        "os": {
            "codename": "focal",
            "family": "debian",
            "kernel": "5.10.104-linuxkit",
            "name": "Ubuntu",
            "platform": "ubuntu",
            "type": "linux",
            "version": "20.04.6 LTS (Focal Fossa)"
        }
    },
    "input": {
        "type": "udp"
    },
    "log": {
        "level": "INFO",
        "source": {
            "address": "172.23.0.4:59146"
        },
        "syslog": {
            "priority": 14
        }
    },
    "message": "AuthorizationResponse = { authorized=True, method=LOCAL }",
    "process": {
        "name": "applmgmt-audit"
    },
    "tags": [
        "preserve_original_event",
        "vmware-sphere"
    ]
}
ECS Field Reference
Please refer to the following document for detailed information on ECS fields.
Exported fields
| Field | Description | Type |
|---|---|---|
| @timestamp | Event timestamp. | date |
| data_stream.dataset | Data stream dataset. | constant_keyword |
| data_stream.namespace | Data stream namespace. | constant_keyword |
| data_stream.type | Data stream type. | constant_keyword |
| event.dataset | Event dataset | constant_keyword |
| event.module | Event module | constant_keyword |
| host.containerized | If the host is a container. | boolean |
| host.os.build | OS build information. | keyword |
| host.os.codename | OS codename, if any. | keyword |
| hostname | Hostname from syslog header. | keyword |
| input.type | Type of Filebeat input. | keyword |
| log.source.address | Source address of the syslog message. | keyword |
| process.program | Process from syslog header. | keyword |
| vsphere.log.api.invocations | long | |
| vsphere.log.datacenter | keyword | |
| vsphere.log.file.path | keyword |
Note:
- To access the metrics, provide the URL https://host:port/sdk in the "Add Integration" page of the vSphere package.
Clusters in vSphere represent a group of ESXi hosts working together to optimize resource allocation, ensure high availability, and manage workloads efficiently.
Example
{
    "@timestamp": "2024-11-25T05:48:26.976Z",
    "agent": {
        "ephemeral_id": "8dd73a28-19af-41ab-8404-a72ae8992509",
        "id": "f92ed428-5ea0-40fb-b403-ac0dc71e46bb",
        "name": "elastic-agent-77934",
        "type": "metricbeat",
        "version": "8.16.2"
    },
    "data_stream": {
        "dataset": "vsphere.cluster",
        "namespace": "19212",
        "type": "metrics"
    },
    "ecs": {
        "version": "8.11.0"
    },
    "elastic_agent": {
        "id": "f92ed428-5ea0-40fb-b403-ac0dc71e46bb",
        "snapshot": true,
        "version": "8.16.2"
    },
    "event": {
        "agent_id_status": "verified",
        "dataset": "vsphere.cluster",
        "duration": 14793678,
        "ingested": "2024-11-25T05:48:29Z",
        "module": "vsphere"
    },
    "host": {
        "architecture": "x86_64",
        "containerized": true,
        "hostname": "elastic-agent-77934",
        "ip": [
            "192.168.241.4",
            "192.168.242.2"
        ],
        "mac": [
            "02-42-C0-A8-F1-04",
            "02-42-C0-A8-F2-02"
        ],
        "name": "elastic-agent-77934",
        "os": {
            "kernel": "3.10.0-1160.118.1.el7.x86_64",
            "name": "Wolfi",
            "platform": "wolfi",
            "type": "linux",
            "version": "20230201"
        }
    },
    "metricset": {
        "name": "cluster",
        "period": 20000
    },
    "service": {
        "address": "https://svc-vsphere-metrics:8989/sdk",
        "type": "vsphere"
    },
    "tags": [
        "vsphere-cluster"
    ],
    "vsphere": {
        "cluster": {
            "datastore": {
                "count": 1,
                "names": "LocalDS_0"
            },
            "host": {
                "count": 3,
                "names": [
                    "DC0_C0_H0",
                    "DC0_C0_H1",
                    "DC0_C0_H2"
                ]
            },
            "id": "domain-c28",
            "name": "DC0_C0",
            "network": {
                "count": 3,
                "names": [
                    "DC0_DVPG0",
                    "DVS0-DVUplinks-10",
                    "VM Network"
                ]
            }
        }
    }
}
ECS Field Reference
Please refer to the following document for detailed information on ECS fields.
Exported fields
| Field | Description | Type | Metric Type |
|---|---|---|---|
| @timestamp | Event timestamp. | date | |
| agent.id | keyword | ||
| cloud.account.id | The cloud account or organization id used to identify different entities in a multi-tenant environment. Examples: AWS account id, Google Cloud ORG Id, or other unique identifier. | keyword | |
| cloud.availability_zone | Availability zone in which this host, resource, or service is located. | keyword | |
| cloud.instance.id | Instance ID of the host machine. | keyword | |
| cloud.provider | Name of the cloud provider. Example values are aws, azure, gcp, or digitalocean. | keyword | |
| cloud.region | Region in which this host, resource, or service is located. | keyword | |
| container.id | Unique container id. | keyword | |
| data_stream.dataset | Data stream dataset. | constant_keyword | |
| data_stream.namespace | Data stream namespace. | constant_keyword | |
| data_stream.type | Data stream type. | constant_keyword | |
| host.name | Name of the host. It can contain what hostname returns on Unix systems, the fully qualified domain name, or a name specified by the user. The sender decides which value to use. |
keyword | |
| service.address | Address where data about this service was collected from. This should be a URI, network address (ipv4:port or [ipv6]:port) or a resource path (sockets). | keyword | |
| vsphere.cluster.alert.names | List of all the alerts on this cluster. | keyword | |
| vsphere.cluster.das_config.admission.control.enabled | Indicates whether strict admission control is enabled. | boolean | |
| vsphere.cluster.das_config.enabled | Indicates whether vSphere HA feature is enabled. | boolean | |
| vsphere.cluster.datastore.count | Number of datastores associated with the cluster. | long | gauge |
| vsphere.cluster.datastore.names | List of all the datastore names associated with the cluster. | keyword | |
| vsphere.cluster.host.count | Number of hosts associated with the cluster. | long | gauge |
| vsphere.cluster.host.names | List of all the host names associated with the cluster. | keyword | |
| vsphere.cluster.id | Unique cluster ID. | keyword | |
| vsphere.cluster.name | Cluster name. | keyword | |
| vsphere.cluster.network.count | Number of networks associated with the cluster. | long | gauge |
| vsphere.cluster.network.names | List of all the network names associated with the cluster. | keyword | |
| vsphere.cluster.resourcepool.id | ID of resource pool associated with the cluster. | keyword | |
| vsphere.cluster.triggered_alarms.description | Description of the alarm. | keyword | |
| vsphere.cluster.triggered_alarms.entity_name | Name of the entity associated with the alarm. | keyword | |
| vsphere.cluster.triggered_alarms.id | Unique identifier for the alarm. | keyword | |
| vsphere.cluster.triggered_alarms.name | Name of the alarm. | keyword | |
| vsphere.cluster.triggered_alarms.status | Status of the alarm. | keyword | |
| vsphere.cluster.triggered_alarms.triggered_time | Time when the alarm was triggered. | date | |
| vsphere.cluster.warning.names | List of all the warnings on this cluster. | keyword |
This is datastore data stream. This data stream collects datastore metrics from VMware vSphere, including performance statistics such as capacity, usage, read/write operations, latency, and throughput.
Example
{
    "@timestamp": "2024-11-25T05:49:20.546Z",
    "agent": {
        "ephemeral_id": "526f6e02-35e4-402d-b28d-29e1166195da",
        "id": "136823ae-978c-4319-9d75-901e9ff73238",
        "name": "elastic-agent-99749",
        "type": "metricbeat",
        "version": "8.16.2"
    },
    "data_stream": {
        "dataset": "vsphere.datastore",
        "namespace": "82538",
        "type": "metrics"
    },
    "ecs": {
        "version": "8.11.0"
    },
    "elastic_agent": {
        "id": "136823ae-978c-4319-9d75-901e9ff73238",
        "snapshot": true,
        "version": "8.16.2"
    },
    "event": {
        "agent_id_status": "verified",
        "dataset": "vsphere.datastore",
        "duration": 97747338,
        "ingested": "2024-11-25T05:49:23Z",
        "module": "vsphere"
    },
    "host": {
        "architecture": "x86_64",
        "containerized": true,
        "hostname": "elastic-agent-99749",
        "ip": [
            "192.168.241.4",
            "192.168.244.2"
        ],
        "mac": [
            "02-42-C0-A8-F1-04",
            "02-42-C0-A8-F4-02"
        ],
        "name": "elastic-agent-99749",
        "os": {
            "kernel": "3.10.0-1160.118.1.el7.x86_64",
            "name": "Wolfi",
            "platform": "wolfi",
            "type": "linux",
            "version": "20230201"
        }
    },
    "metricset": {
        "name": "datastore",
        "period": 20000
    },
    "service": {
        "address": "https://svc-vsphere-metrics:8989/sdk",
        "type": "vsphere"
    },
    "tags": [
        "vsphere-datastore"
    ],
    "vsphere": {
        "datastore": {
            "capacity": {
                "free": {
                    "bytes": 10952166604800
                },
                "total": {
                    "bytes": 10995116277760
                },
                "used": {
                    "bytes": 42949672960,
                    "pct": 0.004
                }
            },
            "fstype": "OTHER",
            "host": {
                "count": 1,
                "names": "DC0_H0"
            },
            "id": "datastore-53",
            "name": "LocalDS_0",
            "status": "green",
            "vm": {
                "count": 4,
                "names": [
                    "DC0_C0_RP0_VM0",
                    "DC0_C0_RP0_VM1",
                    "DC0_H0_VM0",
                    "DC0_H0_VM1"
                ]
            }
        }
    }
}
ECS Field Reference
Please refer to the following document for detailed information on ECS fields.
Exported fields
| Field | Description | Type | Unit | Metric Type |
|---|---|---|---|---|
| @timestamp | Event timestamp. | date | ||
| agent.id | keyword | |||
| cloud.account.id | The cloud account or organization id used to identify different entities in a multi-tenant environment. Examples: AWS account id, Google Cloud ORG Id, or other unique identifier. | keyword | ||
| cloud.availability_zone | Availability zone in which this host, resource, or service is located. | keyword | ||
| cloud.instance.id | Instance ID of the host machine. | keyword | ||
| cloud.provider | Name of the cloud provider. Example values are aws, azure, gcp, or digitalocean. | keyword | ||
| cloud.region | Region in which this host, resource, or service is located. | keyword | ||
| container.id | Unique container id. | keyword | ||
| data_stream.dataset | Data stream dataset. | constant_keyword | ||
| data_stream.namespace | Data stream namespace. | constant_keyword | ||
| data_stream.type | Data stream type. | constant_keyword | ||
| event.dataset | Event dataset | constant_keyword | ||
| event.module | Event module | constant_keyword | ||
| host.containerized | If the host is a container. | boolean | ||
| host.name | Name of the host. It can contain what hostname returns on Unix systems, the fully qualified domain name, or a name specified by the user. The sender decides which value to use. |
keyword | ||
| host.os.build | OS build information. | keyword | ||
| host.os.codename | OS codename, if any. | keyword | ||
| service.address | Address where data about this service was collected from. This should be a URI, network address (ipv4:port or [ipv6]:port) or a resource path (sockets). | keyword | ||
| vsphere.datastore.alert.names | List of all the alerts on this datastore. | keyword | ||
| vsphere.datastore.capacity.free.bytes | Free bytes of the datastore. | long | byte | gauge |
| vsphere.datastore.capacity.total.bytes | Total bytes of the datastore. | long | byte | gauge |
| vsphere.datastore.capacity.used.bytes | Used bytes of the datastore. | long | byte | gauge |
| vsphere.datastore.capacity.used.pct | Percentage of datastore capacity used. | scaled_float | percent | gauge |
| vsphere.datastore.disk.capacity.bytes | Configured size of the datastore. | long | gauge | |
| vsphere.datastore.disk.capacity.usage.bytes | The amount of storage capacity currently being consumed by datastore. | long | gauge | |
| vsphere.datastore.disk.provisioned.bytes | Amount of storage set aside for use by a datastore. | long | gauge | |
| vsphere.datastore.fstype | Filesystem type. | keyword | ||
| vsphere.datastore.host.count | Number of hosts associated with the datastore. | long | gauge | |
| vsphere.datastore.host.names | List of all the host names associated with the datastore. | keyword | ||
| vsphere.datastore.id | Unique datastore ID. | keyword | ||
| vsphere.datastore.name | Datastore name. | keyword | ||
| vsphere.datastore.read.bytes | Rate of reading data from the datastore. | long | byte | gauge |
| vsphere.datastore.status | Status of the datastore. | keyword | ||
| vsphere.datastore.triggered_alarms.description | Description of the alarm. | keyword | ||
| vsphere.datastore.triggered_alarms.entity_name | Name of the entity associated with the alarm. | keyword | ||
| vsphere.datastore.triggered_alarms.id | Unique identifier for the alarm. | keyword | ||
| vsphere.datastore.triggered_alarms.name | Name of the alarm. | keyword | ||
| vsphere.datastore.triggered_alarms.status | Status of the alarm. | keyword | ||
| vsphere.datastore.triggered_alarms.triggered_time | Time when the alarm was triggered. | date | ||
| vsphere.datastore.vm.count | Number of VMs associated with the datastore. | long | gauge | |
| vsphere.datastore.vm.names | List of all the VM names associated with the datastore. | keyword | ||
| vsphere.datastore.warning.names | List of all the warnings on this Datastore. | keyword | ||
| vsphere.datastore.write.bytes | Rate of writing data to the datastore. | long | byte | gauge |
Datastore clusters in vSphere group multiple datastores for optimized management and automated load balancing, ensuring efficient storage utilization and simplified administration.
Example
{
    "@timestamp": "2024-11-25T05:50:15.938Z",
    "agent": {
        "ephemeral_id": "708961a1-cbad-4975-8eba-e1bdb8d6f6a6",
        "id": "725a6747-ca90-4a2e-bf23-32ea7b753cf9",
        "name": "elastic-agent-70611",
        "type": "metricbeat",
        "version": "8.16.2"
    },
    "data_stream": {
        "dataset": "vsphere.datastorecluster",
        "namespace": "34029",
        "type": "metrics"
    },
    "ecs": {
        "version": "8.11.0"
    },
    "elastic_agent": {
        "id": "725a6747-ca90-4a2e-bf23-32ea7b753cf9",
        "snapshot": true,
        "version": "8.16.2"
    },
    "event": {
        "agent_id_status": "verified",
        "dataset": "vsphere.datastorecluster",
        "duration": 10884609,
        "ingested": "2024-11-25T05:50:18Z",
        "module": "vsphere"
    },
    "host": {
        "architecture": "x86_64",
        "containerized": true,
        "hostname": "elastic-agent-70611",
        "ip": [
            "192.168.241.4",
            "192.168.246.2"
        ],
        "mac": [
            "02-42-C0-A8-F1-04",
            "02-42-C0-A8-F6-02"
        ],
        "name": "elastic-agent-70611",
        "os": {
            "kernel": "3.10.0-1160.118.1.el7.x86_64",
            "name": "Wolfi",
            "platform": "wolfi",
            "type": "linux",
            "version": "20230201"
        }
    },
    "metricset": {
        "name": "datastorecluster",
        "period": 20000
    },
    "service": {
        "address": "https://svc-vsphere-metrics:8989/sdk",
        "type": "vsphere"
    },
    "tags": [
        "vsphere-datastorecluster"
    ],
    "vsphere": {
        "datastorecluster": {
            "capacity": {
                "bytes": 0
            },
            "datastore": {
                "count": 0
            },
            "free_space": {
                "bytes": 0
            },
            "id": "group-p8",
            "name": "DC0_POD0"
        }
    }
}
ECS Field Reference
Please refer to the following document for detailed information on ECS fields.
Exported fields
| Field | Description | Type | Unit | Metric Type |
|---|---|---|---|---|
| @timestamp | Event timestamp. | date | ||
| agent.id | keyword | |||
| cloud.account.id | The cloud account or organization id used to identify different entities in a multi-tenant environment. Examples: AWS account id, Google Cloud ORG Id, or other unique identifier. | keyword | ||
| cloud.availability_zone | Availability zone in which this host, resource, or service is located. | keyword | ||
| cloud.instance.id | Instance ID of the host machine. | keyword | ||
| cloud.provider | Name of the cloud provider. Example values are aws, azure, gcp, or digitalocean. | keyword | ||
| cloud.region | Region in which this host, resource, or service is located. | keyword | ||
| container.id | Unique container id. | keyword | ||
| data_stream.dataset | Data stream dataset. | constant_keyword | ||
| data_stream.namespace | Data stream namespace. | constant_keyword | ||
| data_stream.type | Data stream type. | constant_keyword | ||
| event.dataset | Event dataset | constant_keyword | ||
| event.module | Event module | constant_keyword | ||
| host.name | Name of the host. It can contain what hostname returns on Unix systems, the fully qualified domain name, or a name specified by the user. The sender decides which value to use. |
keyword | ||
| service.address | Address where data about this service was collected from. This should be a URI, network address (ipv4:port or [ipv6]:port) or a resource path (sockets). | keyword | ||
| vsphere.datastorecluster.alert.names | List of all the alerts on this datastore cluster. | keyword | ||
| vsphere.datastorecluster.capacity.bytes | Total capacity of this storage pod, in bytes. | long | byte | gauge |
| vsphere.datastorecluster.datastore.count | Number of datastores in the datastore cluster. | long | gauge | |
| vsphere.datastorecluster.datastore.names | List of all the datastore names associated with the datastore cluster. | keyword | ||
| vsphere.datastorecluster.free_space.bytes | Total free space on this storage pod, in bytes. | long | byte | gauge |
| vsphere.datastorecluster.id | Unique datastore cluster ID. | keyword | ||
| vsphere.datastorecluster.name | The datastore cluster name. | keyword | ||
| vsphere.datastorecluster.triggered_alarms.description | Description of the alarm. | keyword | ||
| vsphere.datastorecluster.triggered_alarms.entity_name | Name of the entity associated with the alarm. | keyword | ||
| vsphere.datastorecluster.triggered_alarms.id | Unique identifier for the alarm. | keyword | ||
| vsphere.datastorecluster.triggered_alarms.name | Name of the alarm. | keyword | ||
| vsphere.datastorecluster.triggered_alarms.status | Status of the alarm. | keyword | ||
| vsphere.datastorecluster.triggered_alarms.triggered_time | Time when the alarm was triggered. | date | ||
| vsphere.datastorecluster.warning.names | List of all the warnings on this datastore cluster. | keyword |
This is the host data stream. This data stream collects host metrics from VMware vSphere, including performance statistics such as CPU usage, memory usage, disk I/O, and network activity.
Example
{
    "@timestamp": "2024-11-25T05:51:10.976Z",
    "agent": {
        "ephemeral_id": "68b872ee-00e2-4c05-8dcc-7c0374dfa3c0",
        "id": "a0006203-efd1-4e6a-9ffa-f5e3bda9e512",
        "name": "elastic-agent-81083",
        "type": "metricbeat",
        "version": "8.16.2"
    },
    "data_stream": {
        "dataset": "vsphere.host",
        "namespace": "79577",
        "type": "metrics"
    },
    "ecs": {
        "version": "8.11.0"
    },
    "elastic_agent": {
        "id": "a0006203-efd1-4e6a-9ffa-f5e3bda9e512",
        "snapshot": true,
        "version": "8.16.2"
    },
    "event": {
        "agent_id_status": "verified",
        "dataset": "vsphere.host",
        "duration": 1959540462,
        "ingested": "2024-11-25T05:51:13Z",
        "module": "vsphere"
    },
    "host": {
        "architecture": "x86_64",
        "containerized": true,
        "hostname": "elastic-agent-81083",
        "ip": [
            "192.168.241.4",
            "192.168.248.2"
        ],
        "mac": [
            "02-42-C0-A8-F1-04",
            "02-42-C0-A8-F8-02"
        ],
        "name": "elastic-agent-81083",
        "os": {
            "kernel": "3.10.0-1160.118.1.el7.x86_64",
            "name": "Wolfi",
            "platform": "wolfi",
            "type": "linux",
            "version": "20230201"
        }
    },
    "metricset": {
        "name": "host",
        "period": 20000
    },
    "service": {
        "address": "https://svc-vsphere-metrics:8989/sdk",
        "type": "vsphere"
    },
    "tags": [
        "vsphere-host"
    ],
    "vsphere": {
        "host": {
            "cpu": {
                "free": {
                    "mhz": 4521
                },
                "total": {
                    "mhz": 4588
                },
                "used": {
                    "mhz": 67,
                    "pct": 0.015
                }
            },
            "datastore": {
                "count": 1,
                "names": "LocalDS_0"
            },
            "disk": {
                "read": {
                    "bytes": 3072
                },
                "total": {
                    "bytes": 1694720
                },
                "write": {
                    "bytes": 1631232
                }
            },
            "id": "host-51",
            "memory": {
                "free": {
                    "bytes": 2822230016
                },
                "total": {
                    "bytes": 4294430720
                },
                "used": {
                    "bytes": 1472200704,
                    "pct": 0.343
                }
            },
            "name": "DC0_C0_H2",
            "network": {
                "bandwidth": {
                    "received": {
                        "bytes": 586752
                    },
                    "total": {
                        "bytes": 716800
                    },
                    "transmitted": {
                        "bytes": 321536
                    }
                },
                "count": 3,
                "names": [
                    "DC0_DVPG0",
                    "DVS0-DVUplinks-10",
                    "VM Network"
                ],
                "packets": {
                    "multicast": {
                        "received": {
                            "count": 133
                        }
                    },
                    "received": {
                        "count": 9359
                    },
                    "transmitted": {
                        "count": 6718
                    }
                }
            },
            "network_names": [
                "DC0_DVPG0",
                "DVS0-DVUplinks-10",
                "VM Network"
            ],
            "status": "gray",
            "uptime": 77229
        }
    }
}
ECS Field Reference
Please refer to the following document for detailed information on ECS fields.
Exported fields
| Field | Description | Type | Unit | Metric Type |
|---|---|---|---|---|
| @timestamp | Event timestamp. | date | ||
| agent.id | keyword | |||
| cloud.account.id | The cloud account or organization id used to identify different entities in a multi-tenant environment. Examples: AWS account id, Google Cloud ORG Id, or other unique identifier. | keyword | ||
| cloud.availability_zone | Availability zone in which this host, resource, or service is located. | keyword | ||
| cloud.instance.id | Instance ID of the host machine. | keyword | ||
| cloud.provider | Name of the cloud provider. Example values are aws, azure, gcp, or digitalocean. | keyword | ||
| cloud.region | Region in which this host, resource, or service is located. | keyword | ||
| container.id | Unique container id. | keyword | ||
| data_stream.dataset | Data stream dataset. | constant_keyword | ||
| data_stream.namespace | Data stream namespace. | constant_keyword | ||
| data_stream.type | Data stream type. | constant_keyword | ||
| event.dataset | Event dataset | constant_keyword | ||
| event.module | Event module | constant_keyword | ||
| host.name | Name of the host. It can contain what hostname returns on Unix systems, the fully qualified domain name, or a name specified by the user. The sender decides which value to use. |
keyword | ||
| service.address | Address where data about this service was collected from. This should be a URI, network address (ipv4:port or [ipv6]:port) or a resource path (sockets). | keyword | ||
| vsphere.host.alert.names | List of all the alerts on this host. | keyword | ||
| vsphere.host.cpu.free.mhz | Free CPU in MHz. | long | gauge | |
| vsphere.host.cpu.total.mhz | Total CPU in MHz. | long | counter | |
| vsphere.host.cpu.used.mhz | Used CPU in MHz. | long | gauge | |
| vsphere.host.cpu.used.pct | CPU Utilization % of the host | scaled_float | percent | gauge |
| vsphere.host.datastore.count | Number of datastores on the host. | long | gauge | |
| vsphere.host.datastore.names | List of all the datastore names. | keyword | ||
| vsphere.host.disk.capacity.usage.bytes | The amount of storage capacity currently being consumed by or on the entity. | long | byte | gauge |
| vsphere.host.disk.devicelatency.average.ms | Average amount of time it takes to complete an SCSI command from physical device in milliseconds. | long | ms | gauge |
| vsphere.host.disk.latency.total.ms | Highest latency value across all disks used by the host in milliseconds. | long | ms | gauge |
| vsphere.host.disk.read.bytes | Average number of bytes read from the disk each second. | long | byte | gauge |
| vsphere.host.disk.total.bytes | Sum of disk read and write rates each second in bytes. | long | byte | gauge |
| vsphere.host.disk.write.bytes | Average number of bytes written to the disk each second. | long | byte | gauge |
| vsphere.host.id | Unique host ID. | keyword | ||
| vsphere.host.memory.free.bytes | Free Memory in bytes. | long | byte | gauge |
| vsphere.host.memory.total.bytes | Total Memory in bytes. | long | byte | gauge |
| vsphere.host.memory.used.bytes | Used Memory in bytes. | long | byte | gauge |
| vsphere.host.memory.used.pct | Memory utilization % of the host | scaled_float | percent | gauge |
| vsphere.host.name | Host name. | keyword | ||
| vsphere.host.network.bandwidth.received.bytes | Average rate at which data was received during the interval. This represents the bandwidth of the network. | long | byte | gauge |
| vsphere.host.network.bandwidth.total.bytes | Sum of network transmitted and received rates in bytes during the interval. | long | byte | gauge |
| vsphere.host.network.bandwidth.transmitted.bytes | Average rate at which data was transmitted during the interval. This represents the bandwidth of the network. | long | byte | gauge |
| vsphere.host.network.count | Number of networks on the host. | long | gauge | |
| vsphere.host.network.names | List of all the network names. | keyword | ||
| vsphere.host.network.packets.dropped.received.count | Number of received packets dropped. | long | gauge | |
| vsphere.host.network.packets.dropped.total.count | Total number of packets dropped. | long | gauge | |
| vsphere.host.network.packets.dropped.transmitted.count | Number of transmitted packets dropped. | long | gauge | |
| vsphere.host.network.packets.errors.received.count | Number of packets with errors received. | long | gauge | |
| vsphere.host.network.packets.errors.total.count | Total number of packets with errors. | long | gauge | |
| vsphere.host.network.packets.errors.transmitted.count | Number of packets with errors transmitted. | long | gauge | |
| vsphere.host.network.packets.multicast.received.count | Number of multicast packets received. | long | gauge | |
| vsphere.host.network.packets.multicast.total.count | Total number of multicast packets. | long | gauge | |
| vsphere.host.network.packets.multicast.transmitted.count | Number of multicast packets transmitted. | long | gauge | |
| vsphere.host.network.packets.received.count | Number of packets received. | long | gauge | |
| vsphere.host.network.packets.transmitted.count | Number of packets transmitted. | long | gauge | |
| vsphere.host.network_names | Network names. | keyword | ||
| vsphere.host.status | The overall health status of a host in the vSphere environment. | keyword | ||
| vsphere.host.triggered_alarms.description | Description of the alarm. | keyword | ||
| vsphere.host.triggered_alarms.entity_name | Name of the entity associated with the alarm. | keyword | ||
| vsphere.host.triggered_alarms.id | Unique identifier for the alarm. | keyword | ||
| vsphere.host.triggered_alarms.name | Name of the alarm. | keyword | ||
| vsphere.host.triggered_alarms.status | Status of the alarm. | keyword | ||
| vsphere.host.triggered_alarms.triggered_time | Time when the alarm was triggered. | date | ||
| vsphere.host.uptime | The total uptime of a host in seconds within the vSphere environment. | long | gauge | |
| vsphere.host.vm.count | Number of virtual machines on the host. | long | gauge | |
| vsphere.host.vm.names | List of all the VM names. | keyword | ||
| vsphere.host.warning.names | List of all the warnings on this host. | keyword |
This is the network data stream. This data stream gathers metrics and status information related to VMware vSphere networks, including network accessibility, connected hosts and virtual machines, configuration health, and network type.
Example
{
    "@timestamp": "2024-11-25T05:53:59.603Z",
    "agent": {
        "ephemeral_id": "a69b7846-f5b9-4f72-95f7-98a99d21806e",
        "id": "78e2558b-aa96-4683-a08d-e4bed771fe09",
        "name": "elastic-agent-77565",
        "type": "metricbeat",
        "version": "8.16.2"
    },
    "data_stream": {
        "dataset": "vsphere.network",
        "namespace": "81261",
        "type": "metrics"
    },
    "ecs": {
        "version": "8.11.0"
    },
    "elastic_agent": {
        "id": "78e2558b-aa96-4683-a08d-e4bed771fe09",
        "snapshot": true,
        "version": "8.16.2"
    },
    "event": {
        "agent_id_status": "verified",
        "dataset": "vsphere.network",
        "duration": 13659192,
        "ingested": "2024-11-25T05:54:02Z",
        "module": "vsphere"
    },
    "host": {
        "architecture": "x86_64",
        "containerized": true,
        "hostname": "elastic-agent-77565",
        "ip": [
            "192.168.241.4",
            "192.168.255.2"
        ],
        "mac": [
            "02-42-C0-A8-F1-04",
            "02-42-C0-A8-FF-02"
        ],
        "name": "elastic-agent-77565",
        "os": {
            "kernel": "3.10.0-1160.118.1.el7.x86_64",
            "name": "Wolfi",
            "platform": "wolfi",
            "type": "linux",
            "version": "20230201"
        }
    },
    "metricset": {
        "name": "network",
        "period": 20000
    },
    "service": {
        "address": "https://svc-vsphere-metrics:8989/sdk",
        "type": "vsphere"
    },
    "tags": [
        "vsphere-network"
    ],
    "vsphere": {
        "network": {
            "accessible": true,
            "config": {
                "status": "green"
            },
            "id": "network-7",
            "name": "VM Network",
            "status": "green",
            "type": "Network"
        }
    }
}
ECS Field Reference
Please refer to the following document for detailed information on ECS fields.
Exported fields
| Field | Description | Type | Metric Type |
|---|---|---|---|
| @timestamp | Event timestamp. | date | |
| agent.id | keyword | ||
| cloud.account.id | The cloud account or organization id used to identify different entities in a multi-tenant environment. Examples: AWS account id, Google Cloud ORG Id, or other unique identifier. | keyword | |
| cloud.availability_zone | Availability zone in which this host, resource, or service is located. | keyword | |
| cloud.instance.id | Instance ID of the host machine. | keyword | |
| cloud.provider | Name of the cloud provider. Example values are aws, azure, gcp, or digitalocean. | keyword | |
| cloud.region | Region in which this host, resource, or service is located. | keyword | |
| container.id | Unique container id. | keyword | |
| data_stream.dataset | Data stream dataset. | constant_keyword | |
| data_stream.namespace | Data stream namespace. | constant_keyword | |
| data_stream.type | Data stream type. | constant_keyword | |
| event.dataset | Event dataset | constant_keyword | |
| event.module | Event module | constant_keyword | |
| host.containerized | If the host is a container. | boolean | |
| host.name | Name of the host. It can contain what hostname returns on Unix systems, the fully qualified domain name, or a name specified by the user. The sender decides which value to use. |
keyword | |
| service.address | Address where data about this service was collected from. This should be a URI, network address (ipv4:port or [ipv6]:port) or a resource path (sockets). | keyword | |
| vsphere.network.accessible | Indicates whether at least one host is configured to provide this network. | boolean | |
| vsphere.network.alert.names | List of all the alerts on this network. | keyword | |
| vsphere.network.config.status | Indicates whether the system has detected a configuration issue. | keyword | |
| vsphere.network.host.count | Number of hosts connected to this network. | long | gauge |
| vsphere.network.host.names | List of all the hosts connected to this network. | keyword | |
| vsphere.network.id | Unique network ID. | keyword | |
| vsphere.network.name | Name of the network. | keyword | |
| vsphere.network.status | General health of the network. | keyword | |
| vsphere.network.triggered_alarms.description | Description of the alarm. | keyword | |
| vsphere.network.triggered_alarms.entity_name | Name of the entity associated with the alarm. | keyword | |
| vsphere.network.triggered_alarms.id | Unique identifier for the alarm. | keyword | |
| vsphere.network.triggered_alarms.name | Name of the alarm. | keyword | |
| vsphere.network.triggered_alarms.status | Status of the alarm. | keyword | |
| vsphere.network.triggered_alarms.triggered_time | Time when the alarm was triggered. | date | |
| vsphere.network.type | Type of the network (e.g., Network(Standard), DistributedVirtualport). | keyword | |
| vsphere.network.vm.count | Number of virtual machines connected to this network. | long | gauge |
| vsphere.network.vm.names | List of all the virtual machines connected to this network. | keyword | |
| vsphere.network.warning.names | List of all the warnings on this network. | keyword |
Resource pools in vSphere allow for the allocation and management of CPU and memory resources across groups of virtual machines.
Example
{
    "@timestamp": "2024-11-25T05:54:48.595Z",
    "agent": {
        "ephemeral_id": "236ddb3e-35c8-4d3e-a48c-caa904ff6b04",
        "id": "689c9051-c4ae-4f11-ba6d-27a03327c9e6",
        "name": "elastic-agent-41690",
        "type": "metricbeat",
        "version": "8.16.2"
    },
    "data_stream": {
        "dataset": "vsphere.resourcepool",
        "namespace": "42500",
        "type": "metrics"
    },
    "ecs": {
        "version": "8.11.0"
    },
    "elastic_agent": {
        "id": "689c9051-c4ae-4f11-ba6d-27a03327c9e6",
        "snapshot": true,
        "version": "8.16.2"
    },
    "event": {
        "agent_id_status": "verified",
        "dataset": "vsphere.resourcepool",
        "duration": 13597205,
        "ingested": "2024-11-25T05:54:51Z",
        "module": "vsphere"
    },
    "host": {
        "architecture": "x86_64",
        "containerized": true,
        "hostname": "elastic-agent-41690",
        "ip": [
            "192.168.241.4",
            "192.168.242.2"
        ],
        "mac": [
            "02-42-C0-A8-F1-04",
            "02-42-C0-A8-F2-02"
        ],
        "name": "elastic-agent-41690",
        "os": {
            "kernel": "3.10.0-1160.118.1.el7.x86_64",
            "name": "Wolfi",
            "platform": "wolfi",
            "type": "linux",
            "version": "20230201"
        }
    },
    "metricset": {
        "name": "resourcepool",
        "period": 20000
    },
    "service": {
        "address": "https://svc-vsphere-metrics:8989/sdk",
        "type": "vsphere"
    },
    "tags": [
        "vsphere-resourcepool"
    ],
    "vsphere": {
        "resourcepool": {
            "id": "resgroup-27",
            "name": "Resources",
            "status": "green"
        }
    }
}
ECS Field Reference
Please refer to the following document for detailed information on ECS fields.
Exported fields
| Field | Description | Type | Unit | Metric Type |
|---|---|---|---|---|
| @timestamp | Event timestamp. | date | ||
| agent.id | keyword | |||
| cloud.account.id | The cloud account or organization id used to identify different entities in a multi-tenant environment. Examples: AWS account id, Google Cloud ORG Id, or other unique identifier. | keyword | ||
| cloud.availability_zone | Availability zone in which this host, resource, or service is located. | keyword | ||
| cloud.instance.id | Instance ID of the host machine. | keyword | ||
| cloud.provider | Name of the cloud provider. Example values are aws, azure, gcp, or digitalocean. | keyword | ||
| cloud.region | Region in which this host, resource, or service is located. | keyword | ||
| container.id | Unique container id. | keyword | ||
| data_stream.dataset | Data stream dataset. | constant_keyword | ||
| data_stream.namespace | Data stream namespace. | constant_keyword | ||
| data_stream.type | Data stream type. | constant_keyword | ||
| host.name | Name of the host. It can contain what hostname returns on Unix systems, the fully qualified domain name, or a name specified by the user. The sender decides which value to use. |
keyword | ||
| service.address | Address where data about this service was collected from. This should be a URI, network address (ipv4:port or [ipv6]:port) or a resource path (sockets). | keyword | ||
| vsphere.resourcepool.alert.names | List of all the alerts on this resourcepool. | keyword | ||
| vsphere.resourcepool.cpu.demand.mhz | Basic CPU performance statistics, in MHz. | long | gauge | |
| vsphere.resourcepool.cpu.entitlement.mhz | The amount of CPU resource, in MHz, that this VM is entitled to, as calculated by DRS. | long | gauge | |
| vsphere.resourcepool.cpu.entitlement.static.mhz | The static CPU resource entitlement for a virtual machine. | long | gauge | |
| vsphere.resourcepool.cpu.usage.mhz | Basic CPU performance statistics, in MHz. | long | gauge | |
| vsphere.resourcepool.id | Unique resource pool ID. | keyword | ||
| vsphere.resourcepool.memory.ballooned.bytes | The size of the balloon driver in a virtual machine, in bytes. | long | byte | gauge |
| vsphere.resourcepool.memory.compressed.bytes | The amount of compressed memory currently consumed by VM, in bytes. | long | byte | gauge |
| vsphere.resourcepool.memory.entitlement.bytes | The amount of memory, in bytes, that this VM is entitled to, as calculated by DRS. | long | byte | gauge |
| vsphere.resourcepool.memory.entitlement.static.bytes | The static memory resource entitlement for a virtual machine, in bytes. | long | byte | gauge |
| vsphere.resourcepool.memory.overhead.bytes | The amount of memory resource (in bytes) that will be used by a virtual machine above its guest memory requirements. | long | byte | gauge |
| vsphere.resourcepool.memory.overhead.consumed.bytes | The amount of overhead memory, in bytes, currently being consumed to run a VM. | long | byte | gauge |
| vsphere.resourcepool.memory.private.bytes | The portion of memory, in bytes, that is granted to a virtual machine from non-shared host memory. | long | byte | gauge |
| vsphere.resourcepool.memory.shared.bytes | The portion of memory, in bytes, that is granted to a virtual machine from host memory that is shared between VMs. | long | byte | gauge |
| vsphere.resourcepool.memory.swapped.bytes | The portion of memory, in bytes, that is granted to a virtual machine from the host's swap space. | long | byte | gauge |
| vsphere.resourcepool.memory.usage.guest.bytes | Guest memory utilization statistics, in bytes. | long | byte | gauge |
| vsphere.resourcepool.memory.usage.host.bytes | Host memory utilization statistics, in bytes. | long | byte | gauge |
| vsphere.resourcepool.name | The name of the resourcepool. | keyword | ||
| vsphere.resourcepool.status | The overall health status of a host in the vSphere environment. | keyword | ||
| vsphere.resourcepool.triggered_alarms.description | Description of the alarm. | keyword | ||
| vsphere.resourcepool.triggered_alarms.entity_name | Name of the entity associated with the alarm. | keyword | ||
| vsphere.resourcepool.triggered_alarms.id | Unique identifier for the alarm. | keyword | ||
| vsphere.resourcepool.triggered_alarms.name | Name of the alarm. | keyword | ||
| vsphere.resourcepool.triggered_alarms.status | Status of the alarm. | keyword | ||
| vsphere.resourcepool.triggered_alarms.triggered_time | Time when the alarm was triggered. | date | ||
| vsphere.resourcepool.vm.count | Number of virtual machines on the resourcepool. | long | gauge | |
| vsphere.resourcepool.vm.names | Names of virtual machines on the resourcepool. | keyword | ||
| vsphere.resourcepool.warning.names | List of all the warnings on this resourcepool. | keyword |
This is the virtualmachine data stream. This data stream collects virtual machine metrics from VMware vSphere, including performance statistics such as status, uptime, CPU usage, memory usage, and network activity.
Example
{
    "@timestamp": "2024-11-25T05:55:36.940Z",
    "agent": {
        "ephemeral_id": "c5d83ada-b469-4178-b167-02c09b1a4aba",
        "id": "2428be84-8f03-495a-8a9f-da3c9fc1459c",
        "name": "elastic-agent-79780",
        "type": "metricbeat",
        "version": "8.16.2"
    },
    "data_stream": {
        "dataset": "vsphere.virtualmachine",
        "namespace": "53355",
        "type": "metrics"
    },
    "ecs": {
        "version": "8.11.0"
    },
    "elastic_agent": {
        "id": "2428be84-8f03-495a-8a9f-da3c9fc1459c",
        "snapshot": true,
        "version": "8.16.2"
    },
    "event": {
        "agent_id_status": "verified",
        "dataset": "vsphere.virtualmachine",
        "duration": 71113664,
        "ingested": "2024-11-25T05:55:39Z",
        "module": "vsphere"
    },
    "host": {
        "architecture": "x86_64",
        "containerized": true,
        "hostname": "elastic-agent-79780",
        "ip": [
            "192.168.241.4",
            "192.168.244.2"
        ],
        "mac": [
            "02-42-C0-A8-F1-04",
            "02-42-C0-A8-F4-02"
        ],
        "name": "elastic-agent-79780",
        "os": {
            "kernel": "3.10.0-1160.118.1.el7.x86_64",
            "name": "Wolfi",
            "platform": "wolfi",
            "type": "linux",
            "version": "20230201"
        }
    },
    "metricset": {
        "name": "virtualmachine",
        "period": 20000
    },
    "service": {
        "address": "https://svc-vsphere-metrics:8989/sdk",
        "type": "vsphere"
    },
    "tags": [
        "vsphere-virtualmachine"
    ],
    "vsphere": {
        "virtualmachine": {
            "cpu": {
                "free": {
                    "mhz": 0
                },
                "total": {
                    "mhz": 0
                },
                "used": {
                    "mhz": 0
                }
            },
            "datastore": {
                "count": 1,
                "names": "LocalDS_0"
            },
            "host": {
                "hostname": "DC0_C0_H1",
                "id": "host-43"
            },
            "id": "vm-62",
            "memory": {
                "free": {
                    "guest": {
                        "bytes": 33554432
                    }
                },
                "total": {
                    "guest": {
                        "bytes": 33554432
                    }
                },
                "used": {
                    "guest": {
                        "bytes": 0
                    },
                    "host": {
                        "bytes": 0
                    }
                }
            },
            "name": "DC0_C0_RP0_VM0",
            "network": {
                "count": 1,
                "names": "DC0_DVPG0"
            },
            "network_names": "DC0_DVPG0",
            "os": "otherGuest",
            "status": "green",
            "uptime": 0
        }
    }
}
ECS Field Reference
Please refer to the following document for detailed information on ECS fields.
Exported fields
| Field | Description | Type | Unit | Metric Type |
|---|---|---|---|---|
| @timestamp | Event timestamp. | date | ||
| agent.id | keyword | |||
| cloud.account.id | The cloud account or organization id used to identify different entities in a multi-tenant environment. Examples: AWS account id, Google Cloud ORG Id, or other unique identifier. | keyword | ||
| cloud.availability_zone | Availability zone in which this host, resource, or service is located. | keyword | ||
| cloud.instance.id | Instance ID of the host machine. | keyword | ||
| cloud.provider | Name of the cloud provider. Example values are aws, azure, gcp, or digitalocean. | keyword | ||
| cloud.region | Region in which this host, resource, or service is located. | keyword | ||
| container.id | Unique container id. | keyword | ||
| data_stream.dataset | Data stream dataset. | constant_keyword | ||
| data_stream.namespace | Data stream namespace. | constant_keyword | ||
| data_stream.type | Data stream type. | constant_keyword | ||
| event.dataset | Event dataset | constant_keyword | ||
| event.module | Event module | constant_keyword | ||
| host.containerized | If the host is a container. | boolean | ||
| host.name | Name of the host. It can contain what hostname returns on Unix systems, the fully qualified domain name, or a name specified by the user. The sender decides which value to use. |
keyword | ||
| host.os.build | OS build information. | keyword | ||
| host.os.codename | OS codename, if any. | keyword | ||
| service.address | Address where data about this service was collected from. This should be a URI, network address (ipv4:port or [ipv6]:port) or a resource path (sockets). | keyword | ||
| vsphere.virtualmachine.alert.names | List of all the alerts on this virtualmachine. | keyword | ||
| vsphere.virtualmachine.cpu.free.mhz | Available CPU in Mhz. | long | gauge | |
| vsphere.virtualmachine.cpu.total.mhz | Total Reserved CPU in Mhz. | long | counter | |
| vsphere.virtualmachine.cpu.usage.percent | CPU usage as a percentage. | scaled_float | ||
| vsphere.virtualmachine.cpu.used.mhz | Used CPU in Mhz. | long | gauge | |
| vsphere.virtualmachine.custom_fields | Custom fields. | object | ||
| vsphere.virtualmachine.datastore.count | Number of datastores associated to this virtualmachine. | long | gauge | |
| vsphere.virtualmachine.datastore.names | Names of the datastore associated to this virtualmachine. | keyword | ||
| vsphere.virtualmachine.disk.average.bytes | Aggregated disk I/O rate. | long | ||
| vsphere.virtualmachine.disk.numberRead.count | Number of times data was read. | long | ||
| vsphere.virtualmachine.disk.numberWrite.count | Number of disk writes. | long | ||
| vsphere.virtualmachine.disk.read.average.bytes | Rate at which data is read from each virtual disk on the virtual machine. | long | ||
| vsphere.virtualmachine.disk.write.average.bytes | Rate at which data is written to each virtual disk on the virtual machine. | long | ||
| vsphere.virtualmachine.host.hostname | Hostname of the host. | keyword | ||
| vsphere.virtualmachine.host.id | Host id. | keyword | ||
| vsphere.virtualmachine.id | Unique virtual machine ID. | keyword | ||
| vsphere.virtualmachine.memory.free.guest.bytes | Free memory of Guest in bytes. | long | byte | gauge |
| vsphere.virtualmachine.memory.total.guest.bytes | Total memory of Guest in bytes. | long | byte | gauge |
| vsphere.virtualmachine.memory.usage.percent | Memory usage as percent of total configured or available memory. | scaled_float | ||
| vsphere.virtualmachine.memory.used.guest.bytes | Used memory of Guest in bytes. | long | byte | gauge |
| vsphere.virtualmachine.memory.used.host.bytes | Used memory of Host in bytes. | long | byte | gauge |
| vsphere.virtualmachine.name | Virtual machine name. | keyword | ||
| vsphere.virtualmachine.network.count | Number of networks associated to this virtualmachine. | long | gauge | |
| vsphere.virtualmachine.network.names | Names of the networks associated to this virtualmachine. | keyword | ||
| vsphere.virtualmachine.network_names | Network names. | keyword | ||
| vsphere.virtualmachine.os | Virtual machine operating system name. | keyword | ||
| vsphere.virtualmachine.snapshot.count | The number of snapshots of this virtualmachine. | long | gauge | |
| vsphere.virtualmachine.snapshot.info.createtime | Snapshot creation time. | date | ||
| vsphere.virtualmachine.snapshot.info.description | Snapshot description. | keyword | ||
| vsphere.virtualmachine.snapshot.info.id | Snapshot ID. | long | ||
| vsphere.virtualmachine.snapshot.info.name | Snapshot name. | keyword | ||
| vsphere.virtualmachine.snapshot.info.state | Snapshot state (e.g., poweredOn). | keyword | ||
| vsphere.virtualmachine.status | Overall health and status of a virtual machine. | keyword | ||
| vsphere.virtualmachine.triggered_alarms.description | Description of the alarm. | keyword | ||
| vsphere.virtualmachine.triggered_alarms.entity_name | Name of the entity associated with the alarm. | keyword | ||
| vsphere.virtualmachine.triggered_alarms.id | Unique identifier for the alarm. | keyword | ||
| vsphere.virtualmachine.triggered_alarms.name | Name of the alarm. | keyword | ||
| vsphere.virtualmachine.triggered_alarms.status | Status of the alarm. | keyword | ||
| vsphere.virtualmachine.triggered_alarms.triggered_time | Time when the alarm was triggered. | date | ||
| vsphere.virtualmachine.uptime | The uptime of the VM in seconds. | long | counter | |
| vsphere.virtualmachine.warning.names | List of all the warnings on this virtualmachine. | keyword |
If you encounter any issues during the setup or usage of the VMware vSphere integration, particularly with regards to Data Collection Intervals, with agent error messages such as Failed to query performance metrics: ServerFaultCode: A specified parameter was not correct: querySpec.interval, please refer to the mentioned Important Notes/Supported Periods for guidance and resolution.
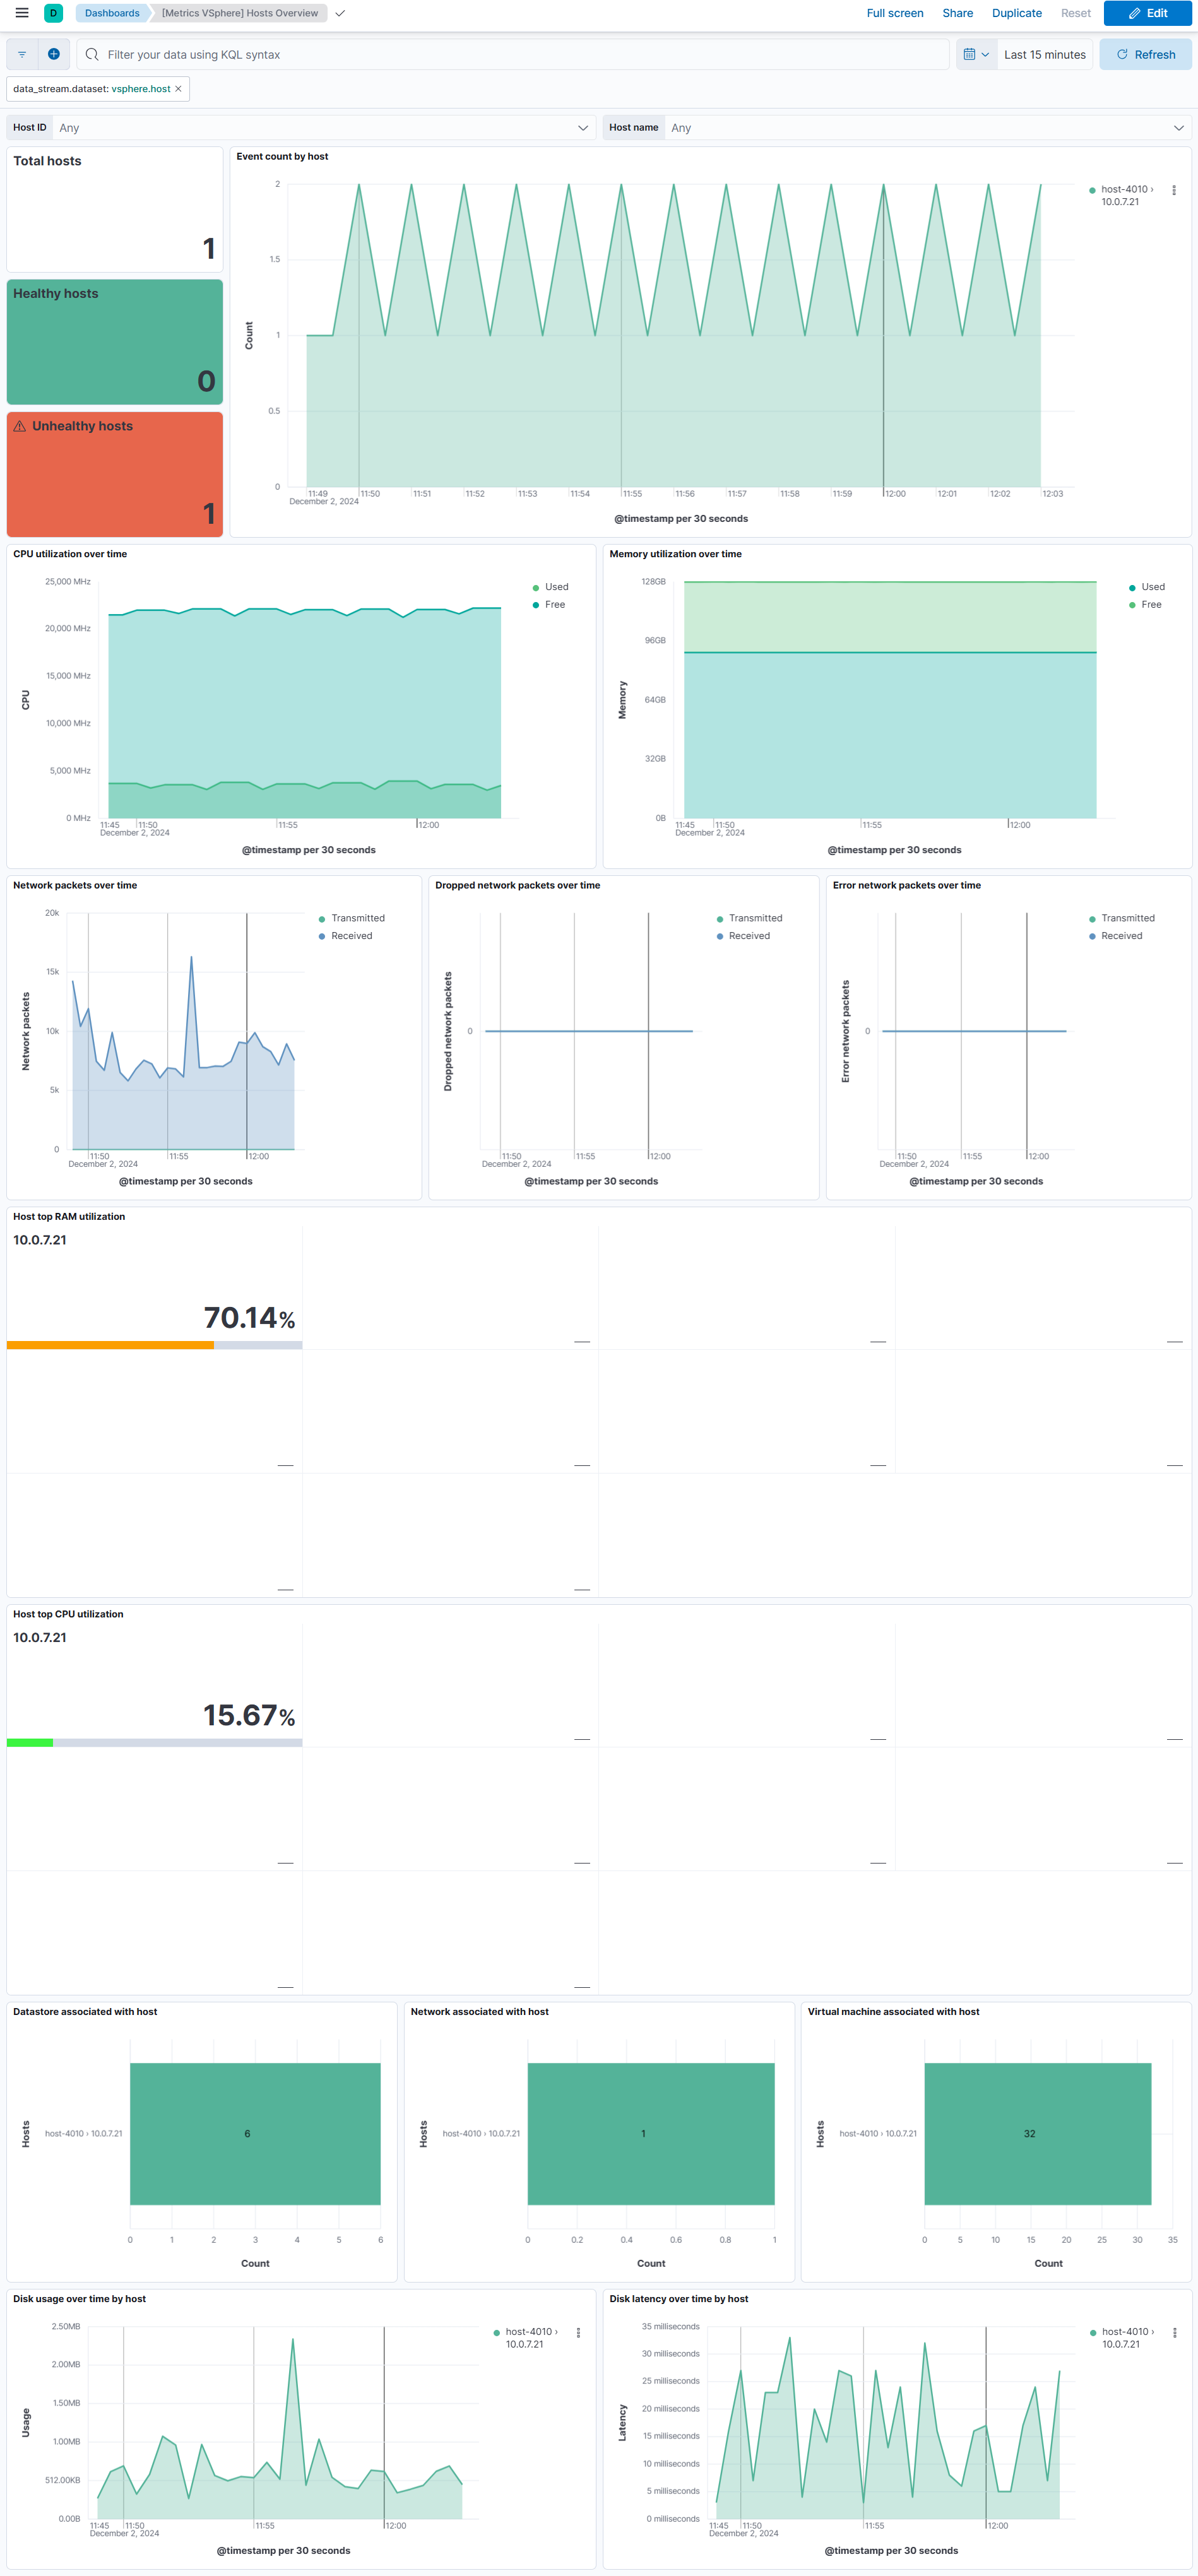
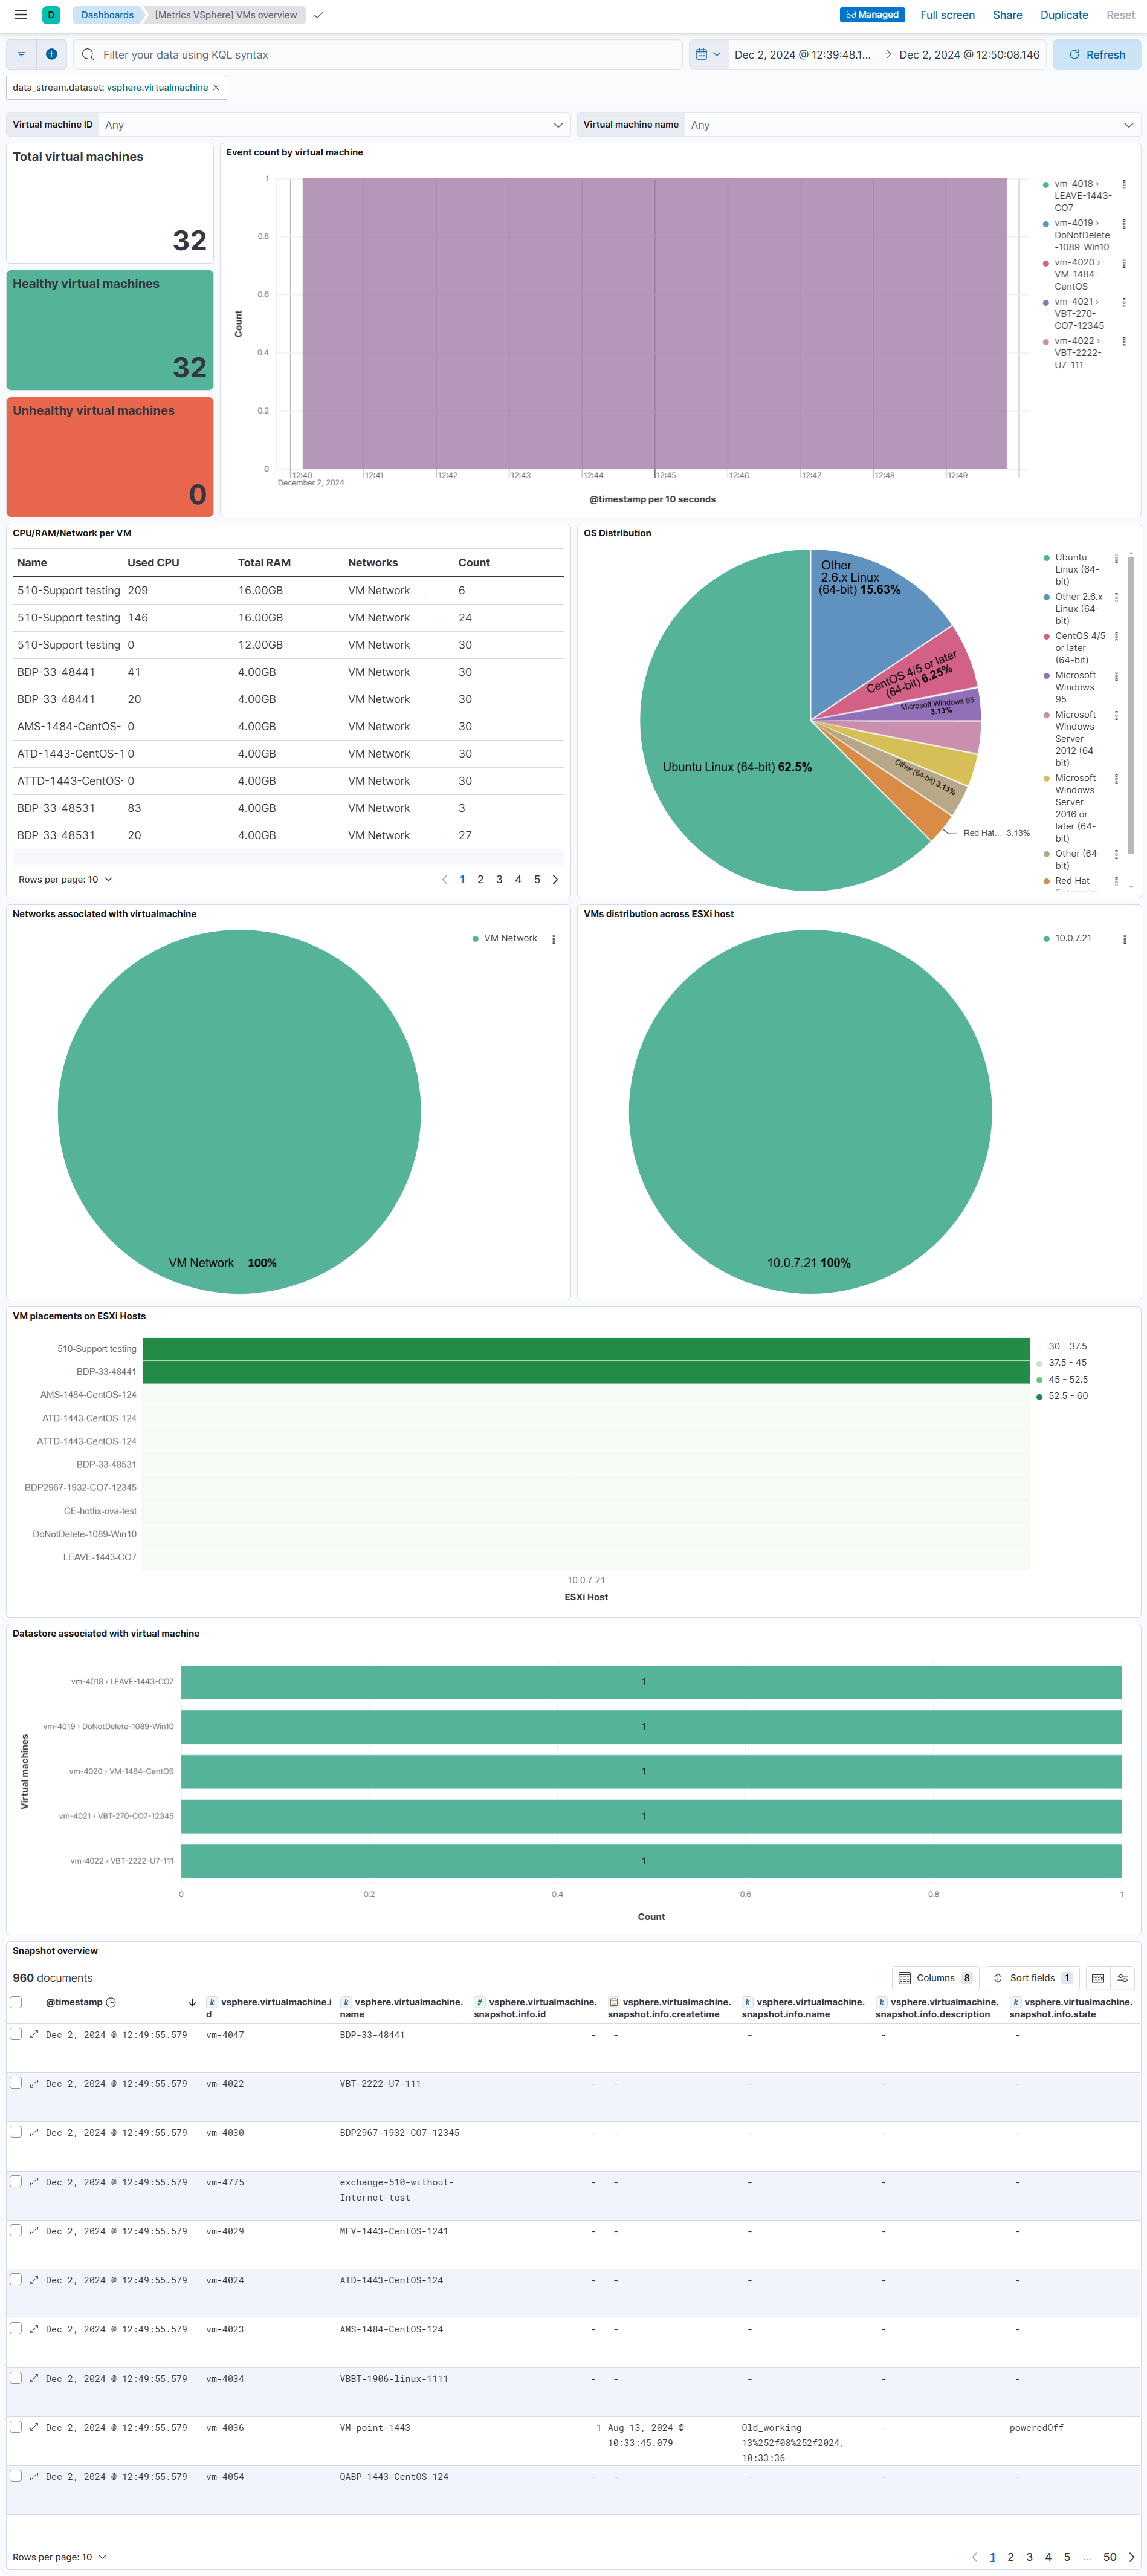
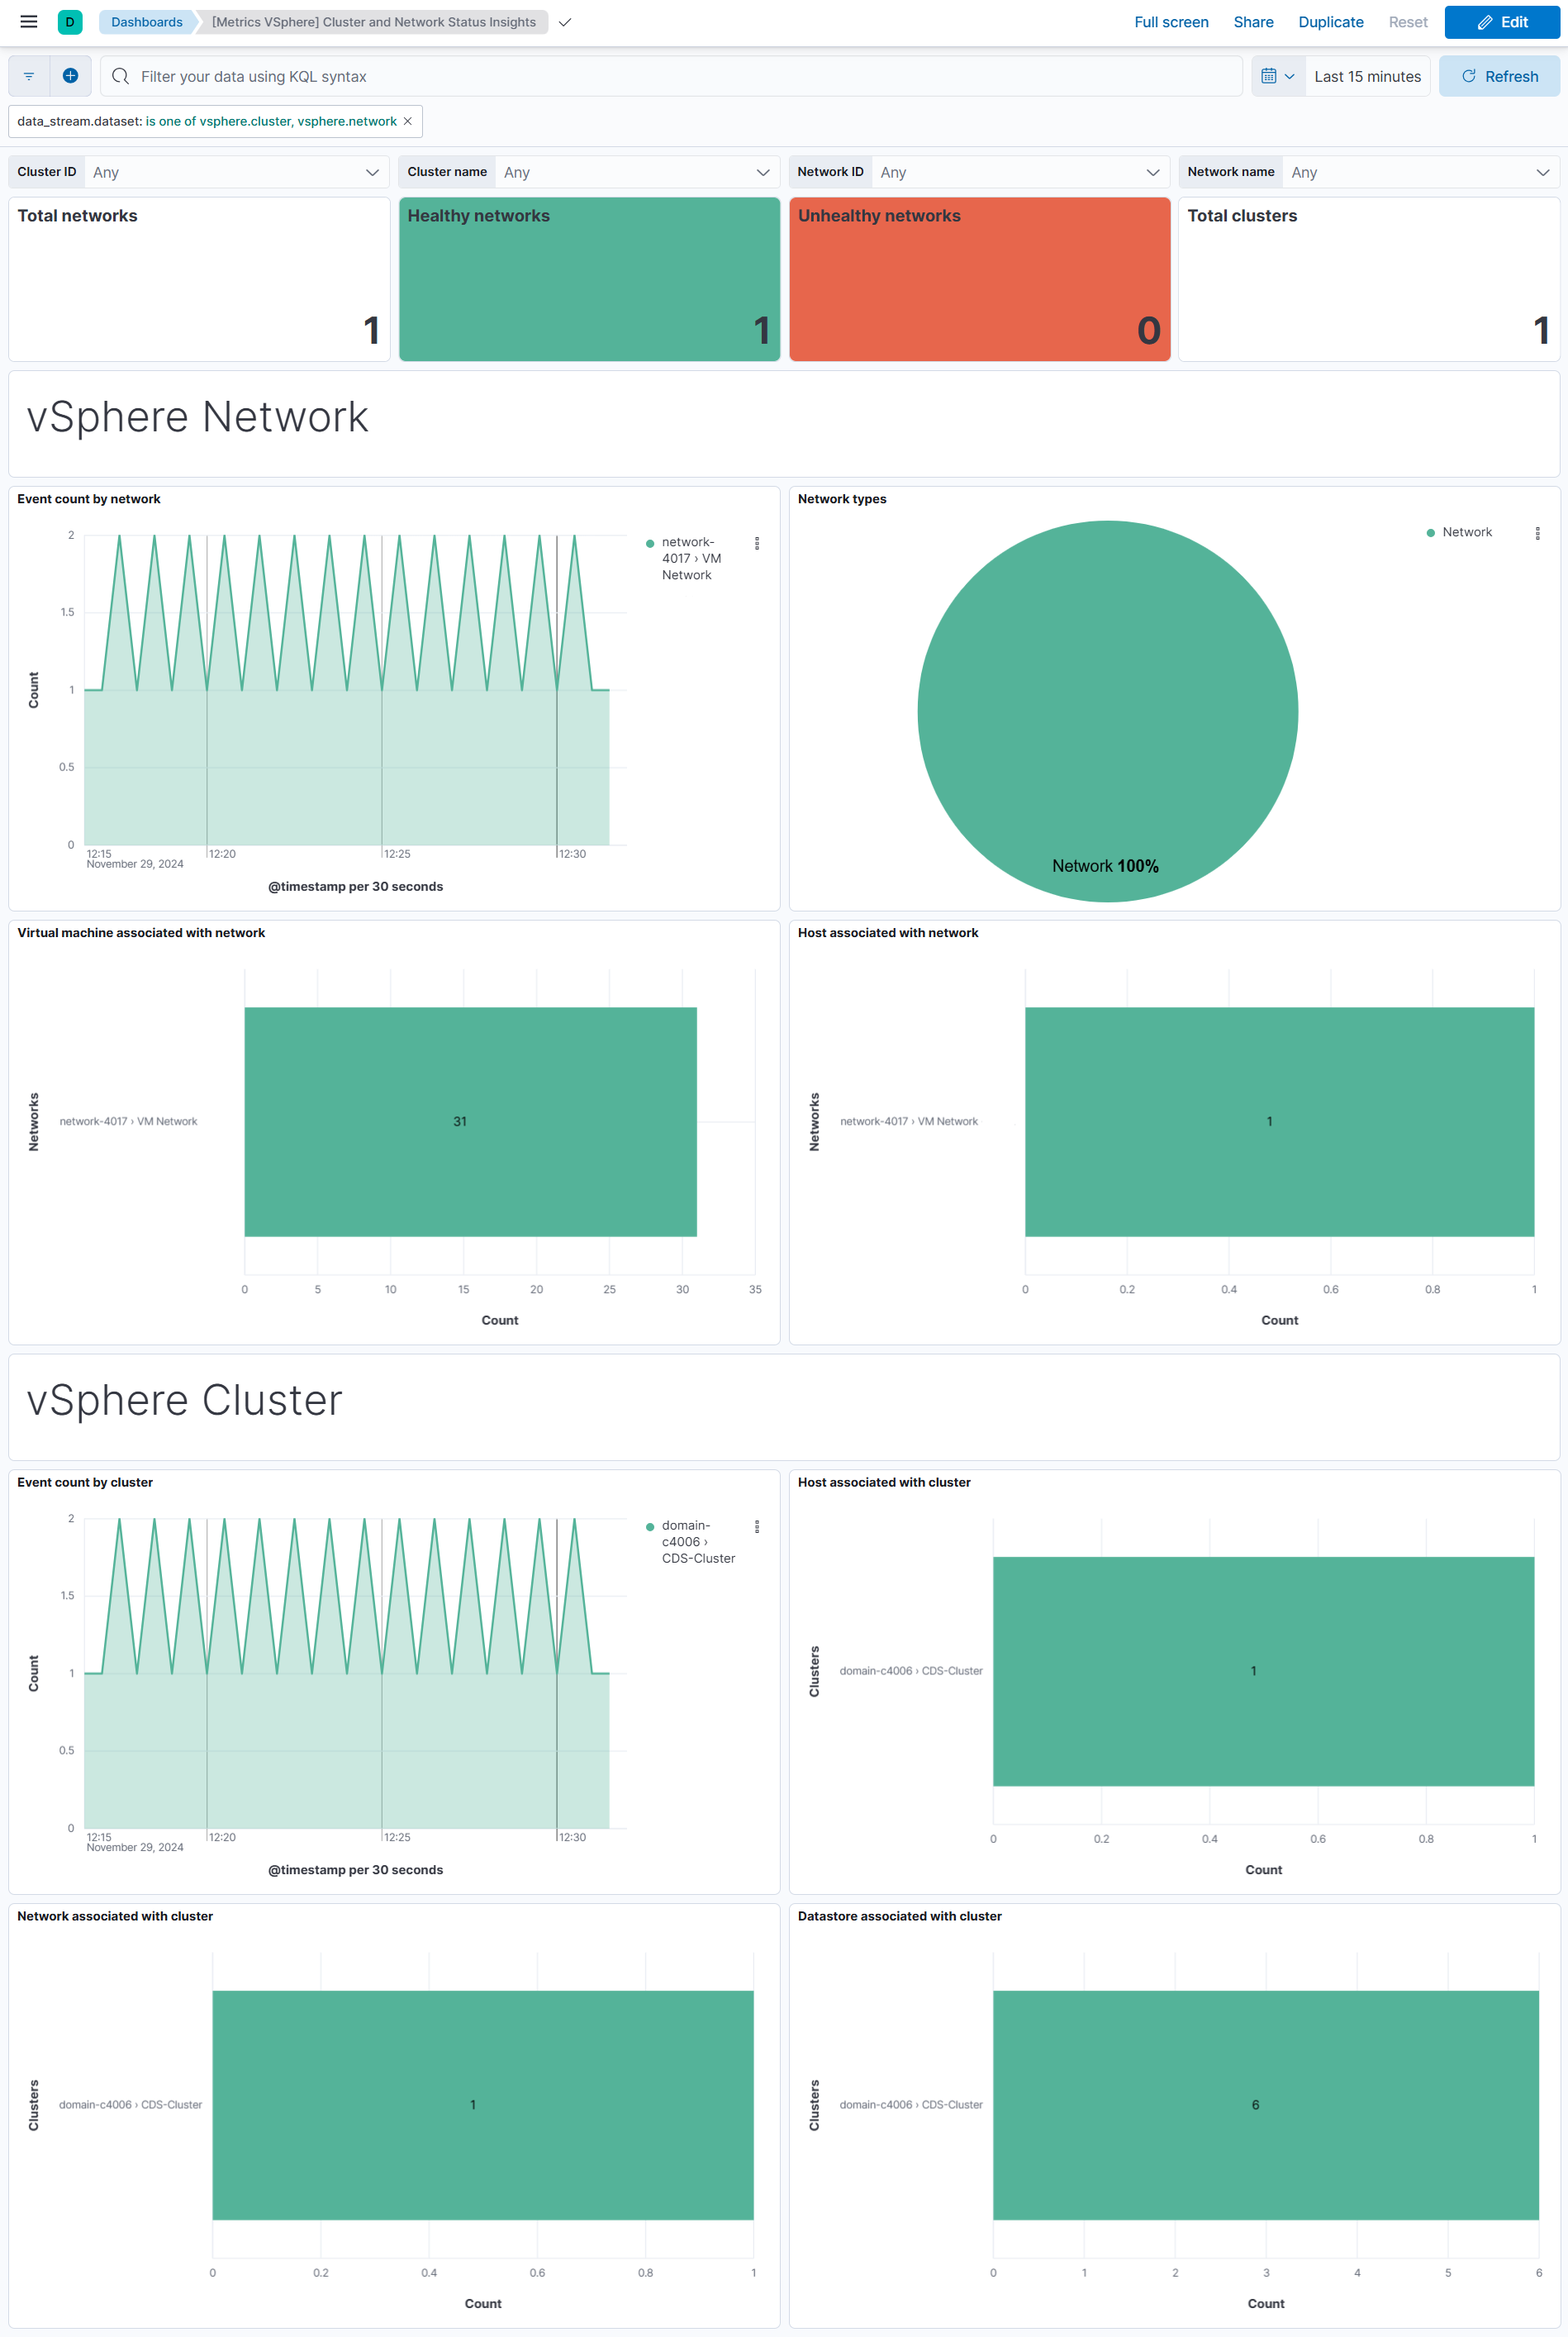
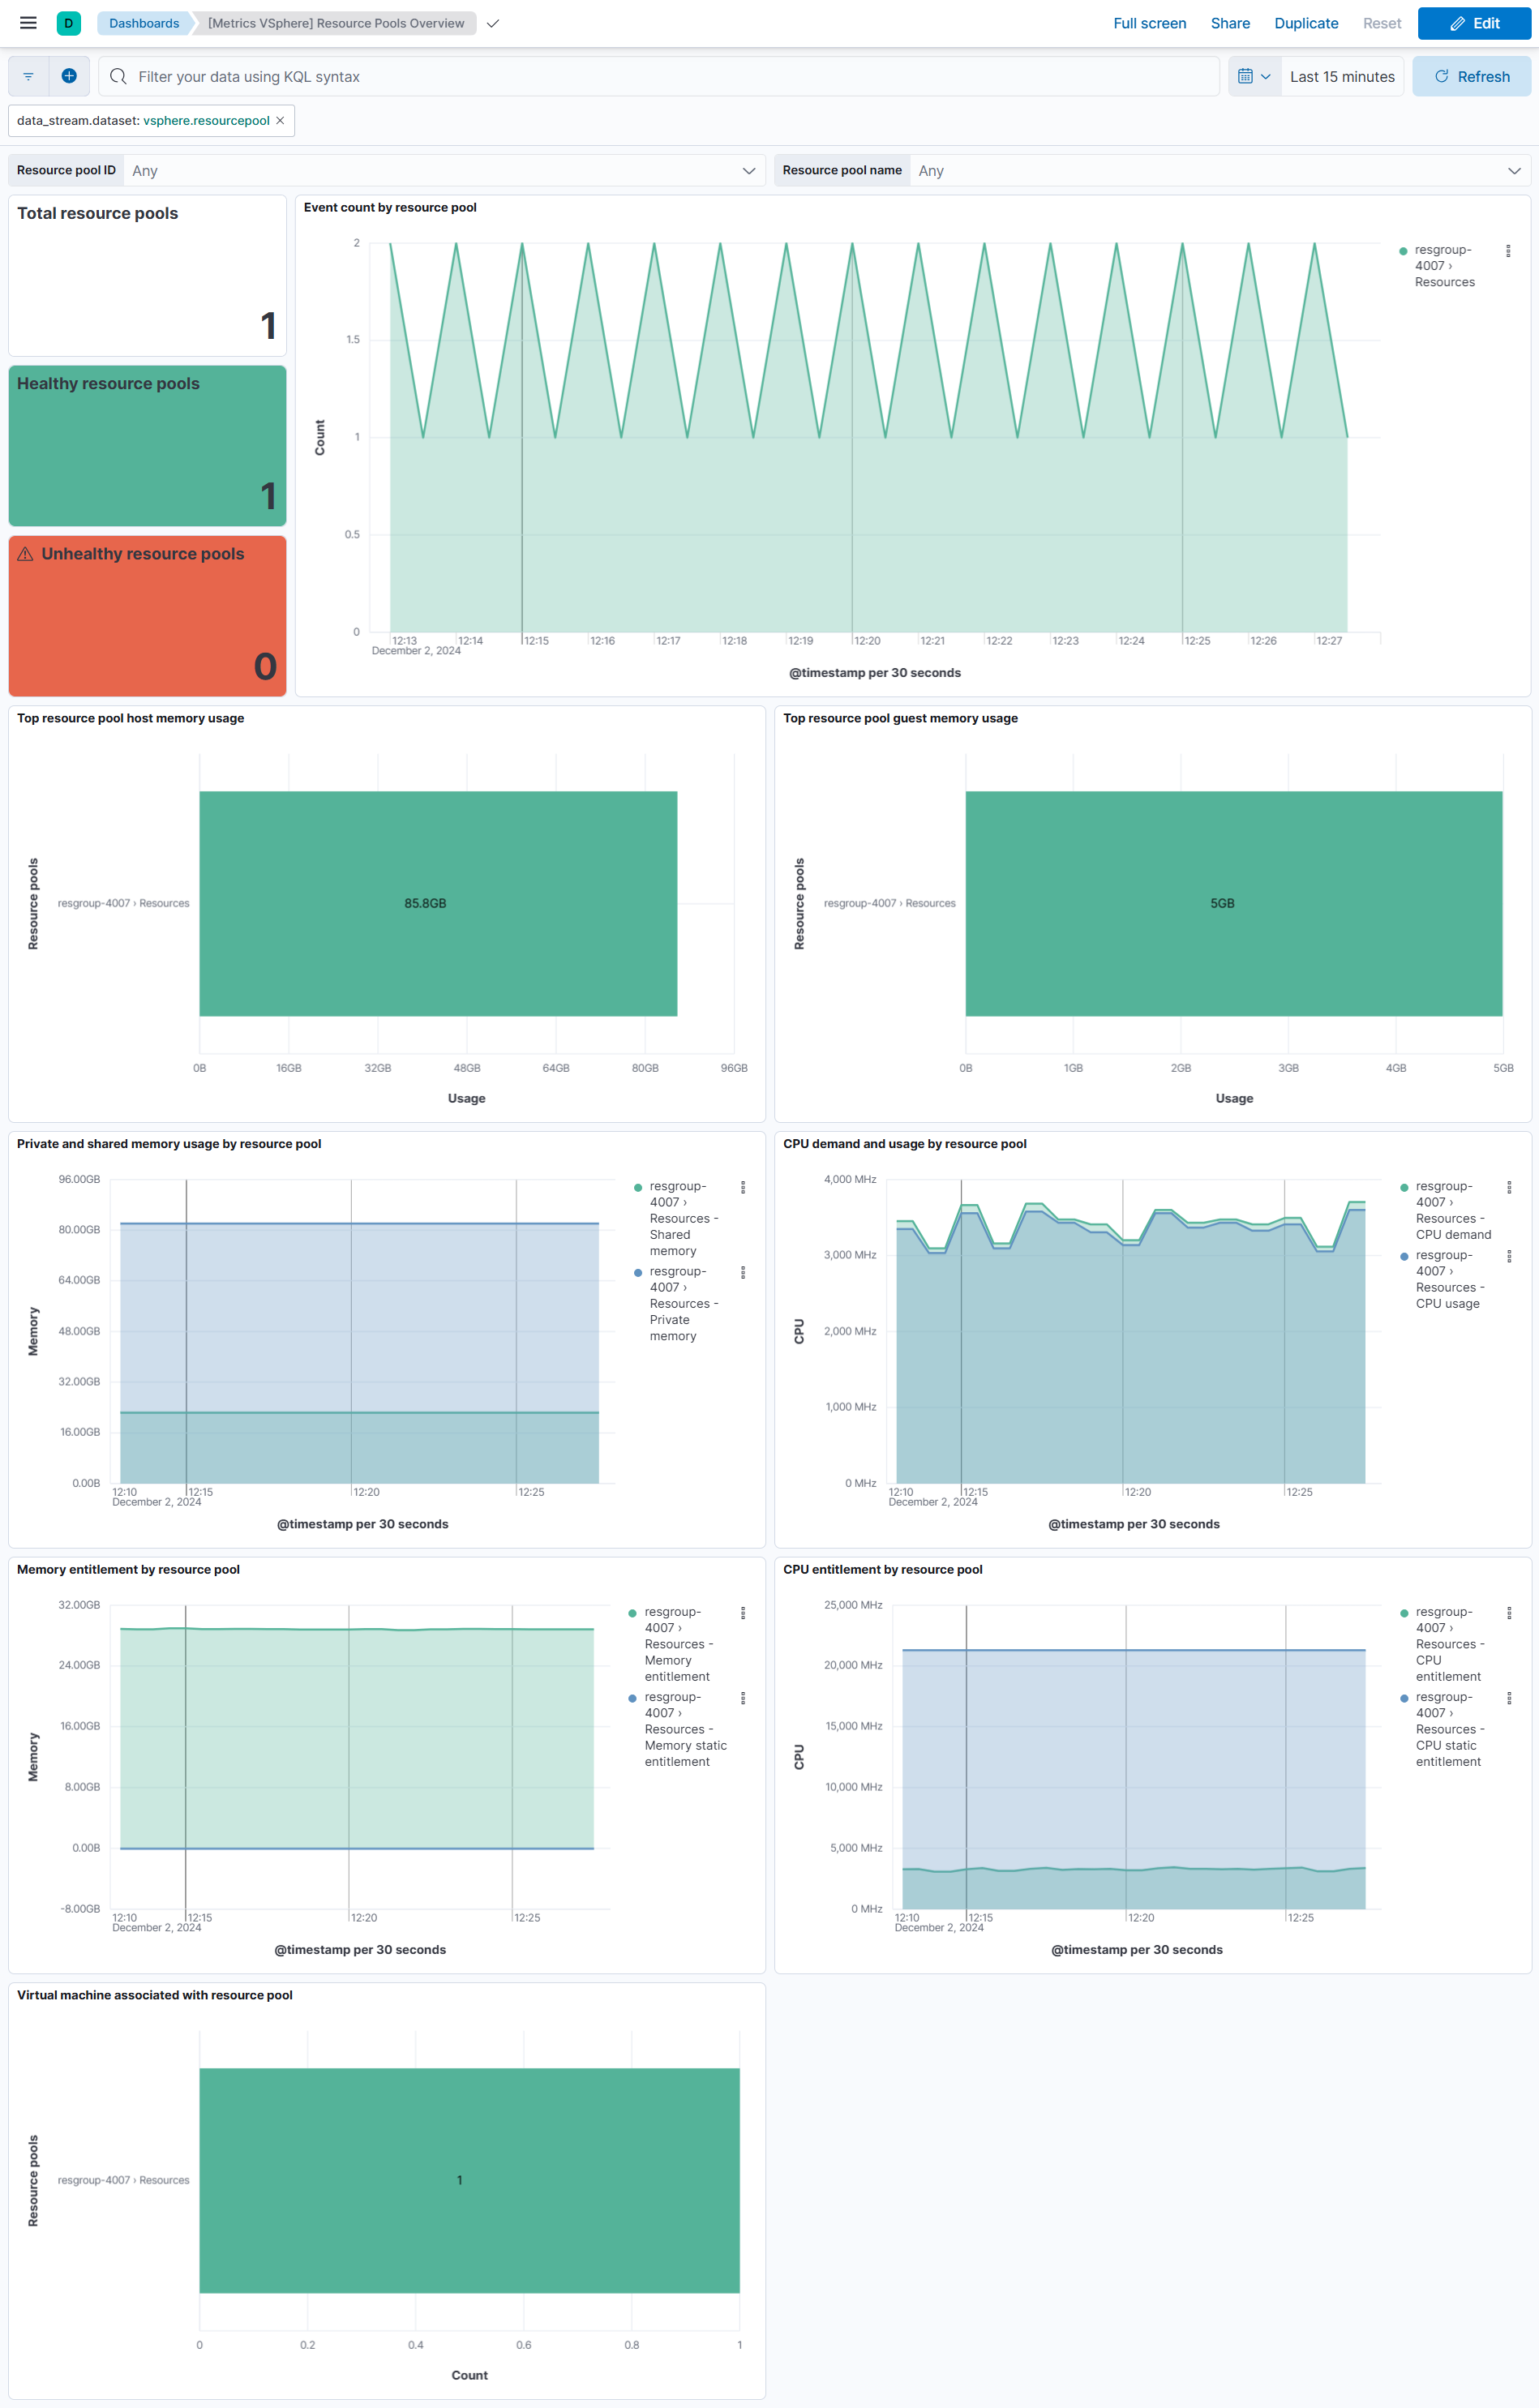
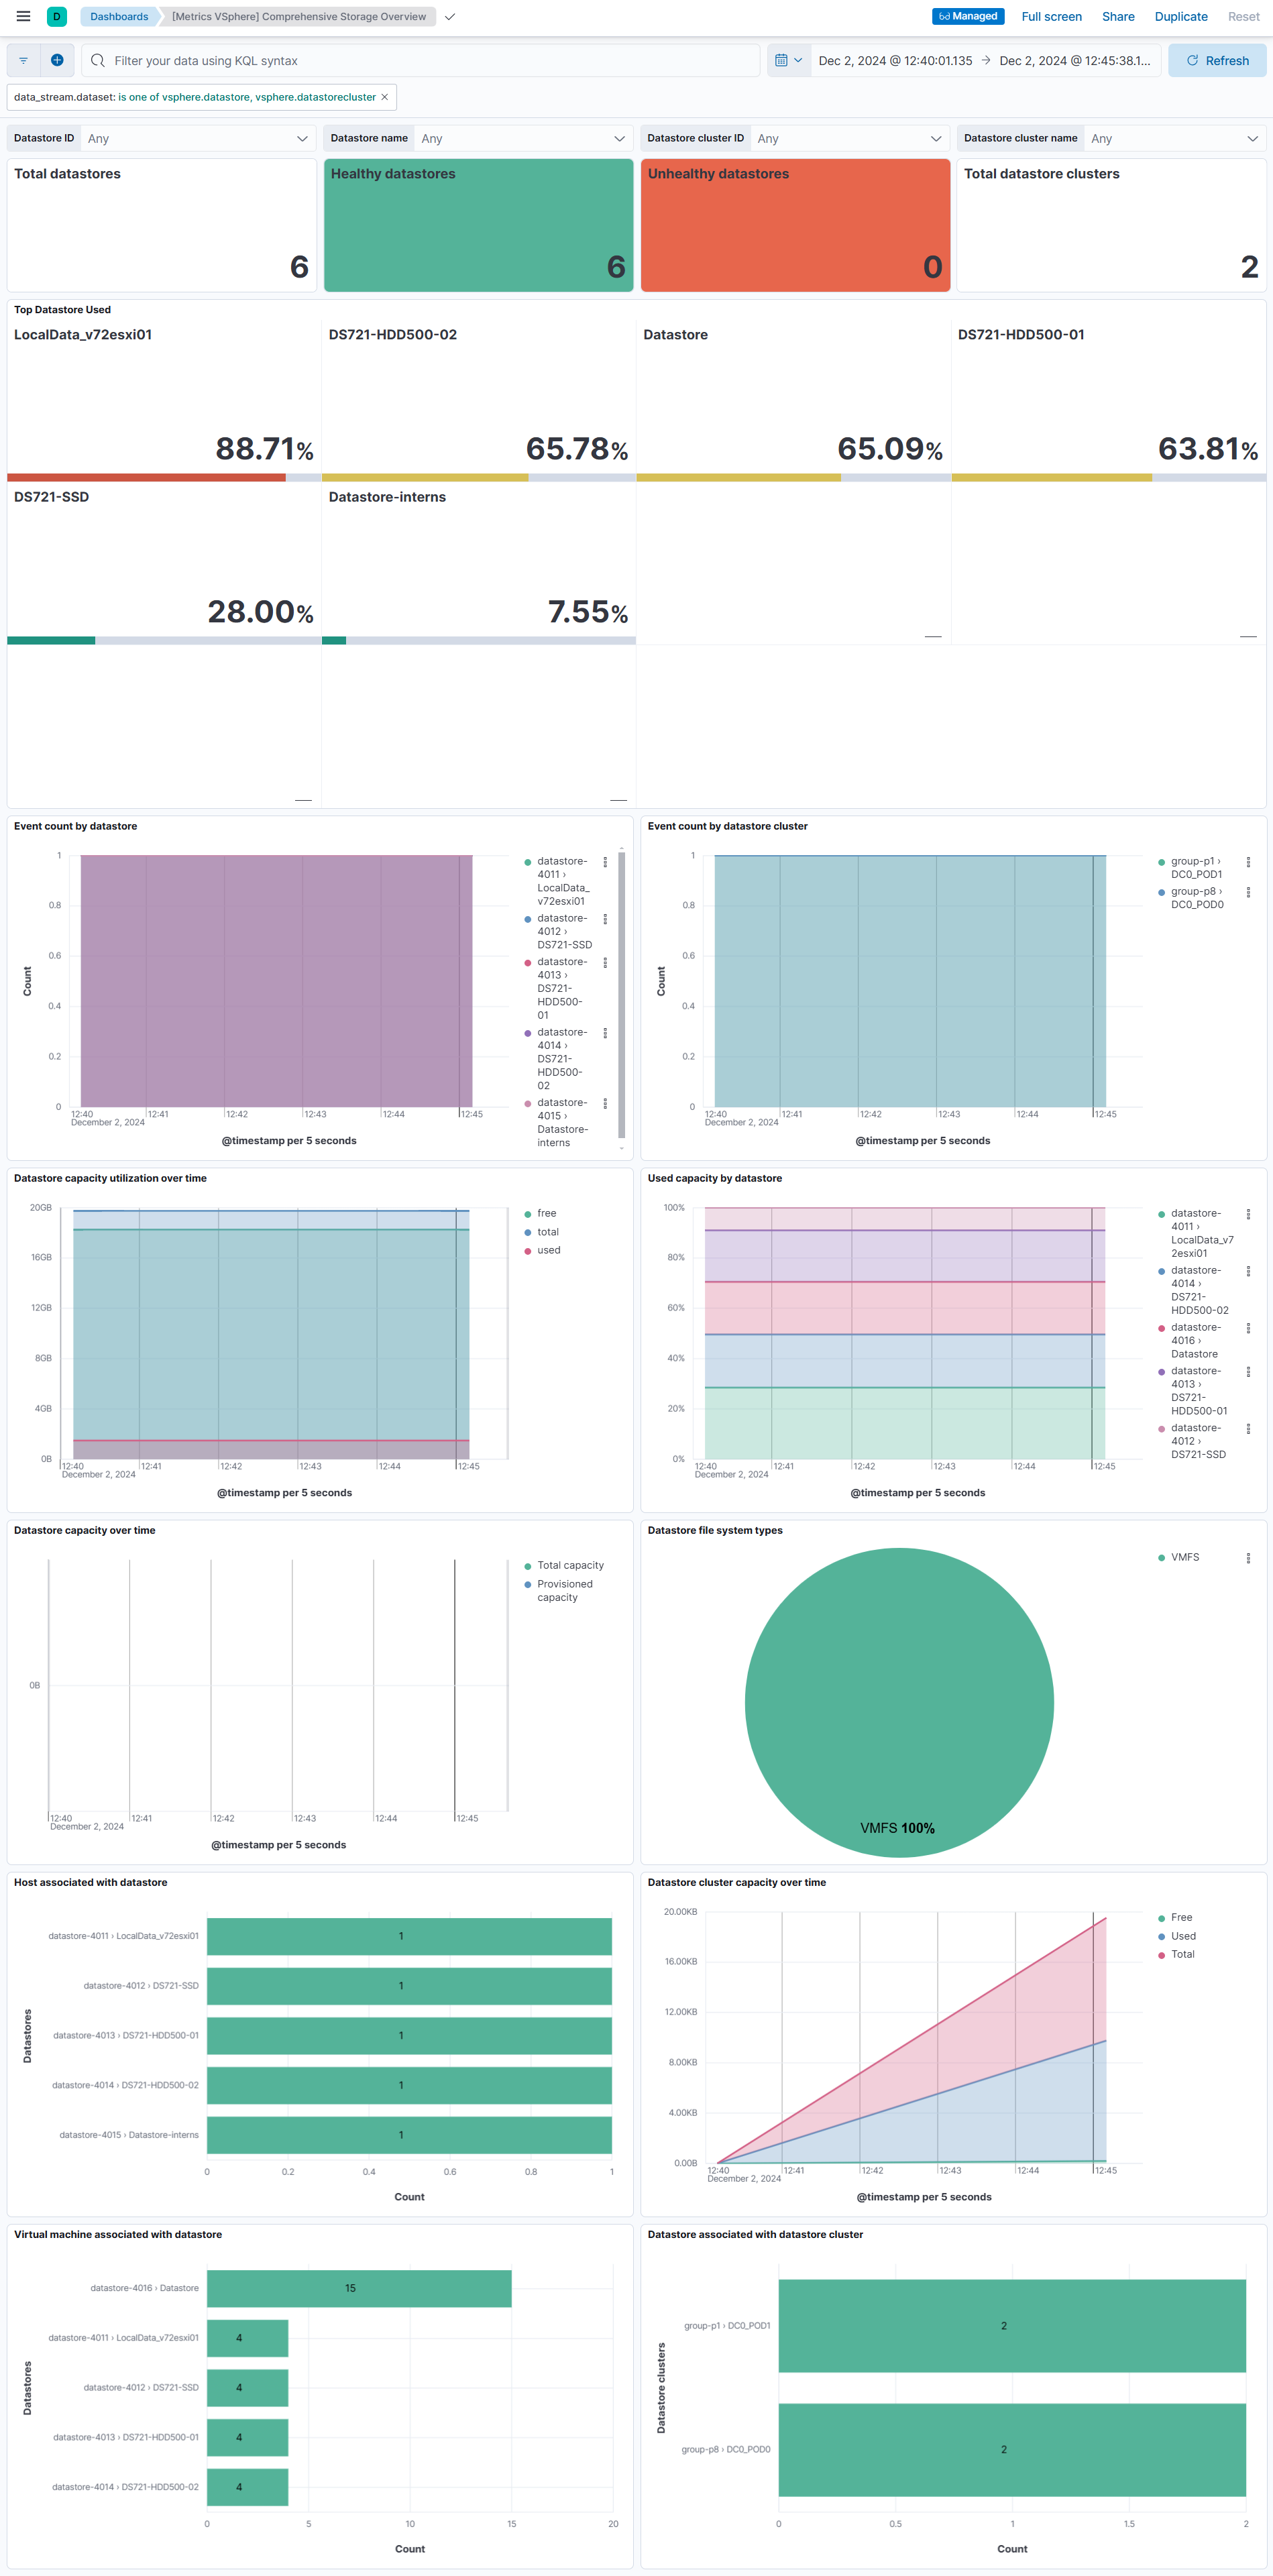
This integration includes one or more Kibana dashboards that visualizes the data collected by the integration. The screenshots below illustrate how the ingested data is displayed.
Changelog
| Version | Details | Minimum Kibana version |
|---|---|---|
| 1.25.1 | Bug fix (View pull request) Extract event.id from RFC 5424 structured data. |
9.1.0 8.19.0 |
| 1.25.0 | Bug fix (View pull request) Fix parsing of RFC 5424 syslog messages with structured data in the log ingest pipeline |
9.1.0 8.19.0 |
| 1.24.2 | Bug fix (View pull request) Fix parsing of sshd Connection closed messages with no content after the port number in the log ingest pipeline. |
9.1.0 8.19.0 |
| 1.24.1 | Bug fix (View pull request) Parse space-separated vSphere log timestamps (for example: 2026-06-03 14:19:27.782) in the log ingest pipeline. |
9.1.0 8.19.0 |
| 1.24.0 | Enhancement (View pull request) Populate ECS fields source.ip and related.ip from client.ip in vSphere log ingest pipelines for login and file events. |
9.1.0 8.19.0 |
| 1.23.1 | Bug fix (View pull request) fix log data stream flaky system test |
9.1.0 8.19.0 |
| 1.23.0 | Enhancement (View pull request) add resource pool id to vsphere cluster data stream |
9.1.0 8.19.0 |
| 1.22.1 | Bug fix (View pull request) add support for RFC3164 timestamp in syslog |
9.1.0 8.19.0 |
| 1.22.0 | Enhancement (View pull request) Add extra grok pattern to cover more log formats |
9.1.0 8.19.0 |
| 1.21.0 | Enhancement (View pull request) Improve documentation |
9.1.0 8.19.0 |
| 1.20.0 | Enhancement (View pull request) Add new metrics to vSphere Virtual Machine dataset (CPU usage percentage, disk average usage, disk read/write rate, number of disk reads/writes, memory usage percentage). |
9.1.0 8.19.0 |
| 1.19.0 | Enhancement (View pull request) Allow @custom pipeline access to event.original without setting preserve_original_event. |
9.0.0 8.16.2 |
| 1.18.2 | Enhancement (View pull request) Updated vSphere supported versions in documentation. |
9.0.0 8.16.2 |
| 1.18.1 | Bug fix (View pull request) Updated SSL description to be uniform and to include links to documentation. |
9.0.0 8.16.2 |
| 1.18.0 | Enhancement (View pull request) Add support for Kibana 9.0.0. |
9.0.0 8.16.2 |
| 1.17.0 | Enhancement (View pull request) Add support for Shared Secrets /SSL Thumbprint Logins and add more granular filtering for file pipeline |
8.16.2 |
| 1.16.4 | Bug fix (View pull request) Update links to getting started docs |
8.16.2 |
| 1.16.3 | Enhancement (View pull request) Add new dashboards and update existing dashboards. Enhancement (View pull request) Add the id field to all data streams to improve identification and tracking. |
8.16.2 |
| 1.16.2 | Enhancement (View pull request) Apply doc guidelines and general editing. |
8.15.2 |
| 1.16.1 | Enhancement (View pull request) Update host datastream sample event. |
8.15.2 |
| 1.16.0 | Enhancement (View pull request) Add SSL/TLS support for vSphere logs tcp input. |
8.15.2 |
| 1.15.0 | Enhancement (View pull request) Release new integration version. Enhancement (View pull request) Update README and fix Resourcepool datastream TSDB. Enhancement (View pull request) Filter alerts and warnings in all datastreams. Bug fix (View pull request) Fix issue with TSDB network.name. Enhancement (View pull request) Add new network datastream. Enhancement (View pull request) Add new datastorecluster datastream. Enhancement (View pull request) Add additional metrics for virtualmachine datastream. Enhancement (View pull request) Add resourcepool datastream. Enhancement (View pull request) Add cluster datastream. Enhancement (View pull request) Add additional metrics for datastore datastream. Enhancement (View pull request) Add additional metrics for host datastream. |
8.15.2 |
| 1.14.0 | Enhancement (View pull request) Add support for processors in datastore, host and virtualmachine. |
8.13.0 |
| 1.13.0 | Enhancement (View pull request) ECS version updated to 8.11.0. Update the kibana constraint to ^8.13.0. Modified the field definitions to remove ECS fields made redundant by the ecs@mappings component template. |
8.13.0 |
| 1.12.0 | Enhancement (View pull request) Add global filter on data_stream.dataset to improve performance. |
8.12.0 |
| 1.11.1 | Enhancement (View pull request) Add more specific details to vSphere logs configuration documentation. |
8.12.0 |
| 1.11.0 | Enhancement (View pull request) Enable 'secret' for the sensitive fields. |
8.12.0 |
| 1.10.1 | Enhancement (View pull request) Update details on vSphere logs configuration. |
8.10.2 |
| 1.10.0 | Enhancement (View pull request) Add support for more vSphere and ESXi logs. |
8.10.2 |
| 1.9.2 | Bug fix (View pull request) Add null and ignore_missing check to handle event.original field. |
8.8.0 |
| 1.9.1 | Bug fix (View pull request) Update the README with limitations in Virtual Machine metrics. |
8.8.0 |
| 1.9.0 | Enhancement (View pull request) Update the package format_version to 3.0.0. |
8.8.0 |
| 1.8.0 | Enhancement (View pull request) Enable time series data streams for the metrics datasets. This dramatically reduces storage for metrics and is expected to progressively improve query performance. For more details, see https://www.elastic.co/guide/en/elasticsearch/reference/current/tsds.html. |
8.8.0 |
| 1.7.2 | Enhancement (View pull request) Add dimensions field mapping for virtualmachine datastream to support TSDB. |
8.7.0 |
| 1.7.1 | Enhancement (View pull request) Add dimensions field mapping for host datastream to support TSDB. |
8.7.0 |
| 1.7.0 | Enhancement (View pull request) Add dimensions field mapping for datastore datastream to support TSDB. |
8.7.0 |
| 1.6.0 | Enhancement (View pull request) Rename ownership from obs-service-integrations to obs-infraobs-integrations |
8.7.0 |
| 1.5.0 | Enhancement (View pull request) Migrate "VMs Overview" dashboard visualizations to lens. |
8.7.0 |
| 1.4.0 | Enhancement (View pull request) Migrate "Hosts Overview" dashboard visualizations to lens. |
8.7.0 |
| 1.3.2 | Enhancement (View pull request) Added categories and/or subcategories. |
8.0.0 7.15.0 |
| 1.3.1 | Bug fix (View pull request) Update the PR number in changelog version 1.2.1. |
8.0.0 7.15.0 |
| 1.3.0 | Enhancement (View pull request) Update ECS version to 8.5.1 |
8.0.0 7.15.0 |
| 1.2.1 | Bug fix (View pull request) Change the way host cpu and memory percentage is calculated. |
8.0.0 7.15.0 |
| 1.2.0 | Enhancement (View pull request) Added infrastructure category. |
8.0.0 7.15.0 |
| 1.0.1 | Bug fix (View pull request) Make Domain optional in grok pattern |
8.0.0 7.15.0 |
| 1.0.0 | Enhancement (View pull request) Release as GA |
8.0.0 7.15.0 |
| 0.1.2 | Enhancement (View pull request) Update package name and description to align with standard wording |
8.0.0 7.15.0 |
| 0.1.1 | Enhancement (View pull request) Add documentation for multi-fields |
— |
| 0.1.0 | Enhancement (View pull request) Support Kibana 8.0 |
8.0.0 7.15.0 |
| 0.0.2 | Bug fix (View pull request) Fix logic that checks for the 'forwarded' tag |
— |
| 0.0.1 | Enhancement (View pull request) Initial draft of the package |
— |