Kafka integration
Elastic Cloud Serverless projects are autoscaled environments, fully managed by Elastic and available on Elastic Cloud. Availability This functionality is generally available and ready for production usage. Elastic Cloud Serverless projects are autoscaled environments, fully managed by Elastic and available on Elastic Cloud. Availability This functionality is generally available and ready for production usage. The Elastic Stack includes Elastic's core products such as Elasticsearch, Kibana, Logstash, and Beats. Availability This functionality is generally available and ready for production usage. Unless stated otherwise on the page, this functionality is available when your Elastic Stack is deployed on Elastic Cloud Hosted, Elastic Cloud Enterprise, Elastic Cloud on Kubernetes, and self-managed environments. This documentation corresponds to the latest patch available for each minor version. If you're not using the latest patch, check the release notes for changes.
Serverless Observability
Generally available
Serverless Security
Generally available
Stack
9.0+
Generally available since 9.0
| Version | 1.27.3 (View all) |
| Subscription level What's this? |
Basic |
| Developed by What's this? |
Elastic |
| Ingestion method(s) | File, Jolokia |
| Minimum Kibana version(s) | 9.0.6 8.19.6 |
This integration collects logs and metrics from Kafka servers.
The log dataset is tested with logs from Kafka 0.9, 1.1.0 and 2.0.0.
The broker, consumergroup, partition datastreams are tested with Kafka 0.10.2.1, 1.1.0, 2.1.1, 2.2.2, 3.6.0, 4.0.0.
The broker, consumer, controller, jvm, log_manager, network, producer, raft, replica_manager, topic metricsets require Jolokia to fetch JMX metrics. Refer to the How do I deploy this integration? section below for more information.
The partition and consumergroup datastreams connect directly to Kafka brokers and require a minimum Elastic Agent version when used with Kafka 4.x.
| Elastic Agent version | Minimum required version |
|---|---|
| 8.19.x | 8.19.6 |
| 9.0.x | 9.0.7 |
| 9.1.x | 9.1.4 |
| 9.2.x and later | All versions |
Using an Elastic Agent version older than the minimum required version results in collection failures for the partition and consumergroup datastreams when connecting to Kafka 4.x brokers. This limitation applies regardless of the integration version.
The following datastreams are not affected:
log- Jolokia-based datastreams
To monitor a Kafka component (such as a broker, producer, or consumer) with Jolokia, you need to attach its JVM agent to the Java process.
Download the Jolokia JVM-Agent from the official website.
Attach the Agent via KAFKA_OPTS by setting the
KAFKA_OPTSenvironment variable before starting your Kafka process.
For example, to launch a console producer with the Jolokia agent enabled:
# Set the KAFKA_OPTS variable to point to the agent JAR
export KAFKA_OPTS="-javaagent:/path/to/jolokia-jvm-agent.jar=port=8778,host=localhost"

# Start the Kafka producer script
./bin/kafka-console-producer.sh --topic test --broker-list kafka_host:9092
Make sure to replace /path/to/jolokia-jvm-agent.jar with the actual path to the agent you downloaded.
The port and host parameters specify where the Jolokia agent will be accessible.
The log dataset collects and parses logs from Kafka servers.
ECS Field Reference
Please refer to the following document for detailed information on ECS fields.
Exported fields
| Field | Description | Type |
|---|---|---|
| @timestamp | Event timestamp. | date |
| cloud.image.id | Image ID for the cloud instance. | keyword |
| data_stream.dataset | Data stream dataset. | constant_keyword |
| data_stream.namespace | Data stream namespace. | constant_keyword |
| data_stream.type | Data stream type. | constant_keyword |
| event.dataset | Event dataset | constant_keyword |
| event.module | Event module | constant_keyword |
| host.containerized | If the host is a container. | boolean |
| host.os.build | OS build information. | keyword |
| host.os.codename | OS codename, if any. | keyword |
| kafka.log.class | Java class the log is coming from. | keyword |
| kafka.log.component | Component the log is coming from. | keyword |
| kafka.log.thread | Thread name the log is coming from. | keyword |
| kafka.log.trace.class | Java class the trace is coming from. | keyword |
| kafka.log.trace.message | Message part of the trace. | text |
The broker dataset collects JMX metrics from Kafka brokers using Jolokia.
Example
{
    "@timestamp": "2020-05-15T15:12:12.270Z",
    "agent": {
        "ephemeral_id": "178ff0e9-e3dd-4bdf-8e3d-8f67a6bd72ef",
        "id": "5aba67f2-2050-4d19-8953-ba20f0a5483c",
        "name": "kafka-01",
        "type": "metricbeat",
        "version": "8.0.0"
    },
    "ecs": {
        "version": "8.11.0"
    },
    "event": {
        "dataset": "kafka.broker",
        "duration": 4572918,
        "module": "kafka"
    },
    "kafka": {
        "broker": {
            "mbean": "kafka.server:name=BytesOutPerSec,topic=messages,type=BrokerTopicMetrics",
            "topic": {
                "net": {
                    "out": {
                        "bytes_per_sec": 0.6089809926927563
                    }
                }
            }
        }
    },
    "metricset": {
        "name": "broker",
        "period": 10000
    },
    "service": {
        "address": "localhost:8778",
        "type": "kafka"
    }
}
ECS Field Reference
Please refer to the following document for detailed information on ECS fields.
Exported fields
| Field | Description | Type | Metric Type |
|---|---|---|---|
| @timestamp | Event timestamp. | date | |
| agent.id | keyword | ||
| cloud.account.id | The cloud account or organization id used to identify different entities in a multi-tenant environment. Examples: AWS account id, Google Cloud ORG Id, or other unique identifier. | keyword | |
| cloud.availability_zone | Availability zone in which this host is running. | keyword | |
| cloud.image.id | Image ID for the cloud instance. | keyword | |
| cloud.instance.id | Instance ID of the host machine. | keyword | |
| cloud.provider | Name of the cloud provider. Example values are aws, azure, gcp, or digitalocean. | keyword | |
| cloud.region | Region in which this host is running. | keyword | |
| container.id | Unique container id. | keyword | |
| data_stream.dataset | Data stream dataset. | constant_keyword | |
| data_stream.namespace | Data stream namespace. | constant_keyword | |
| data_stream.type | Data stream type. | constant_keyword | |
| event.dataset | Event dataset | constant_keyword | |
| event.module | Event module | constant_keyword | |
| host.containerized | If the host is a container. | boolean | |
| host.name | Name of the host. It can contain what hostname returns on Unix systems, the fully qualified domain name, or a name specified by the user. The sender decides which value to use. |
keyword | |
| host.os.build | OS build information. | keyword | |
| host.os.codename | OS codename, if any. | keyword | |
| kafka.broker.address | Broker advertised address | keyword | |
| kafka.broker.id | Broker id | long | |
| kafka.broker.log.flush_rate | The log flush rate | float | gauge |
| kafka.broker.mbean | Mbean that this event is related to | keyword | |
| kafka.broker.messages_in | The incoming message rate | float | gauge |
| kafka.broker.net.in.bytes_per_sec | The incoming byte rate | float | gauge |
| kafka.broker.net.out.bytes_per_sec | The outgoing byte rate | float | gauge |
| kafka.broker.net.rejected.bytes_per_sec | The rejected byte rate | float | gauge |
| kafka.broker.replication.leader_elections | The leader election rate | float | gauge |
| kafka.broker.replication.unclean_leader_elections | The unclean leader election rate | float | gauge |
| kafka.broker.request.channel.queue.size | The size of the request queue | long | gauge |
| kafka.broker.request.fetch.failed | The number of client fetch request failures | float | counter |
| kafka.broker.request.fetch.failed_per_second | The rate of client fetch request failures per second | float | gauge |
| kafka.broker.request.produce.failed | The number of failed produce requests | float | counter |
| kafka.broker.request.produce.failed_per_second | The rate of failed produce requests per second | float | gauge |
| kafka.broker.session.zookeeper.disconnect | The ZooKeeper closed sessions per second | float | gauge |
| kafka.broker.session.zookeeper.expire | The ZooKeeper expired sessions per second | float | gauge |
| kafka.broker.session.zookeeper.readonly | The ZooKeeper readonly sessions per second | float | gauge |
| kafka.broker.session.zookeeper.sync | The ZooKeeper client connections per second | float | gauge |
| kafka.broker.topic.messages_in | The incoming message rate per topic | float | gauge |
| kafka.broker.topic.net.in.bytes_per_sec | The incoming byte rate per topic | float | gauge |
| kafka.broker.topic.net.out.bytes_per_sec | The outgoing byte rate per topic | float | gauge |
| kafka.broker.topic.net.rejected.bytes_per_sec | The rejected byte rate per topic | float | gauge |
| kafka.partition.id | Partition id. | long | |
| kafka.partition.topic_broker_id | Unique id of the partition in the topic and the broker. | keyword | |
| kafka.partition.topic_id | Unique id of the partition in the topic. | keyword | |
| kafka.topic.error.code | Topic error code. | long | |
| kafka.topic.name | Topic name | keyword | |
| service.address | Address where data about this service was collected from. This should be a URI, network address (ipv4:port or [ipv6]:port) or a resource path (sockets). | keyword |
Example
{
    "@timestamp": "2020-05-15T15:18:13.919Z",
    "agent": {
        "ephemeral_id": "178ff0e9-e3dd-4bdf-8e3d-8f67a6bd72ef",
        "id": "5aba67f2-2050-4d19-8953-ba20f0a5483c",
        "name": "kafka-01",
        "type": "metricbeat",
        "version": "8.0.0"
    },
    "ecs": {
        "version": "8.11.0"
    },
    "event": {
        "dataset": "kafka.consumergroup",
        "duration": 8821045,
        "module": "kafka"
    },
    "kafka": {
        "broker": {
            "address": "kafka-01:9092",
            "id": 0
        },
        "consumergroup": {
            "client": {
                "host": "127.0.0.1",
                "id": "consumer-console-consumer-99447-1",
                "member_id": "consumer-console-consumer-99447-1-208fdf91-2f28-4336-a2ff-5e5f4b8b71e4"
            },
            "consumer_lag": 112,
            "error": {
                "code": 0
            },
            "id": "console-consumer-99447",
            "meta": "",
            "offset": -1
        },
        "partition": {
            "id": 0,
            "topic_id": "0-messages"
        },
        "topic": {
            "name": "messages"
        }
    },
    "metricset": {
        "name": "consumergroup",
        "period": 10000
    },
    "service": {
        "address": "localhost:9092",
        "type": "kafka"
    }
}
ECS Field Reference
Please refer to the following document for detailed information on ECS fields.
Exported fields
| Field | Description | Type | Metric Type |
|---|---|---|---|
| @timestamp | Event timestamp. | date | |
| agent.id | keyword | ||
| cloud.account.id | The cloud account or organization id used to identify different entities in a multi-tenant environment. Examples: AWS account id, Google Cloud ORG Id, or other unique identifier. | keyword | |
| cloud.availability_zone | Availability zone in which this host is running. | keyword | |
| cloud.image.id | Image ID for the cloud instance. | keyword | |
| cloud.instance.id | Instance ID of the host machine. | keyword | |
| cloud.provider | Name of the cloud provider. Example values are aws, azure, gcp, or digitalocean. | keyword | |
| cloud.region | Region in which this host is running. | keyword | |
| container.id | Unique container id. | keyword | |
| data_stream.dataset | Data stream dataset. | constant_keyword | |
| data_stream.namespace | Data stream namespace. | constant_keyword | |
| data_stream.type | Data stream type. | constant_keyword | |
| event.dataset | Event dataset | constant_keyword | |
| event.module | Event module | constant_keyword | |
| host.containerized | If the host is a container. | boolean | |
| host.name | Name of the host. It can contain what hostname returns on Unix systems, the fully qualified domain name, or a name specified by the user. The sender decides which value to use. |
keyword | |
| host.os.build | OS build information. | keyword | |
| host.os.codename | OS codename, if any. | keyword | |
| kafka.broker.address | Broker advertised address | keyword | |
| kafka.broker.id | Broker id | long | |
| kafka.consumergroup.client.host | Client host | keyword | |
| kafka.consumergroup.client.id | Client ID (kafka setting client.id) | keyword | |
| kafka.consumergroup.client.member_id | internal consumer group member ID | keyword | |
| kafka.consumergroup.consumer_lag | consumer lag for partition/topic calculated as the difference between the partition offset and consumer offset | long | gauge |
| kafka.consumergroup.error.code | kafka consumer/partition error code. | long | |
| kafka.consumergroup.id | Consumer Group ID | keyword | |
| kafka.consumergroup.meta | custom consumer meta data string | keyword | |
| kafka.consumergroup.offset | consumer offset into partition being read | long | gauge |
| kafka.partition.id | Partition id. | long | |
| kafka.partition.topic_broker_id | Unique id of the partition in the topic and the broker. | keyword | |
| kafka.partition.topic_id | Unique id of the partition in the topic. | keyword | |
| kafka.topic.error.code | Topic error code. | long | |
| kafka.topic.name | Topic name | keyword | |
| service.address | Address where data about this service was collected from. This should be a URI, network address (ipv4:port or [ipv6]:port) or a resource path (sockets). | keyword |
Example
{
    "@timestamp": "2020-05-15T15:19:44.240Z",
    "agent": {
        "ephemeral_id": "178ff0e9-e3dd-4bdf-8e3d-8f67a6bd72ef",
        "id": "5aba67f2-2050-4d19-8953-ba20f0a5483c",
        "name": "kafka-01",
        "type": "metricbeat",
        "version": "8.0.0"
    },
    "ecs": {
        "version": "8.11.0"
    },
    "event": {
        "dataset": "kafka.partition",
        "duration": 11263377,
        "module": "kafka"
    },
    "kafka": {
        "broker": {
            "address": "kafka-01:9092",
            "id": 0
        },
        "partition": {
            "id": 0,
            "offset": {
                "newest": 111,
                "oldest": 0
            },
            "partition": {
                "insync_replica": true,
                "is_leader": true,
                "leader": 0,
                "replica": 0
            },
            "topic_broker_id": "0-messages-0",
            "topic_id": "0-messages"
        },
        "topic": {
            "name": "messages"
        }
    },
    "metricset": {
        "name": "partition",
        "period": 10000
    },
    "service": {
        "address": "localhost:9092",
        "type": "kafka"
    }
}
ECS Field Reference
Please refer to the following document for detailed information on ECS fields.
Exported fields
| Field | Description | Type | Metric Type |
|---|---|---|---|
| @timestamp | Event timestamp. | date | |
| agent.id | keyword | ||
| cloud.account.id | The cloud account or organization id used to identify different entities in a multi-tenant environment. Examples: AWS account id, Google Cloud ORG Id, or other unique identifier. | keyword | |
| cloud.availability_zone | Availability zone in which this host is running. | keyword | |
| cloud.image.id | Image ID for the cloud instance. | keyword | |
| cloud.instance.id | Instance ID of the host machine. | keyword | |
| cloud.provider | Name of the cloud provider. Example values are aws, azure, gcp, or digitalocean. | keyword | |
| cloud.region | Region in which this host is running. | keyword | |
| container.id | Unique container id. | keyword | |
| data_stream.dataset | Data stream dataset. | constant_keyword | |
| data_stream.namespace | Data stream namespace. | constant_keyword | |
| data_stream.type | Data stream type. | constant_keyword | |
| event.dataset | Event dataset | constant_keyword | |
| event.module | Event module | constant_keyword | |
| host.containerized | If the host is a container. | boolean | |
| host.name | Name of the host. It can contain what hostname returns on Unix systems, the fully qualified domain name, or a name specified by the user. The sender decides which value to use. |
keyword | |
| host.os.build | OS build information. | keyword | |
| host.os.codename | OS codename, if any. | keyword | |
| kafka.broker.address | Broker advertised address | keyword | |
| kafka.broker.id | Broker id | long | |
| kafka.partition.id | Partition id. | long | |
| kafka.partition.offset.newest | Newest offset of the partition. | long | gauge |
| kafka.partition.offset.oldest | Oldest offset of the partition. | long | gauge |
| kafka.partition.partition.error.code | Error code from fetching partition. | long | |
| kafka.partition.partition.insync_replica | Indicates if replica is included in the in-sync replicate set (ISR). | boolean | |
| kafka.partition.partition.is_leader | Indicates if replica is the leader | boolean | |
| kafka.partition.partition.leader | Leader id (broker). | long | |
| kafka.partition.partition.replica | Replica id (broker). | long | |
| kafka.partition.topic_broker_id | Unique id of the partition in the topic and the broker. | keyword | |
| kafka.partition.topic_id | Unique id of the partition in the topic. | keyword | |
| kafka.topic.error.code | Topic error code. | long | |
| kafka.topic.name | Topic name | keyword | |
| service.address | Address where data about this service was collected from. This should be a URI, network address (ipv4:port or [ipv6]:port) or a resource path (sockets). | keyword |
Note that this dataset would be only available if Kafka is run in KRaft mode.
The raft dataset collects metrics related to Kafka's Raft consensus algorithm implementation (KRaft), which is used for metadata management in Kafka without requiring ZooKeeper. KRaft mode is available in Kafka 3.0.0 and later versions.
This dataset includes metrics such as:
- Append and fetch records rates
- Commit latency (average and maximum)
- Current epoch, leader, and vote information
- High watermark and log offset metrics
- Node state and voter information
- Poll idle ratio
Example
{
    "@timestamp": "2025-07-21T08:52:02.169Z",
    "agent": {
        "ephemeral_id": "9b3488ec-43b2-4927-992d-66e7916db610",
        "id": "98300b09-b816-4ff7-87aa-a3dd3410656c",
        "name": "elastic-agent-92636",
        "type": "metricbeat",
        "version": "8.16.6"
    },
    "cloud": {
        "account": {
            "id": "elastic-obs-integrations-dev"
        },
        "availability_zone": "asia-south1-c",
        "instance": {
            "id": "5798221542184199336",
            "name": "service-integration-dev-idc-ubuntu25-4"
        },
        "machine": {
            "type": "n1-standard-4"
        },
        "project": {
            "id": "elastic-obs-integrations-dev"
        },
        "provider": "gcp",
        "region": "asia-south1",
        "service": {
            "name": "GCE"
        }
    },
    "data_stream": {
        "dataset": "kafka.raft",
        "namespace": "60294",
        "type": "metrics"
    },
    "ecs": {
        "version": "8.0.0"
    },
    "elastic_agent": {
        "id": "98300b09-b816-4ff7-87aa-a3dd3410656c",
        "snapshot": false,
        "version": "8.16.6"
    },
    "event": {
        "agent_id_status": "verified",
        "dataset": "kafka.raft",
        "duration": 29347144,
        "ingested": "2025-07-21T08:52:04Z",
        "module": "jolokia"
    },
    "host": {
        "architecture": "x86_64",
        "containerized": false,
        "hostname": "elastic-agent-92636",
        "ip": [
            "172.21.0.2",
            "172.19.0.6"
        ],
        "mac": [
            "0A-4F-66-38-0A-41",
            "A2-41-CC-86-C2-F0"
        ],
        "name": "elastic-agent-92636",
        "os": {
            "family": "",
            "kernel": "6.14.0-1006-gcp",
            "name": "Wolfi",
            "platform": "wolfi",
            "type": "linux",
            "version": "20230201"
        }
    },
    "kafka": {
        "raft": {
            "append_records_rate": 0.672182006204757,
            "commit_latency_avg": 0,
            "commit_latency_max": 0,
            "current_epoch": 1,
            "current_leader": 1,
            "current_state": "leader",
            "current_vote": 1,
            "fetch_records_rate": 0,
            "high_watermark": 26,
            "log_end_epoch": 1,
            "log_end_offset": 26,
            "number_of_voters": 1,
            "number_unknown_voter_connections": 0,
            "poll_idle_ratio_avg": 0.9814143775569842
        }
    },
    "metricset": {
        "name": "jmx",
        "period": 10000
    },
    "service": {
        "address": "http://kafka:8779/jolokia",
        "type": "jolokia"
    }
}
ECS Field Reference
Please refer to the following document for detailed information on ECS fields.
Exported fields
| Field | Description | Type | Unit | Metric Type |
|---|---|---|---|---|
| @timestamp | Event timestamp. | date | ||
| agent.id | keyword | |||
| cloud.account.id | The cloud account or organization id used to identify different entities in a multi-tenant environment. Examples: AWS account id, Google Cloud ORG Id, or other unique identifier. | keyword | ||
| cloud.availability_zone | Availability zone in which this host is running. | keyword | ||
| cloud.image.id | Image ID for the cloud instance. | keyword | ||
| cloud.instance.id | Instance ID of the host machine. | keyword | ||
| cloud.provider | Name of the cloud provider. Example values are aws, azure, gcp, or digitalocean. | keyword | ||
| cloud.region | Region in which this host is running. | keyword | ||
| container.id | Unique container id. | keyword | ||
| data_stream.dataset | Data stream dataset. | constant_keyword | ||
| data_stream.namespace | Data stream namespace. | constant_keyword | ||
| data_stream.type | Data stream type. | constant_keyword | ||
| event.module | Event module | constant_keyword | ||
| host.containerized | If the host is a container. | boolean | ||
| host.name | Name of the host. It can contain what hostname returns on Unix systems, the fully qualified domain name, or a name specified by the user. The sender decides which value to use. |
keyword | ||
| host.os.build | OS build information. | keyword | ||
| host.os.codename | OS codename, if any. | keyword | ||
| kafka.raft.append_records_rate | The average number of records appended per sec as the leader of the raft quorum. | double | gauge | |
| kafka.raft.commit_latency_avg | The average time in milliseconds to commit an entry in the raft log. | double | ms | gauge |
| kafka.raft.commit_latency_max | The maximum time in milliseconds to commit an entry in the raft log. | double | ms | gauge |
| kafka.raft.current_epoch | The current quorum epoch. | long | gauge | |
| kafka.raft.current_leader | The current quorum leader's id; -1 indicates unknown. | long | gauge | |
| kafka.raft.current_state | The current state of this member; possible values are leader, candidate, voted, follower, unattached, observer. | keyword | ||
| kafka.raft.current_vote | The current voted id. | long | gauge | |
| kafka.raft.fetch_records_rate | The average number of records fetched from the leader of the raft quorum. | double | gauge | |
| kafka.raft.high_watermark | The high watermark maintained on this member; -1 if it is unknown. | long | gauge | |
| kafka.raft.log_end_epoch | The current raft log end epoch. | long | gauge | |
| kafka.raft.log_end_offset | The current raft log end offset. | long | gauge | |
| kafka.raft.number_of_voters | Number of voters for a KRaft topic partition. | double | gauge | |
| kafka.raft.number_unknown_voter_connections | Number of unknown voters whose connection information is not cached; would never be larger than quorum-size. | double | gauge | |
| kafka.raft.poll_idle_ratio_avg | The ratio of time the Raft IO thread is idle as opposed to doing work (e.g. handling requests or replicating from the leader). | double | percent | gauge |
| service.address | Address where data about this service was collected from. This should be a URI, network address (ipv4:port or [ipv6]:port) or a resource path (sockets). | keyword |
The controller dataset collects metrics related to the Kafka controller, which is responsible for managing broker states, partition assignments, and other administrative operations in the Kafka cluster.
This dataset includes metrics such as:
- Controller event manager metrics (queue processing and wait times)
- Cluster state metrics (active brokers, controllers, topics, and partitions)
- Record management metrics (lag, offset, and timestamp information)
- Error and health metrics (offline partitions, heartbeat timeouts, metadata errors)
Example
{
    "@timestamp": "2025-07-23T16:36:57.042Z",
    "agent": {
        "ephemeral_id": "2150fbd5-548b-419a-918f-0ed2733563ef",
        "id": "58cfc441-e305-43c7-9434-c678ee32e1c2",
        "name": "elastic-agent-40599",
        "type": "metricbeat",
        "version": "8.16.6"
    },
    "cloud": {
        "account": {
            "id": "elastic-obs-integrations-dev"
        },
        "availability_zone": "asia-south1-c",
        "instance": {
            "id": "5798221542184199336",
            "name": "service-integration-dev-idc-ubuntu25-4"
        },
        "machine": {
            "type": "n1-standard-4"
        },
        "project": {
            "id": "elastic-obs-integrations-dev"
        },
        "provider": "gcp",
        "region": "asia-south1",
        "service": {
            "name": "GCE"
        }
    },
    "data_stream": {
        "dataset": "kafka.controller",
        "namespace": "47967",
        "type": "metrics"
    },
    "ecs": {
        "version": "8.11.0"
    },
    "elastic_agent": {
        "id": "58cfc441-e305-43c7-9434-c678ee32e1c2",
        "snapshot": false,
        "version": "8.16.6"
    },
    "event": {
        "agent_id_status": "verified",
        "dataset": "kafka.controller",
        "duration": 781389285,
        "ingested": "2025-07-23T16:36:59Z",
        "kind": "metric",
        "module": "jolokia",
        "type": [
            "info"
        ]
    },
    "host": {
        "architecture": "x86_64",
        "containerized": false,
        "hostname": "elastic-agent-40599",
        "ip": [
            "172.19.0.5",
            "172.21.0.2"
        ],
        "mac": [
            "32-73-79-CF-AF-F0",
            "DA-31-18-3F-D2-AB"
        ],
        "name": "elastic-agent-40599",
        "os": {
            "family": "",
            "kernel": "6.14.0-1006-gcp",
            "name": "Wolfi",
            "platform": "wolfi",
            "type": "linux",
            "version": "20230201"
        }
    },
    "kafka": {
        "controller": {
            "kafka_controller": {
                "active_broker_count": 1
            },
            "metric_fingerprint": "CwZch2JmNUxXEisR5ul56ftnq4U="
        }
    },
    "metricset": {
        "name": "jmx",
        "period": 10000
    },
    "service": {
        "address": "http://kafka:8779/jolokia",
        "type": "kafka"
    }
}
ECS Field Reference
Please refer to the following document for detailed information on ECS fields.
Exported fields
| Field | Description | Type | Unit | Metric Type |
|---|---|---|---|---|
| @timestamp | Event timestamp. | date | ||
| agent.id | keyword | |||
| cloud.account.id | The cloud account or organization id used to identify different entities in a multi-tenant environment. Examples: AWS account id, Google Cloud ORG Id, or other unique identifier. | keyword | ||
| cloud.availability_zone | Availability zone in which this host is running. | keyword | ||
| cloud.image.id | Image ID for the cloud instance. | keyword | ||
| cloud.instance.id | Instance ID of the host machine. | keyword | ||
| cloud.provider | Name of the cloud provider. Example values are aws, azure, gcp, or digitalocean. | keyword | ||
| cloud.region | Region in which this host is running. | keyword | ||
| container.id | Unique container id. | keyword | ||
| data_stream.dataset | Data stream dataset. | constant_keyword | ||
| data_stream.namespace | Data stream namespace. | constant_keyword | ||
| data_stream.type | Data stream type. | constant_keyword | ||
| event.module | Event module | constant_keyword | ||
| host.containerized | If the host is a container. | boolean | ||
| host.name | Name of the host. It can contain what hostname returns on Unix systems, the fully qualified domain name, or a name specified by the user. The sender decides which value to use. |
keyword | ||
| host.os.build | OS build information. | keyword | ||
| host.os.codename | OS codename, if any. | keyword | ||
| kafka.controller.controller_event_manager.event_queue_processing_time_ms.max | Maximum time in milliseconds to process events from the event queue. | double | ms | gauge |
| kafka.controller.controller_event_manager.event_queue_processing_time_ms.min | Minimum time in milliseconds to process events from the event queue. | double | ms | gauge |
| kafka.controller.controller_event_manager.event_queue_processing_time_ms.p95 | 95th percentile of time in milliseconds to process events from the event queue. | double | ms | gauge |
| kafka.controller.controller_event_manager.event_queue_processing_time_ms.p99 | 99th percentile of time in milliseconds to process events from the event queue. | double | ms | gauge |
| kafka.controller.controller_event_manager.event_queue_time_ms.max | Maximum time in milliseconds for an event to wait in the event queue. | double | ms | gauge |
| kafka.controller.controller_event_manager.event_queue_time_ms.min | Minimum time in milliseconds for an event to wait in the event queue. | double | ms | gauge |
| kafka.controller.controller_event_manager.event_queue_time_ms.p95 | 95th percentile of time in milliseconds for an event to wait in the event queue. | double | ms | gauge |
| kafka.controller.controller_event_manager.event_queue_time_ms.p99 | 99th percentile of time in milliseconds for an event to wait in the event queue. | double | ms | gauge |
| kafka.controller.kafka_controller.active_broker_count | Number of active brokers in the cluster. | long | gauge | |
| kafka.controller.kafka_controller.active_controller_count | Number of active controllers in the cluster (should be 1). | long | gauge | |
| kafka.controller.kafka_controller.event_queue_operations_started_count | Number of event queue operations that have been started. | long | counter | |
| kafka.controller.kafka_controller.event_queue_operations_timed_out_count | Number of event queue operations that have timed out. | long | counter | |
| kafka.controller.kafka_controller.fenced_broker_count | Number of brokers that have been fenced. | long | gauge | |
| kafka.controller.kafka_controller.global_partition_count | Total number of partitions in the cluster. | long | gauge | |
| kafka.controller.kafka_controller.global_topic_count | Total number of topics in the cluster. | long | gauge | |
| kafka.controller.kafka_controller.last_applied_record_lag_ms | Lag in milliseconds between the last record that was applied and the current time. | long | ms | gauge |
| kafka.controller.kafka_controller.last_applied_record_offset | Offset of the last record that was applied. | long | gauge | |
| kafka.controller.kafka_controller.last_applied_record_timestamp | Timestamp of the last record that was applied in ISO8601 format. | date | ||
| kafka.controller.kafka_controller.last_committed_record_offset | Offset of the last committed record. | long | gauge | |
| kafka.controller.kafka_controller.metadata_error_count | Number of metadata errors that have occurred. | long | counter | |
| kafka.controller.kafka_controller.new_active_controllers_count | Number of new active controllers that have been elected. | long | counter | |
| kafka.controller.kafka_controller.offline_partitions_count | Number of partitions that are offline. | long | gauge | |
| kafka.controller.kafka_controller.preferred_replica_imbalance_count | Number of partitions that have a preferred replica imbalance. | long | gauge | |
| kafka.controller.kafka_controller.timed_out_broker_heartbeat_count | Number of broker heartbeats that have timed out. | long | counter | |
| kafka.controller.metric_fingerprint | A fingerprint of the metric path. | keyword | ||
| service.address | Address where data about this service was collected from. This should be a URI, network address (ipv4:port or [ipv6]:port) or a resource path (sockets). | keyword |
The replica_manager dataset collects metrics related to Kafka's replica management system, which is responsible for handling data replication across brokers in the Kafka cluster.
This dataset includes metrics such as:
- ReplicaAlterLogDirsManager metrics (dead threads, failed partitions, lag, and fetch rates)
- ReplicaFetcherManager metrics (dead threads, failed partitions, lag, and fetch rates)
- In-Sync Replica (ISR) metrics (expansions, shrinks, and update failures)
- Partition metrics (leader count, offline replicas, under-replicated partitions)
- Reassignment and replication health metrics (reassigning partitions, under min ISR partition count)
Example
{
    "@timestamp": "2025-07-23T16:35:37.935Z",
    "agent": {
        "ephemeral_id": "a4700138-4aca-47fb-a345-5bbfba6ceed0",
        "id": "167e67fc-65ea-457a-97a7-72bf3cbf5b3f",
        "name": "elastic-agent-77103",
        "type": "metricbeat",
        "version": "8.16.6"
    },
    "cloud": {
        "account": {
            "id": "elastic-obs-integrations-dev"
        },
        "availability_zone": "asia-south1-c",
        "instance": {
            "id": "5798221542184199336",
            "name": "service-integration-dev-idc-ubuntu25-4"
        },
        "machine": {
            "type": "n1-standard-4"
        },
        "project": {
            "id": "elastic-obs-integrations-dev"
        },
        "provider": "gcp",
        "region": "asia-south1",
        "service": {
            "name": "GCE"
        }
    },
    "data_stream": {
        "dataset": "kafka.replica_manager",
        "namespace": "28369",
        "type": "metrics"
    },
    "ecs": {
        "version": "8.0.0"
    },
    "elastic_agent": {
        "id": "167e67fc-65ea-457a-97a7-72bf3cbf5b3f",
        "snapshot": false,
        "version": "8.16.6"
    },
    "event": {
        "agent_id_status": "verified",
        "dataset": "kafka.replica_manager",
        "duration": 5881449397,
        "ingested": "2025-07-23T16:35:44Z",
        "kind": "metric",
        "module": "jolokia",
        "type": [
            "info"
        ]
    },
    "host": {
        "architecture": "x86_64",
        "containerized": false,
        "hostname": "elastic-agent-77103",
        "ip": [
            "172.19.0.5",
            "172.21.0.2"
        ],
        "mac": [
            "66-AA-DE-78-FA-8A",
            "F6-D6-75-D4-7D-B8"
        ],
        "name": "elastic-agent-77103",
        "os": {
            "family": "",
            "kernel": "6.14.0-1006-gcp",
            "name": "Wolfi",
            "platform": "wolfi",
            "type": "linux",
            "version": "20230201"
        }
    },
    "kafka": {
        "replica_manager": {
            "leader_count": 0,
            "metric_fingerprint": "k3ezWtwJ3kr3vsPXwZ6YGa8stZk="
        }
    },
    "metricset": {
        "name": "jmx",
        "period": 10000
    },
    "service": {
        "address": "http://kafka:8779/jolokia",
        "type": "kafka"
    }
}
ECS Field Reference
Please refer to the following document for detailed information on ECS fields.
Exported fields
| Field | Description | Type | Metric Type |
|---|---|---|---|
| @timestamp | Event timestamp. | date | |
| agent.id | keyword | ||
| cloud.account.id | The cloud account or organization id used to identify different entities in a multi-tenant environment. Examples: AWS account id, Google Cloud ORG Id, or other unique identifier. | keyword | |
| cloud.availability_zone | Availability zone in which this host is running. | keyword | |
| cloud.image.id | Image ID for the cloud instance. | keyword | |
| cloud.instance.id | Instance ID of the host machine. | keyword | |
| cloud.provider | Name of the cloud provider. Example values are aws, azure, gcp, or digitalocean. | keyword | |
| cloud.region | Region in which this host is running. | keyword | |
| container.id | Unique container id. | keyword | |
| data_stream.dataset | Data stream dataset. | constant_keyword | |
| data_stream.namespace | Data stream namespace. | constant_keyword | |
| data_stream.type | Data stream type. | constant_keyword | |
| event.module | Event module | constant_keyword | |
| host.containerized | If the host is a container. | boolean | |
| host.name | Name of the host. It can contain what hostname returns on Unix systems, the fully qualified domain name, or a name specified by the user. The sender decides which value to use. |
keyword | |
| host.os.build | OS build information. | keyword | |
| host.os.codename | OS codename, if any. | keyword | |
| kafka.replica_manager.at_min_isr_partition_count | Number of partitions that are at minimum in-sync replica count. | double | gauge |
| kafka.replica_manager.failed_isr_updates_per_sec.one_minute_rate | One-minute rate of failed ISR update operations. | float | gauge |
| kafka.replica_manager.isr_expands_per_sec.one_minute_rate | One-minute rate of ISR expansion operations. | float | gauge |
| kafka.replica_manager.isr_shrinks_per_sec.one_minute_rate | One-minute rate of ISR shrink operations. | float | gauge |
| kafka.replica_manager.leader_count | Number of partitions that the broker leads. | double | gauge |
| kafka.replica_manager.metric_fingerprint | A fingerprint of the metric path. | keyword | |
| kafka.replica_manager.offline_replica_count | Number of offline replicas. | double | gauge |
| kafka.replica_manager.partition_count | Total number of partitions. | double | gauge |
| kafka.replica_manager.partitions_with_late_transactions_count | Number of partitions with late transactions. | double | gauge |
| kafka.replica_manager.producer_id_count | Number of producer IDs. | double | gauge |
| kafka.replica_manager.reassigning_partitions | Number of partitions that are currently being reassigned. | double | gauge |
| kafka.replica_manager.replica_alter_log_dirs_manager.dead_thread_count | Number of dead threads in the ReplicaAlterLogDirsManager. | double | gauge |
| kafka.replica_manager.replica_alter_log_dirs_manager.failed_partitions_count | Number of failed partitions in the ReplicaAlterLogDirsManager. | double | gauge |
| kafka.replica_manager.replica_alter_log_dirs_manager.max_lag | Maximum lag for the ReplicaAlterLogDirsManager. | double | gauge |
| kafka.replica_manager.replica_alter_log_dirs_manager.min_fetch_rate | Minimum fetch rate for the ReplicaAlterLogDirsManager. | double | gauge |
| kafka.replica_manager.replica_fetcher_manager.dead_thread_count | Number of dead threads in the ReplicaFetcherManager. | double | gauge |
| kafka.replica_manager.replica_fetcher_manager.failed_partitions_count | Number of failed partitions in the ReplicaFetcherManager. | double | gauge |
| kafka.replica_manager.replica_fetcher_manager.max_lag | Maximum lag for the ReplicaFetcherManager. | double | gauge |
| kafka.replica_manager.replica_fetcher_manager.min_fetch_rate | Minimum fetch rate for the ReplicaFetcherManager. | float | gauge |
| kafka.replica_manager.under_min_isr_partition_count | Number of partitions that are under minimum in-sync replica count. | double | gauge |
| kafka.replica_manager.under_replicated_partitions | Number of under-replicated partitions. | double | gauge |
| service.address | Address where data about this service was collected from. This should be a URI, network address (ipv4:port or [ipv6]:port) or a resource path (sockets). | keyword |
The jvm dataset collects metrics related to the Java Virtual Machine (JVM) running the Kafka broker, providing insights into the performance and health of the Java runtime environment.
This dataset includes metrics such as:
- Runtime metrics (uptime, VM name, version, and vendor)
- Memory metrics (heap and non-heap usage, memory pool statistics)
- Threading metrics (thread counts, deadlocks, thread states)
- Garbage collection metrics (collection counts and times)
- Class loading metrics (loaded and unloaded class counts)
- Buffer pool metrics (memory usage and capacity)
- JIT compilation metrics (time spent in compilation)
Example
{
    "@timestamp": "2025-07-25T10:09:38.042Z",
    "agent": {
        "ephemeral_id": "e1b23dfa-d56c-46a8-ae0c-f8f9a7f0b5c1",
        "id": "40e21615-8eb5-4961-be45-680e5818eb6b",
        "name": "elastic-agent-14285",
        "type": "metricbeat",
        "version": "8.16.6"
    },
    "cloud": {
        "account": {
            "id": "elastic-obs-integrations-dev"
        },
        "availability_zone": "asia-south1-c",
        "instance": {
            "id": "5798221542184199336",
            "name": "service-integration-dev-idc-ubuntu25-4"
        },
        "machine": {
            "type": "n1-standard-4"
        },
        "project": {
            "id": "elastic-obs-integrations-dev"
        },
        "provider": "gcp",
        "region": "asia-south1",
        "service": {
            "name": "GCE"
        }
    },
    "data_stream": {
        "dataset": "kafka.jvm",
        "namespace": "47502",
        "type": "metrics"
    },
    "ecs": {
        "version": "8.11.0"
    },
    "elastic_agent": {
        "id": "40e21615-8eb5-4961-be45-680e5818eb6b",
        "snapshot": false,
        "version": "8.16.6"
    },
    "event": {
        "agent_id_status": "verified",
        "dataset": "kafka.jvm",
        "duration": 354911266,
        "ingested": "2025-07-25T10:09:40Z",
        "kind": "metric",
        "module": "jolokia",
        "type": [
            "info"
        ]
    },
    "host": {
        "architecture": "x86_64",
        "containerized": false,
        "hostname": "elastic-agent-14285",
        "ip": [
            "172.19.0.5",
            "172.21.0.2"
        ],
        "mac": [
            "66-19-E4-54-59-12",
            "A2-11-DF-AB-E4-41"
        ],
        "name": "elastic-agent-14285",
        "os": {
            "family": "",
            "kernel": "6.14.0-1006-gcp",
            "name": "Wolfi",
            "platform": "wolfi",
            "type": "linux",
            "version": "20230201"
        }
    },
    "kafka": {
        "jvm": {
            "memory": {
                "heap_usage": {
                    "committed": 1073741824,
                    "init": 1073741824,
                    "max": 1073741824,
                    "used": 190366448
                },
                "non_heap_usage": {
                    "committed": 21757952,
                    "init": 7667712,
                    "max": -1,
                    "used": 19345080
                },
                "objects_pending_finalization": 0
            },
            "metric_fingerprint": "2P1kc1Htw9PJIE/32HilOsukNgw="
        }
    },
    "metricset": {
        "name": "jmx",
        "period": 10000
    },
    "service": {
        "address": "http://kafka:8779/jolokia",
        "type": "kafka"
    }
}
ECS Field Reference
Please refer to the following document for detailed information on ECS fields.
Exported fields
| Field | Description | Type | Unit | Metric Type |
|---|---|---|---|---|
| @timestamp | Event timestamp. | date | ||
| agent.id | keyword | |||
| cloud.account.id | The cloud account or organization id used to identify different entities in a multi-tenant environment. Examples: AWS account id, Google Cloud ORG Id, or other unique identifier. | keyword | ||
| cloud.availability_zone | Availability zone in which this host is running. | keyword | ||
| cloud.image.id | Image ID for the cloud instance. | keyword | ||
| cloud.instance.id | Instance ID of the host machine. | keyword | ||
| cloud.provider | Name of the cloud provider. Example values are aws, azure, gcp, or digitalocean. | keyword | ||
| cloud.region | Region in which this host is running. | keyword | ||
| container.id | Unique container id. | keyword | ||
| data_stream.dataset | Data stream dataset. | constant_keyword | ||
| data_stream.namespace | Data stream namespace. | constant_keyword | ||
| data_stream.type | Data stream type. | constant_keyword | ||
| event.module | Event module | constant_keyword | ||
| host.containerized | If the host is a container. | boolean | ||
| host.name | Name of the host. It can contain what hostname returns on Unix systems, the fully qualified domain name, or a name specified by the user. The sender decides which value to use. |
keyword | ||
| host.os.build | OS build information. | keyword | ||
| host.os.codename | OS codename, if any. | keyword | ||
| kafka.jvm.buffer_pool.count | Number of buffers in the pool. | long | gauge | |
| kafka.jvm.buffer_pool.name | Name of the buffer pool. | keyword | ||
| kafka.jvm.buffer_pool.total_capacity | Total capacity of the buffer pool in bytes. | double | byte | gauge |
| kafka.jvm.buffer_pool.used | Used memory in the buffer pool in bytes. | double | byte | gauge |
| kafka.jvm.classes.loaded_count | The number of classes currently loaded. | long | gauge | |
| kafka.jvm.classes.total_loaded_count | The total number of classes that have been loaded since JVM start. | long | counter | |
| kafka.jvm.classes.unloaded_count | The total number of classes that have been unloaded since JVM start. | long | counter | |
| kafka.jvm.compilation.name | Name of the JIT compiler. | keyword | ||
| kafka.jvm.compilation.time_ms | The accumulated time spent in compilation in milliseconds. | double | ms | counter |
| kafka.jvm.gc.collection_count | The total number of collections that have occurred. | long | counter | |
| kafka.jvm.gc.collection_time_ms | The accumulated collection time in milliseconds. | double | ms | counter |
| kafka.jvm.gc.name | Garbage collector name. | keyword | ||
| kafka.jvm.memory.heap_usage.committed | Committed heap memory in bytes. | double | byte | gauge |
| kafka.jvm.memory.heap_usage.init | Initial heap memory in bytes. | double | byte | gauge |
| kafka.jvm.memory.heap_usage.max | Max heap memory in bytes. | double | byte | gauge |
| kafka.jvm.memory.heap_usage.used | Used heap memory in bytes. | double | byte | gauge |
| kafka.jvm.memory.non_heap_usage.committed | Committed non-heap memory in bytes. | double | byte | gauge |
| kafka.jvm.memory.non_heap_usage.init | Initial non-heap memory in bytes. | double | byte | gauge |
| kafka.jvm.memory.non_heap_usage.max | Max non-heap memory in bytes. | double | byte | gauge |
| kafka.jvm.memory.non_heap_usage.used | Used non-heap memory in bytes. | double | byte | gauge |
| kafka.jvm.memory.objects_pending_finalization | The approximate number of objects for which finalization is pending. | long | gauge | |
| kafka.jvm.memory_pool.collection_usage.committed | Committed memory after last GC in bytes. | double | byte | gauge |
| kafka.jvm.memory_pool.collection_usage.init | Initial memory after last GC in bytes. | double | byte | gauge |
| kafka.jvm.memory_pool.collection_usage.max | Max memory after last GC in bytes. | double | byte | gauge |
| kafka.jvm.memory_pool.collection_usage.used | Used memory after last GC in bytes. | double | byte | gauge |
| kafka.jvm.memory_pool.mbean | The JMX MBean name. | keyword | ||
| kafka.jvm.memory_pool.name | Name of the memory pool. | keyword | ||
| kafka.jvm.memory_pool.peak_usage.committed | Committed memory for peak usage in bytes. | double | byte | gauge |
| kafka.jvm.memory_pool.peak_usage.init | Initial memory for peak usage in bytes. | double | byte | gauge |
| kafka.jvm.memory_pool.peak_usage.max | Max memory for peak usage in bytes. | double | byte | gauge |
| kafka.jvm.memory_pool.peak_usage.used | Used memory for peak usage in bytes. | double | byte | gauge |
| kafka.jvm.memory_pool.type | Type of the memory pool. | keyword | ||
| kafka.jvm.memory_pool.usage.committed | Committed memory in the pool in bytes. | double | byte | gauge |
| kafka.jvm.memory_pool.usage.init | Initial memory in the pool in bytes. | double | byte | gauge |
| kafka.jvm.memory_pool.usage.max | Max memory in the pool in bytes. | double | byte | gauge |
| kafka.jvm.memory_pool.usage.used | Used memory in the pool in bytes. | double | byte | gauge |
| kafka.jvm.metric_fingerprint | Fingerprint of the metrics. | keyword | ||
| kafka.jvm.runtime.name | Name representing the running JVM. | keyword | ||
| kafka.jvm.runtime.uptime | Uptime of the JVM in milliseconds. | double | ms | gauge |
| kafka.jvm.runtime.vm_name | The JVM implementation name. | keyword | ||
| kafka.jvm.runtime.vm_vendor | The JVM implementation vendor. | keyword | ||
| kafka.jvm.runtime.vm_version | The JVM version. | keyword | ||
| kafka.jvm.threads.current_count | The current number of live threads. | long | gauge | |
| kafka.jvm.threads.daemon_count | The current number of daemon threads. | long | gauge | |
| kafka.jvm.threads.peak_count | The peak live thread count. | long | gauge | |
| kafka.jvm.threads.total_started_count | The total number of threads started since JVM start. | long | counter | |
| service.address | Address where data about this service was collected from. This should be a URI, network address (ipv4:port or [ipv6]:port) or a resource path (sockets). | keyword |
The log_manager dataset collects metrics related to Kafka's log management system, which is responsible for handling log segments, cleaning, and maintenance operations.
This dataset includes metrics such as:
- Log cleaner metrics (buffer utilization, cleaning times, recopy percentages)
- Cleaner manager metrics (dirty log percentages, uncleanable partitions)
- Log directory metrics (offline directories, directory status)
- Log flush statistics (flush rates and times)
- Log recovery metrics (remaining logs and segments to recover)
Example
{
    "@timestamp": "2025-08-05T18:21:57.817Z",
    "agent": {
        "ephemeral_id": "025da050-f436-4f32-be0c-690f6de98ac7",
        "id": "dadfe305-ce93-4690-8744-83c027f11b73",
        "name": "elastic-agent-85306",
        "type": "metricbeat",
        "version": "8.16.6"
    },
    "cloud": {
        "account": {
            "id": "elastic-obs-integrations-dev"
        },
        "availability_zone": "asia-south1-c",
        "instance": {
            "id": "5798221542184199336",
            "name": "service-integration-dev-idc-ubuntu25-4"
        },
        "machine": {
            "type": "n1-standard-4"
        },
        "project": {
            "id": "elastic-obs-integrations-dev"
        },
        "provider": "gcp",
        "region": "asia-south1",
        "service": {
            "name": "GCE"
        }
    },
    "data_stream": {
        "dataset": "kafka.log_manager",
        "namespace": "28887",
        "type": "metrics"
    },
    "ecs": {
        "version": "8.11.0"
    },
    "elastic_agent": {
        "id": "dadfe305-ce93-4690-8744-83c027f11b73",
        "snapshot": false,
        "version": "8.16.6"
    },
    "event": {
        "agent_id_status": "verified",
        "dataset": "kafka.log_manager",
        "duration": 1855601401,
        "ingested": "2025-08-05T18:22:00Z",
        "kind": "metric",
        "module": "jolokia",
        "type": [
            "info"
        ]
    },
    "host": {
        "architecture": "x86_64",
        "containerized": false,
        "hostname": "elastic-agent-85306",
        "ip": [
            "172.19.0.5",
            "172.21.0.2"
        ],
        "mac": [
            "46-3C-53-42-21-24",
            "BE-AF-15-3B-E2-75"
        ],
        "name": "elastic-agent-85306",
        "os": {
            "family": "",
            "kernel": "6.14.0-1006-gcp",
            "name": "Wolfi",
            "platform": "wolfi",
            "type": "linux",
            "version": "20230201"
        }
    },
    "kafka": {
        "log_manager": {
            "cleaner": {
                "max_compaction_delay_secs": 0
            },
            "metric_fingerprint": "MZNDWjjx5vCiveTiyrQrq6r+Rr8="
        }
    },
    "metricset": {
        "name": "jmx",
        "period": 10000
    },
    "service": {
        "address": "http://kafka:8779/jolokia",
        "type": "kafka"
    }
}
ECS Field Reference
Please refer to the following document for detailed information on ECS fields.
Exported fields
| Field | Description | Type | Unit | Metric Type |
|---|---|---|---|---|
| @timestamp | Event timestamp. | date | ||
| agent.id | keyword | |||
| cloud.account.id | The cloud account or organization id used to identify different entities in a multi-tenant environment. Examples: AWS account id, Google Cloud ORG Id, or other unique identifier. | keyword | ||
| cloud.availability_zone | Availability zone in which this host is running. | keyword | ||
| cloud.image.id | Image ID for the cloud instance. | keyword | ||
| cloud.instance.id | Instance ID of the host machine. | keyword | ||
| cloud.provider | Name of the cloud provider. Example values are aws, azure, gcp, or digitalocean. | keyword | ||
| cloud.region | Region in which this host is running. | keyword | ||
| container.id | Unique container id. | keyword | ||
| data_stream.dataset | Data stream dataset. | constant_keyword | ||
| data_stream.namespace | Data stream namespace. | constant_keyword | ||
| data_stream.type | Data stream type. | constant_keyword | ||
| event.module | Event module | constant_keyword | ||
| host.containerized | If the host is a container. | boolean | ||
| host.name | Name of the host. It can contain what hostname returns on Unix systems, the fully qualified domain name, or a name specified by the user. The sender decides which value to use. |
keyword | ||
| host.os.build | OS build information. | keyword | ||
| host.os.codename | OS codename, if any. | keyword | ||
| kafka.log_manager.cleaner.dead_thread_count | The number of dead log cleaner threads. | double | gauge | |
| kafka.log_manager.cleaner.max_buffer_utilization_percent | The maximum percentage of the log cleaner's buffer that has been utilized. | double | gauge | |
| kafka.log_manager.cleaner.max_clean_time_secs | The maximum time taken to clean a log in seconds. | double | gauge | |
| kafka.log_manager.cleaner.max_compaction_delay_secs | The maximum delay in seconds for compactions. | double | gauge | |
| kafka.log_manager.cleaner.recopy_percent | The percentage of bytes recopyied during log cleaning. | double | percent | gauge |
| kafka.log_manager.cleaner_manager.max_dirty_percent | The maximum percentage of dirty logs that can be accumulated before log cleaning is triggered. | double | gauge | |
| kafka.log_manager.cleaner_manager.time_since_last_run_ms | The time in milliseconds since the last log cleaner run. | double | gauge | |
| kafka.log_manager.cleaner_manager.uncleanable_bytes.log_directory | The log directory path. | keyword | ||
| kafka.log_manager.cleaner_manager.uncleanable_bytes.value | The number of bytes that cannot be cleaned. | double | gauge | |
| kafka.log_manager.cleaner_manager.uncleanable_partitions_count.log_directory | The log directory path. | keyword | ||
| kafka.log_manager.cleaner_manager.uncleanable_partitions_count.value | The number of partitions that cannot be cleaned. | double | gauge | |
| kafka.log_manager.directory_offline | Indicates if the log directory is offline. | integer | gauge | |
| kafka.log_manager.directory_offline_count.log_directory | The log directory path. | keyword | ||
| kafka.log_manager.directory_offline_count.value | The number of offline log directories. | long | gauge | |
| kafka.log_manager.flush_stats.rate_and_time_ms.count | Total number of log flushes. | double | counter | |
| kafka.log_manager.flush_stats.rate_and_time_ms.fifteen_minute_rate | Fifteen-minute rate of log flushes. | double | gauge | |
| kafka.log_manager.flush_stats.rate_and_time_ms.five_minute_rate | Five-minute rate of log flushes. | double | gauge | |
| kafka.log_manager.flush_stats.rate_and_time_ms.max | Maximum log flush time in milliseconds. | double | gauge | |
| kafka.log_manager.flush_stats.rate_and_time_ms.mean | Mean log flush time in milliseconds. | double | gauge | |
| kafka.log_manager.flush_stats.rate_and_time_ms.mean_rate | Mean rate of log flushes. | double | gauge | |
| kafka.log_manager.flush_stats.rate_and_time_ms.min | Minimum log flush time in milliseconds. | double | gauge | |
| kafka.log_manager.flush_stats.rate_and_time_ms.one_minute_rate | One-minute rate of log flushes. | double | gauge | |
| kafka.log_manager.metric_fingerprint | A fingerprint of the metric path. | keyword | ||
| kafka.log_manager.offline_directory_count | The number of offline log directories. | double | gauge | |
| kafka.log_manager.remaining_logs_to_recover | The number of logs that still need to be recovered. | double | gauge | |
| kafka.log_manager.remaining_segments_to_recover | The number of segments that still need to be recovered. | double | gauge | |
| service.address | Address where data about this service was collected from. This should be a URI, network address (ipv4:port or [ipv6]:port) or a resource path (sockets). | keyword |
The network dataset collects metrics related to Kafka's network subsystem, providing insights into the broker's network performance, request handling, and socket server operations.
This dataset includes metrics such as:
- Socket server metrics (memory pool usage, expired connections)
- Network processor metrics (idle percentages, queue sizes)
- Request metrics for different request types (processing times, queue times)
- Throttle time metrics (how long requests are throttled)
- Request and response size metrics
- Request channel metrics (queue sizes and processing performance)
Example
{
    "@timestamp": "2025-07-30T14:34:01.976Z",
    "agent": {
        "ephemeral_id": "121634c5-89ec-4c65-9050-4f4cacb5cd5f",
        "id": "73ccdce9-578e-414a-89b9-c4fb1e3bfb33",
        "name": "elastic-agent-94680",
        "type": "metricbeat",
        "version": "8.16.6"
    },
    "cloud": {
        "account": {
            "id": "elastic-obs-integrations-dev"
        },
        "availability_zone": "asia-south1-c",
        "instance": {
            "id": "5798221542184199336",
            "name": "service-integration-dev-idc-ubuntu25-4"
        },
        "machine": {
            "type": "n1-standard-4"
        },
        "project": {
            "id": "elastic-obs-integrations-dev"
        },
        "provider": "gcp",
        "region": "asia-south1",
        "service": {
            "name": "GCE"
        }
    },
    "data_stream": {
        "dataset": "kafka.network",
        "namespace": "99080",
        "type": "metrics"
    },
    "ecs": {
        "version": "8.11.0"
    },
    "elastic_agent": {
        "id": "73ccdce9-578e-414a-89b9-c4fb1e3bfb33",
        "snapshot": false,
        "version": "8.16.6"
    },
    "event": {
        "agent_id_status": "verified",
        "dataset": "kafka.network",
        "duration": 1844428828,
        "ingested": "2025-07-30T14:34:03Z",
        "kind": "metric",
        "module": "jolokia",
        "type": [
            "info"
        ]
    },
    "host": {
        "architecture": "x86_64",
        "containerized": false,
        "hostname": "elastic-agent-94680",
        "ip": [
            "172.19.0.5",
            "172.21.0.2"
        ],
        "mac": [
            "FE-1B-8B-4B-3C-E4",
            "FE-AF-C2-4B-E7-A7"
        ],
        "name": "elastic-agent-94680",
        "os": {
            "family": "",
            "kernel": "6.14.0-1006-gcp",
            "name": "Wolfi",
            "platform": "wolfi",
            "type": "linux",
            "version": "20230201"
        }
    },
    "kafka": {
        "network": {
            "metric_fingerprint": "JsLzXjAr9kEeN83OzuFeZG+XNFE=",
            "socket_server": {
                "expired_connections_killed_count": 0
            }
        }
    },
    "metricset": {
        "name": "jmx",
        "period": 10000
    },
    "service": {
        "address": "http://kafka:8779/jolokia",
        "type": "kafka"
    }
}
ECS Field Reference
Please refer to the following document for detailed information on ECS fields.
Exported fields
| Field | Description | Type | Unit | Metric Type |
|---|---|---|---|---|
| @timestamp | Event timestamp. | date | ||
| agent.id | keyword | |||
| cloud.account.id | The cloud account or organization id used to identify different entities in a multi-tenant environment. Examples: AWS account id, Google Cloud ORG Id, or other unique identifier. | keyword | ||
| cloud.availability_zone | Availability zone in which this host is running. | keyword | ||
| cloud.image.id | Image ID for the cloud instance. | keyword | ||
| cloud.instance.id | Instance ID of the host machine. | keyword | ||
| cloud.provider | Name of the cloud provider. Example values are aws, azure, gcp, or digitalocean. | keyword | ||
| cloud.region | Region in which this host is running. | keyword | ||
| container.id | Unique container id. | keyword | ||
| data_stream.dataset | Data stream dataset. | constant_keyword | ||
| data_stream.namespace | Data stream namespace. | constant_keyword | ||
| data_stream.type | Data stream type. | constant_keyword | ||
| event.module | Event module | constant_keyword | ||
| host.containerized | If the host is a container. | boolean | ||
| host.name | Name of the host. It can contain what hostname returns on Unix systems, the fully qualified domain name, or a name specified by the user. The sender decides which value to use. |
keyword | ||
| host.os.build | OS build information. | keyword | ||
| host.os.codename | OS codename, if any. | keyword | ||
| kafka.network.acceptor_blocked.count | Total count of times the network acceptor thread was blocked. | double | counter | |
| kafka.network.acceptor_blocked.fifteen_minute_rate | Fifteen-minute rate of blocked acceptor events. | double | gauge | |
| kafka.network.acceptor_blocked.five_minute_rate | Five-minute rate of blocked acceptor events. | double | gauge | |
| kafka.network.acceptor_blocked.listener | The name of the network listener (e.g., BROKER, CONTROLLER). | keyword | ||
| kafka.network.acceptor_blocked.mean_rate | Mean rate of blocked acceptor events. | double | gauge | |
| kafka.network.acceptor_blocked.one_minute_rate | One-minute rate of blocked acceptor events. | double | gauge | |
| kafka.network.metric_fingerprint | A fingerprint of the metric path. | keyword | ||
| kafka.network.processor_idle_percent.network_processor | The ID of the network processor. | keyword | ||
| kafka.network.processor_idle_percent.value | Idle percentage for the network processor. | double | percent | gauge |
| kafka.network.request_channel.request_queue_size | The size of the request queue. | double | gauge | |
| kafka.network.request_channel.response_queue_size.processor | The ID of the network processor | keyword | ||
| kafka.network.request_channel.response_queue_size.value | The size of the response queue | double | gauge | |
| kafka.network.request_metrics.error_type | The type of error that occurred (e.g., NONE, LEADER_NOT_AVAILABLE). | keyword | ||
| kafka.network.request_metrics.errors_per_min.one_min_rate | One-minute rate of errors per second for the request type. | double | gauge | |
| kafka.network.request_metrics.local_time_ms.max | Maximum local processing time in milliseconds. | double | ms | gauge |
| kafka.network.request_metrics.local_time_ms.min | Minimum local processing time in milliseconds. | double | ms | gauge |
| kafka.network.request_metrics.local_time_ms.p95 | 95th percentile local processing time in milliseconds. | double | ms | gauge |
| kafka.network.request_metrics.local_time_ms.p99 | 99th percentile local processing time in milliseconds. | double | ms | gauge |
| kafka.network.request_metrics.local_time_ms.request_type | The type of Kafka request (e.g., Produce, Fetch, Metadata). | keyword | ||
| kafka.network.request_metrics.message_conversions_time_ms.max | Maximum time spent on message conversions in milliseconds. | double | ms | gauge |
| kafka.network.request_metrics.message_conversions_time_ms.min | Minimum time spent on message conversions in milliseconds. | double | ms | gauge |
| kafka.network.request_metrics.message_conversions_time_ms.p95 | 95th percentile time spent on message conversions in milliseconds. | double | ms | gauge |
| kafka.network.request_metrics.message_conversions_time_ms.p99 | 99th percentile time spent on message conversions in milliseconds. | double | ms | gauge |
| kafka.network.request_metrics.message_conversions_time_ms.request_type | The type of Kafka request (e.g., Produce, Fetch, Metadata). | keyword | ||
| kafka.network.request_metrics.remote_time_ms.max | Maximum remote processing time in milliseconds. | double | ms | gauge |
| kafka.network.request_metrics.remote_time_ms.min | Minimum remote processing time in milliseconds. | double | ms | gauge |
| kafka.network.request_metrics.remote_time_ms.p95 | 95th percentile remote processing time in milliseconds. | double | ms | gauge |
| kafka.network.request_metrics.remote_time_ms.p99 | 99th percentile remote processing time in milliseconds. | double | ms | gauge |
| kafka.network.request_metrics.remote_time_ms.request_type | The type of Kafka request (e.g., Produce, Fetch, Metadata). | keyword | ||
| kafka.network.request_metrics.request_bytes.max | Maximum request size in bytes. | double | byte | gauge |
| kafka.network.request_metrics.request_bytes.min | Minimum request size in bytes. | double | byte | gauge |
| kafka.network.request_metrics.request_bytes.p95 | 95th percentile request size in bytes. | double | byte | gauge |
| kafka.network.request_metrics.request_bytes.p99 | 99th percentile request size in bytes. | double | byte | gauge |
| kafka.network.request_metrics.request_bytes.request_type | The type of Kafka request (e.g., Produce, Fetch, Metadata). | keyword | ||
| kafka.network.request_metrics.request_queue_time_ms.max | Maximum time spent in request queue in milliseconds. | double | ms | gauge |
| kafka.network.request_metrics.request_queue_time_ms.min | Minimum time spent in request queue in milliseconds. | double | ms | gauge |
| kafka.network.request_metrics.request_queue_time_ms.p95 | 95th percentile time spent in request queue in milliseconds. | double | ms | gauge |
| kafka.network.request_metrics.request_queue_time_ms.p99 | 99th percentile time spent in request queue in milliseconds. | double | ms | gauge |
| kafka.network.request_metrics.request_queue_time_ms.request_type | The type of Kafka request (e.g., Produce, Fetch, Metadata). | keyword | ||
| kafka.network.request_metrics.request_type | The type of Kafka request (e.g., Produce, Fetch, Metadata). | keyword | ||
| kafka.network.request_metrics.response_queue_time_ms.max | Maximum time spent in response queue in milliseconds. | double | ms | gauge |
| kafka.network.request_metrics.response_queue_time_ms.min | Minimum time spent in response queue in milliseconds. | double | ms | gauge |
| kafka.network.request_metrics.response_queue_time_ms.p95 | 95th percentile time spent in response queue in milliseconds. | double | ms | gauge |
| kafka.network.request_metrics.response_queue_time_ms.p99 | 99th percentile time spent in response queue in milliseconds. | double | ms | gauge |
| kafka.network.request_metrics.response_queue_time_ms.request_type | The type of Kafka request (e.g., Produce, Fetch, Metadata). | keyword | ||
| kafka.network.request_metrics.response_send_time_ms.max | Maximum time to send response in milliseconds. | double | ms | gauge |
| kafka.network.request_metrics.response_send_time_ms.min | Minimum time to send response in milliseconds. | double | ms | gauge |
| kafka.network.request_metrics.response_send_time_ms.p95 | 95th percentile time to send response in milliseconds. | double | ms | gauge |
| kafka.network.request_metrics.response_send_time_ms.p99 | 99th percentile time to send response in milliseconds. | double | ms | gauge |
| kafka.network.request_metrics.response_send_time_ms.request_type | The type of Kafka request (e.g., Produce, Fetch, Metadata). | keyword | ||
| kafka.network.request_metrics.temporary_memory_bytes.max | Maximum temporary memory used in bytes. | double | byte | gauge |
| kafka.network.request_metrics.temporary_memory_bytes.min | Minimum temporary memory used in bytes. | double | byte | gauge |
| kafka.network.request_metrics.temporary_memory_bytes.p95 | 95th percentile temporary memory used in bytes. | double | byte | gauge |
| kafka.network.request_metrics.temporary_memory_bytes.p99 | 99th percentile temporary memory used in bytes. | double | byte | gauge |
| kafka.network.request_metrics.temporary_memory_bytes.request_type | The type of Kafka request (e.g., Produce, Fetch, Metadata). | keyword | ||
| kafka.network.request_metrics.throttle_time_ms.max | Maximum throttle time in milliseconds. | double | ms | gauge |
| kafka.network.request_metrics.throttle_time_ms.min | Minimum throttle time in milliseconds. | double | ms | gauge |
| kafka.network.request_metrics.throttle_time_ms.p95 | 95th percentile throttle time in milliseconds. | double | ms | gauge |
| kafka.network.request_metrics.throttle_time_ms.p99 | 99th percentile throttle time in milliseconds. | double | ms | gauge |
| kafka.network.request_metrics.throttle_time_ms.request_type | The type of Kafka request (e.g., Produce, Fetch, Metadata). | keyword | ||
| kafka.network.request_metrics.total_time_ms.max | Maximum total request time in milliseconds. | double | ms | gauge |
| kafka.network.request_metrics.total_time_ms.min | Minimum total request time in milliseconds. | double | ms | gauge |
| kafka.network.request_metrics.total_time_ms.p95 | 95th percentile total request time in milliseconds. | double | ms | gauge |
| kafka.network.request_metrics.total_time_ms.p99 | 99th percentile total request time in milliseconds. | double | ms | gauge |
| kafka.network.request_metrics.total_time_ms.request_type | The type of Kafka request (e.g., Produce, Fetch, Metadata). | keyword | ||
| kafka.network.socket_server.expired_connections_killed_count | The total number of expired connections killed by the socket server. | double | counter | |
| kafka.network.socket_server.memory_pool_available | The amount of memory currently available in the socket server's memory pool. | double | byte | gauge |
| kafka.network.socket_server.memory_pool_used | The amount of memory currently used in the socket server's memory pool. | double | byte | gauge |
| kafka.network.socket_server.processor_idle_percent | Average idle percentage across all network processors. | double | percent | gauge |
| service.address | Address where data about this service was collected from. This should be a URI, network address (ipv4:port or [ipv6]:port) or a resource path (sockets). | keyword |
The topic dataset collects metrics specific to Kafka topics and their partitions, providing insights into topic throughput, partition health, and log segment information.
This dataset includes metrics such as:
- Topic-level metrics (bytes in/out per second, message rates, fetch request rates)
- Partition metrics (in-sync replicas, under-replicated status, minimum ISR status)
- Log metrics (offset information, segment counts, log sizes)
Example
{
    "@timestamp": "2025-08-20T14:00:20.576Z",
    "agent": {
        "ephemeral_id": "2263e91f-2a55-46f2-a986-264dc67505b7",
        "id": "5dce837d-0939-476f-8ade-abe1b8f3f04d",
        "name": "elastic-agent-34315",
        "type": "metricbeat",
        "version": "8.16.6"
    },
    "cloud": {
        "account": {
            "id": "elastic-obs-integrations-dev"
        },
        "availability_zone": "asia-south1-c",
        "instance": {
            "id": "5798221542184199336",
            "name": "service-integration-dev-idc-ubuntu25-4"
        },
        "machine": {
            "type": "n1-standard-4"
        },
        "project": {
            "id": "elastic-obs-integrations-dev"
        },
        "provider": "gcp",
        "region": "asia-south1",
        "service": {
            "name": "GCE"
        }
    },
    "data_stream": {
        "dataset": "kafka.topic",
        "namespace": "12727",
        "type": "metrics"
    },
    "ecs": {
        "version": "8.11.0"
    },
    "elastic_agent": {
        "id": "5dce837d-0939-476f-8ade-abe1b8f3f04d",
        "snapshot": false,
        "version": "8.16.6"
    },
    "event": {
        "agent_id_status": "verified",
        "dataset": "kafka.topic",
        "duration": 527268120,
        "ingested": "2025-08-20T14:00:23Z",
        "kind": "metric",
        "module": "jolokia",
        "type": [
            "info"
        ]
    },
    "host": {
        "architecture": "x86_64",
        "containerized": false,
        "hostname": "elastic-agent-34315",
        "ip": [
            "172.19.0.5",
            "172.21.0.2"
        ],
        "mac": [
            "02-21-70-24-3F-AA",
            "56-4E-2C-A1-74-02"
        ],
        "name": "elastic-agent-34315",
        "os": {
            "family": "",
            "kernel": "6.14.0-1006-gcp",
            "name": "Wolfi",
            "platform": "wolfi",
            "type": "linux",
            "version": "20230201"
        }
    },
    "kafka": {
        "topic": {
            "log": {
                "segments_count": 1
            },
            "metric_fingerprint": "CLbssV/lfS15NatBdWk7ALHrg7E=",
            "partition": {
                "id": "0"
            },
            "topic": {
                "name": "__cluster_metadata"
            }
        }
    },
    "metricset": {
        "name": "jmx",
        "period": 10000
    },
    "service": {
        "address": "http://kafka:8779/jolokia",
        "type": "kafka"
    }
}
ECS Field Reference
Please refer to the following document for detailed information on ECS fields.
Exported fields
| Field | Description | Type | Unit | Metric Type |
|---|---|---|---|---|
| @timestamp | Event timestamp. | date | ||
| agent.id | keyword | |||
| cloud.account.id | The cloud account or organization id used to identify different entities in a multi-tenant environment. Examples: AWS account id, Google Cloud ORG Id, or other unique identifier. | keyword | ||
| cloud.availability_zone | Availability zone in which this host is running. | keyword | ||
| cloud.image.id | Image ID for the cloud instance. | keyword | ||
| cloud.instance.id | Instance ID of the host machine. | keyword | ||
| cloud.provider | Name of the cloud provider. Example values are aws, azure, gcp, or digitalocean. | keyword | ||
| cloud.region | Region in which this host is running. | keyword | ||
| container.id | Unique container id. | keyword | ||
| data_stream.dataset | Data stream dataset. | constant_keyword | ||
| data_stream.namespace | Data stream namespace. | constant_keyword | ||
| data_stream.type | Data stream type. | constant_keyword | ||
| event.module | Event module | constant_keyword | ||
| host.containerized | If the host is a container. | boolean | ||
| host.name | Name of the host. It can contain what hostname returns on Unix systems, the fully qualified domain name, or a name specified by the user. The sender decides which value to use. |
keyword | ||
| host.os.build | OS build information. | keyword | ||
| host.os.codename | OS codename, if any. | keyword | ||
| kafka.topic.log.end_offset | The end offset of the log. | double | gauge | |
| kafka.topic.log.segments_count | The number of log segments. | double | gauge | |
| kafka.topic.log.size | The size of the log in bytes. | double | byte | gauge |
| kafka.topic.log.start_offset | The start offset of the log. | double | gauge | |
| kafka.topic.metric_fingerprint | A fingerprint of the metric path. | keyword | ||
| kafka.topic.partition.at_min_isr | Whether the partition is at minimum in-sync replicas. | integer | gauge | |
| kafka.topic.partition.id | The ID of the Kafka partition. | keyword | ||
| kafka.topic.partition.insync_replicas_count | The number of in-sync replicas. | double | gauge | |
| kafka.topic.partition.last_stable_offset_lag | The lag of the last stable offset. | double | gauge | |
| kafka.topic.partition.replicas_count | The total number of replicas. | double | gauge | |
| kafka.topic.partition.under_min_isr | Whether the partition is under minimum in-sync replicas. | integer | gauge | |
| kafka.topic.partition.under_replicated | Whether the partition is under-replicated. | integer | gauge | |
| kafka.topic.topic.bytes_in_per_sec | The rate of incoming bytes per second. | double | byte | gauge |
| kafka.topic.topic.bytes_out_per_sec | The rate of outgoing bytes per second. | double | byte | gauge |
| kafka.topic.topic.bytes_rejected_per_sec | The rate of rejected bytes per second. | double | byte | gauge |
| kafka.topic.topic.fetch_requests_per_sec | The rate of fetch requests per second. | double | gauge | |
| kafka.topic.topic.messages_in_per_sec | The rate of incoming messages per second. | double | gauge | |
| kafka.topic.topic.name | The name of the Kafka topic. | keyword | ||
| service.address | Address where data about this service was collected from. This should be a URI, network address (ipv4:port or [ipv6]:port) or a resource path (sockets). | keyword |
The consumer dataset collects metrics specifically for monitoring the performance, throughput, and health of Kafka consumers. It provides key insights into how effectively consumers are processing data, their rate of interaction with brokers, and whether they are keeping up with message production.
This dataset includes metrics such as:
- Consumption Rates: Metrics like bytes_consumed, records_consumed, and in.bytes_per_sec track the throughput of the consumer in terms of both the number of messages and the volume of data processed per second.
- Consumer Lag: The max_lag metric is a critical indicator of consumer health, showing the maximum delay between the producer writing a message and the consumer reading it.
- Fetch Performance: The fetch_rate provides visibility into how frequently the consumer is requesting new messages from the broker.
Usage
The Consumer dataset relies on Jolokia to fetch JMX metrics. Refer to the link for more information about Jolokia.
Note that the Jolokia agent is required to be deployed along with the JVM application. This can be achieved by using the KAFKA_OPTS environment variable when starting the Kafka consumer application (replace /opt/jolokia-jvm-1.5.0-agent.jar with your Jolokia agent location):
export KAFKA_OPTS=-javaagent:/opt/jolokia-jvm-1.5.0-agent.jar=port=<port>,host=<host>
./bin/kafka-console-consumer.sh --topic=test --bootstrap-server=<kafka_host>:<kafka_port>
Example
{
    "@timestamp": "2025-09-12T11:07:25.711Z",
    "agent": {
        "ephemeral_id": "326018cd-af13-47dc-8878-aa8c94563fd9",
        "id": "8b71396e-713d-4903-9fab-bf8e337e0f21",
        "name": "elastic-agent-55314",
        "type": "metricbeat",
        "version": "8.19.0"
    },
    "data_stream": {
        "dataset": "kafka.consumer",
        "namespace": "31101",
        "type": "metrics"
    },
    "ecs": {
        "version": "8.11.0"
    },
    "elastic_agent": {
        "id": "8b71396e-713d-4903-9fab-bf8e337e0f21",
        "snapshot": false,
        "version": "8.19.0"
    },
    "event": {
        "agent_id_status": "verified",
        "dataset": "kafka.consumer",
        "duration": 190897139,
        "ingested": "2025-09-12T11:07:28Z",
        "kind": "metric",
        "module": "jolokia",
        "type": [
            "info"
        ]
    },
    "host": {
        "architecture": "aarch64",
        "containerized": false,
        "hostname": "elastic-agent-55314",
        "ip": [
            "172.19.0.4",
            "172.22.0.2"
        ],
        "mac": [
            "6E-33-D1-42-50-99",
            "BA-62-17-83-57-BC"
        ],
        "name": "elastic-agent-55314",
        "os": {
            "family": "",
            "kernel": "6.8.0-64-generic",
            "name": "Wolfi",
            "platform": "wolfi",
            "type": "linux",
            "version": "20230201"
        }
    },
    "kafka": {
        "consumer": {
            "client_id": "console-consumer",
            "mbean": "kafka.consumer:type=consumer-fetch-manager-metrics,client-id=console-consumer",
            "metric_fingerprint": "gkttPSbYlnXwXHsW2bmYbgRVYVs="
        }
    },
    "metricset": {
        "name": "jmx",
        "period": 10000
    },
    "service": {
        "address": "http://svc-kafka:8774/jolokia",
        "type": "kafka"
    }
}
ECS Field Reference
Please refer to the following document for detailed information on ECS fields.
Exported fields
| Field | Description | Type | Unit | Metric Type |
|---|---|---|---|---|
| @timestamp | Event timestamp. | date | ||
| agent.id | keyword | |||
| cloud.account.id | The cloud account or organization id used to identify different entities in a multi-tenant environment. Examples: AWS account id, Google Cloud ORG Id, or other unique identifier. | keyword | ||
| cloud.availability_zone | Availability zone in which this host is running. | keyword | ||
| cloud.image.id | Image ID for the cloud instance. | keyword | ||
| cloud.instance.id | Instance ID of the host machine. | keyword | ||
| cloud.provider | Name of the cloud provider. Example values are aws, azure, gcp, or digitalocean. | keyword | ||
| cloud.region | Region in which this host is running. | keyword | ||
| container.id | Unique container id. | keyword | ||
| data_stream.dataset | Data stream dataset. | constant_keyword | ||
| data_stream.namespace | Data stream namespace. | constant_keyword | ||
| data_stream.type | Data stream type. | constant_keyword | ||
| event.module | Event module | constant_keyword | ||
| host.containerized | If the host is a container. | boolean | ||
| host.name | Name of the host. It can contain what hostname returns on Unix systems, the fully qualified domain name, or a name specified by the user. The sender decides which value to use. |
keyword | ||
| host.os.build | OS build information. | keyword | ||
| host.os.codename | OS codename, if any. | keyword | ||
| kafka.broker.address | Broker advertised address | keyword | ||
| kafka.broker.id | Broker id | long | ||
| kafka.consumer.bytes_consumed | The average number of bytes consumed for a specific topic per second. | float | byte | gauge |
| kafka.consumer.client_id | keyword | |||
| kafka.consumer.fetch_rate | The minimum rate at which the consumer sends fetch requests to a broker. | float | gauge | |
| kafka.consumer.in.bytes_per_sec | The rate of bytes coming in to the consumer. | float | byte | gauge |
| kafka.consumer.max_lag | The maximum consumer lag. | float | gauge | |
| kafka.consumer.mbean | Mbean that this event is related to. | keyword | ||
| kafka.consumer.metric_fingerprint | A fingerprint of the metric path. | keyword | ||
| kafka.consumer.records_consumed | The average number of records consumed per second for a specific topic. | float | gauge | |
| kafka.partition.id | Partition id. | long | ||
| kafka.partition.topic_broker_id | Unique id of the partition in the topic and the broker. | keyword | ||
| kafka.partition.topic_id | Unique id of the partition in the topic. | keyword | ||
| kafka.topic.error.code | Topic error code. | long | ||
| kafka.topic.name | Topic name | keyword | ||
| service.address | Address where data about this service was collected from. This should be a URI, network address (ipv4:port or [ipv6]:port) or a resource path (sockets). | keyword |
The producer dataset gathers metrics focused on the performance, efficiency, and health of Kafka producers. This data is crucial for understanding message production rates, identifying potential bottlenecks, and ensuring reliable data ingestion into Kafka topics.
This dataset includes metrics such as:
- Throughput and Rate Metrics: Fields like record_send_rate, out.bytes_per_sec, and request_rate measure the producer's output, providing a clear view of how much data is being sent per second.
- Batching Performance: Metrics such as batch_size_avg, batch_size_max, and records_per_request offer insights into the effectiveness of batching, which is key for optimizing producer efficiency.
- Health and Error Indicators: The record_error_rate and record_retry_rate are vital for monitoring the health of the producer, highlighting issues that could lead to data loss or delays.
- Resource Utilization: Metrics like available_buffer_bytes and io_wait help track resource usage and identify performance constraints related to memory or I/O.
- Data Characteristics: Fields such as record_size_avg and record_size_max provide information about the size of the records being sent.
Usage
The Producer dataset relies on Jolokia to fetch JMX metrics. Refer to the link for more information about Jolokia.
Note that the Jolokia agent is required to be deployed along with the JVM application. This can be achieved by using the KAFKA_OPTS environment variable when starting the Kafka producer application (replace /opt/jolokia-jvm-1.5.0-agent.jar with your Jolokia agent location):
export KAFKA_OPTS=-javaagent:/opt/jolokia-jvm-1.5.0-agent.jar=port=<port>,host=<host>
./bin/kafka-console-producer.sh --topic test --broker-list <kafka_host>:<kafka_port>
ECS Field Reference
Please refer to the following document for detailed information on ECS fields.
Exported fields
| Field | Description | Type | Unit | Metric Type |
|---|---|---|---|---|
| @timestamp | Event timestamp. | date | ||
| agent.id | keyword | |||
| cloud.account.id | The cloud account or organization id used to identify different entities in a multi-tenant environment. Examples: AWS account id, Google Cloud ORG Id, or other unique identifier. | keyword | ||
| cloud.availability_zone | Availability zone in which this host is running. | keyword | ||
| cloud.image.id | Image ID for the cloud instance. | keyword | ||
| cloud.instance.id | Instance ID of the host machine. | keyword | ||
| cloud.provider | Name of the cloud provider. Example values are aws, azure, gcp, or digitalocean. | keyword | ||
| cloud.region | Region in which this host is running. | keyword | ||
| container.id | Unique container id. | keyword | ||
| data_stream.dataset | Data stream dataset. | constant_keyword | ||
| data_stream.namespace | Data stream namespace. | constant_keyword | ||
| data_stream.type | Data stream type. | constant_keyword | ||
| event.module | Event module | constant_keyword | ||
| host.containerized | If the host is a container. | boolean | ||
| host.name | Name of the host. It can contain what hostname returns on Unix systems, the fully qualified domain name, or a name specified by the user. The sender decides which value to use. |
keyword | ||
| host.os.build | OS build information. | keyword | ||
| host.os.codename | OS codename, if any. | keyword | ||
| kafka.broker.address | Broker advertised address | keyword | ||
| kafka.broker.id | Broker id | long | ||
| kafka.partition.id | Partition id. | long | ||
| kafka.partition.topic_broker_id | Unique id of the partition in the topic and the broker. | keyword | ||
| kafka.partition.topic_id | Unique id of the partition in the topic. | keyword | ||
| kafka.producer.available_buffer_bytes | The total amount of buffer memory. | float | byte | gauge |
| kafka.producer.batch_size_avg | The average number of bytes sent. | float | byte | gauge |
| kafka.producer.batch_size_max | The maximum number of bytes sent. | long | byte | gauge |
| kafka.producer.client_id | keyword | |||
| kafka.producer.io_wait | The producer I/O wait time. | float | nanos | gauge |
| kafka.producer.mbean | Mbean that this event is related to. | keyword | ||
| kafka.producer.metric_fingerprint | A fingerprint of the metric path. | keyword | ||
| kafka.producer.node_id | keyword | |||
| kafka.producer.out.bytes_per_sec | The rate of bytes going out for the producer. | float | byte | gauge |
| kafka.producer.record_error_rate | The average number of retried record sends per second. | float | gauge | |
| kafka.producer.record_retry_rate | The average number of retried record sends per second. | float | gauge | |
| kafka.producer.record_send_rate | The average number of records sent per second. | float | gauge | |
| kafka.producer.record_size_avg | The average record size. | float | byte | gauge |
| kafka.producer.record_size_max | The maximum record size. | long | byte | gauge |
| kafka.producer.records_per_request | The average number of records sent per second. | float | gauge | |
| kafka.producer.request_rate | The number of producer requests per second. | float | gauge | |
| kafka.producer.response_rate | The number of producer responses per second. | float | gauge | |
| kafka.topic.error.code | Topic error code. | long | ||
| kafka.topic.name | Topic name | keyword | ||
| service.address | Address where data about this service was collected from. This should be a URI, network address (ipv4:port or [ipv6]:port) or a resource path (sockets). | keyword |
This integration includes one or more Kibana dashboards that visualizes the data collected by the integration. The screenshots below illustrate how the ingested data is displayed.
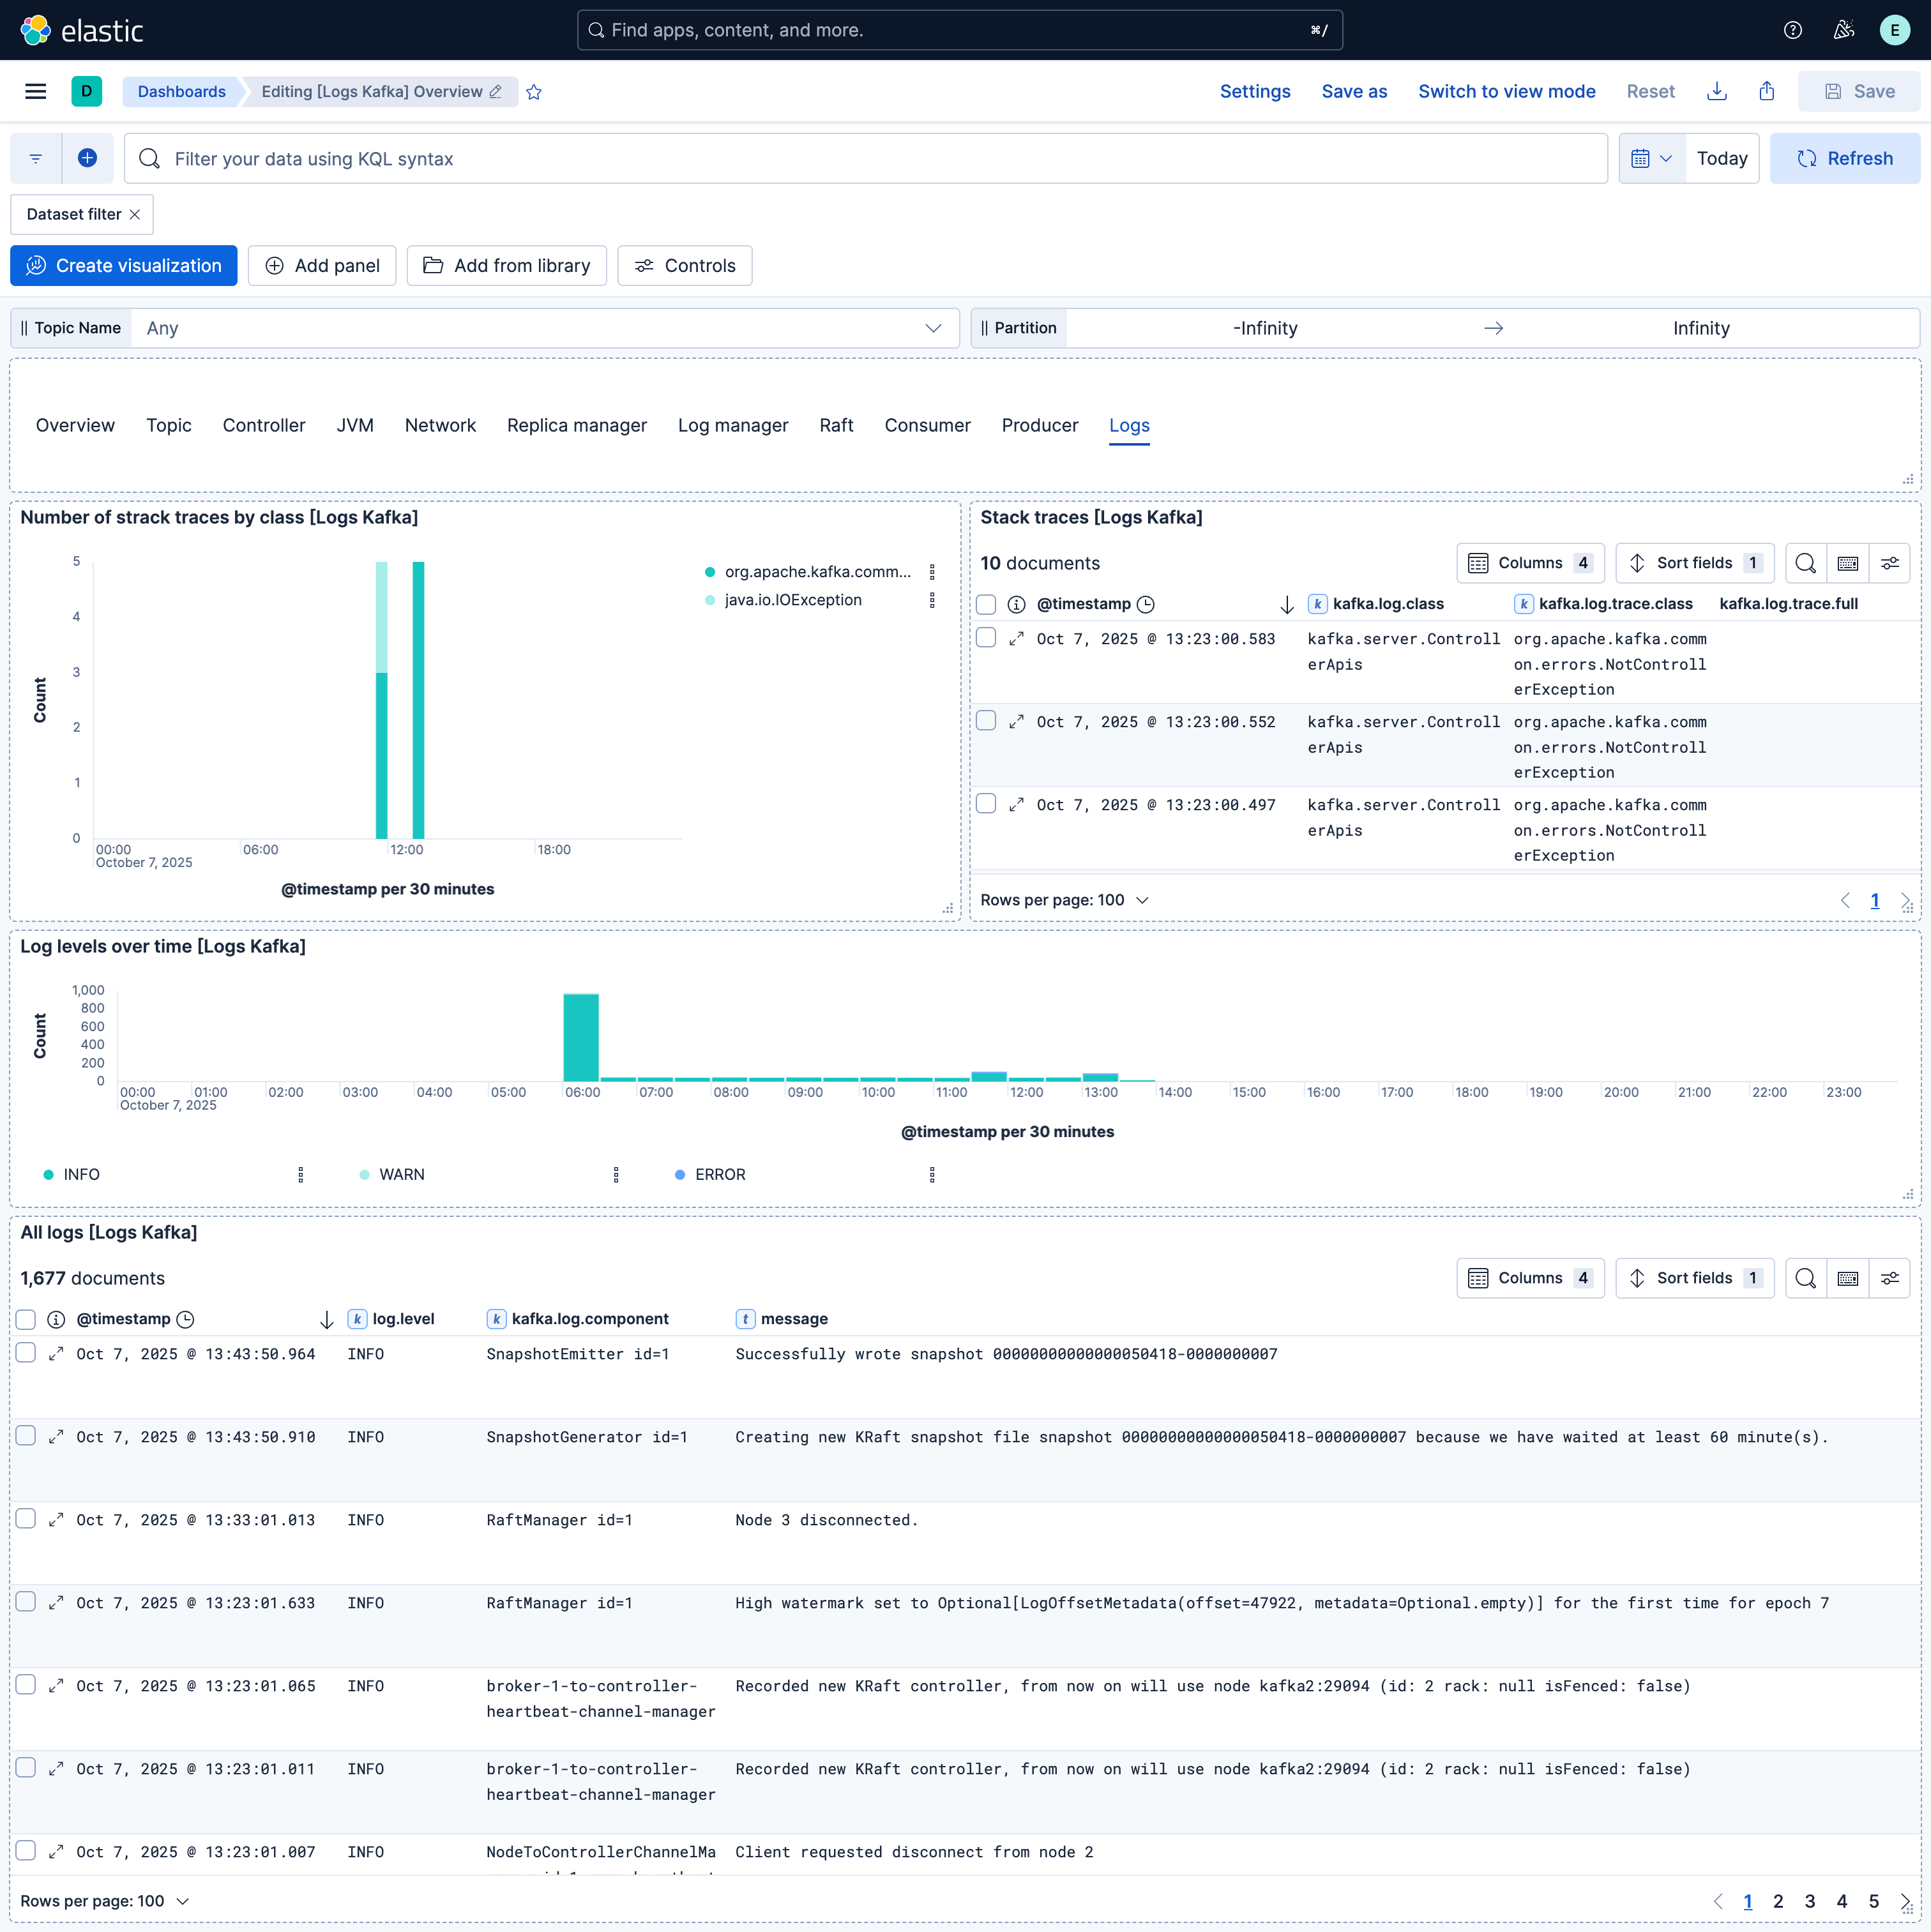
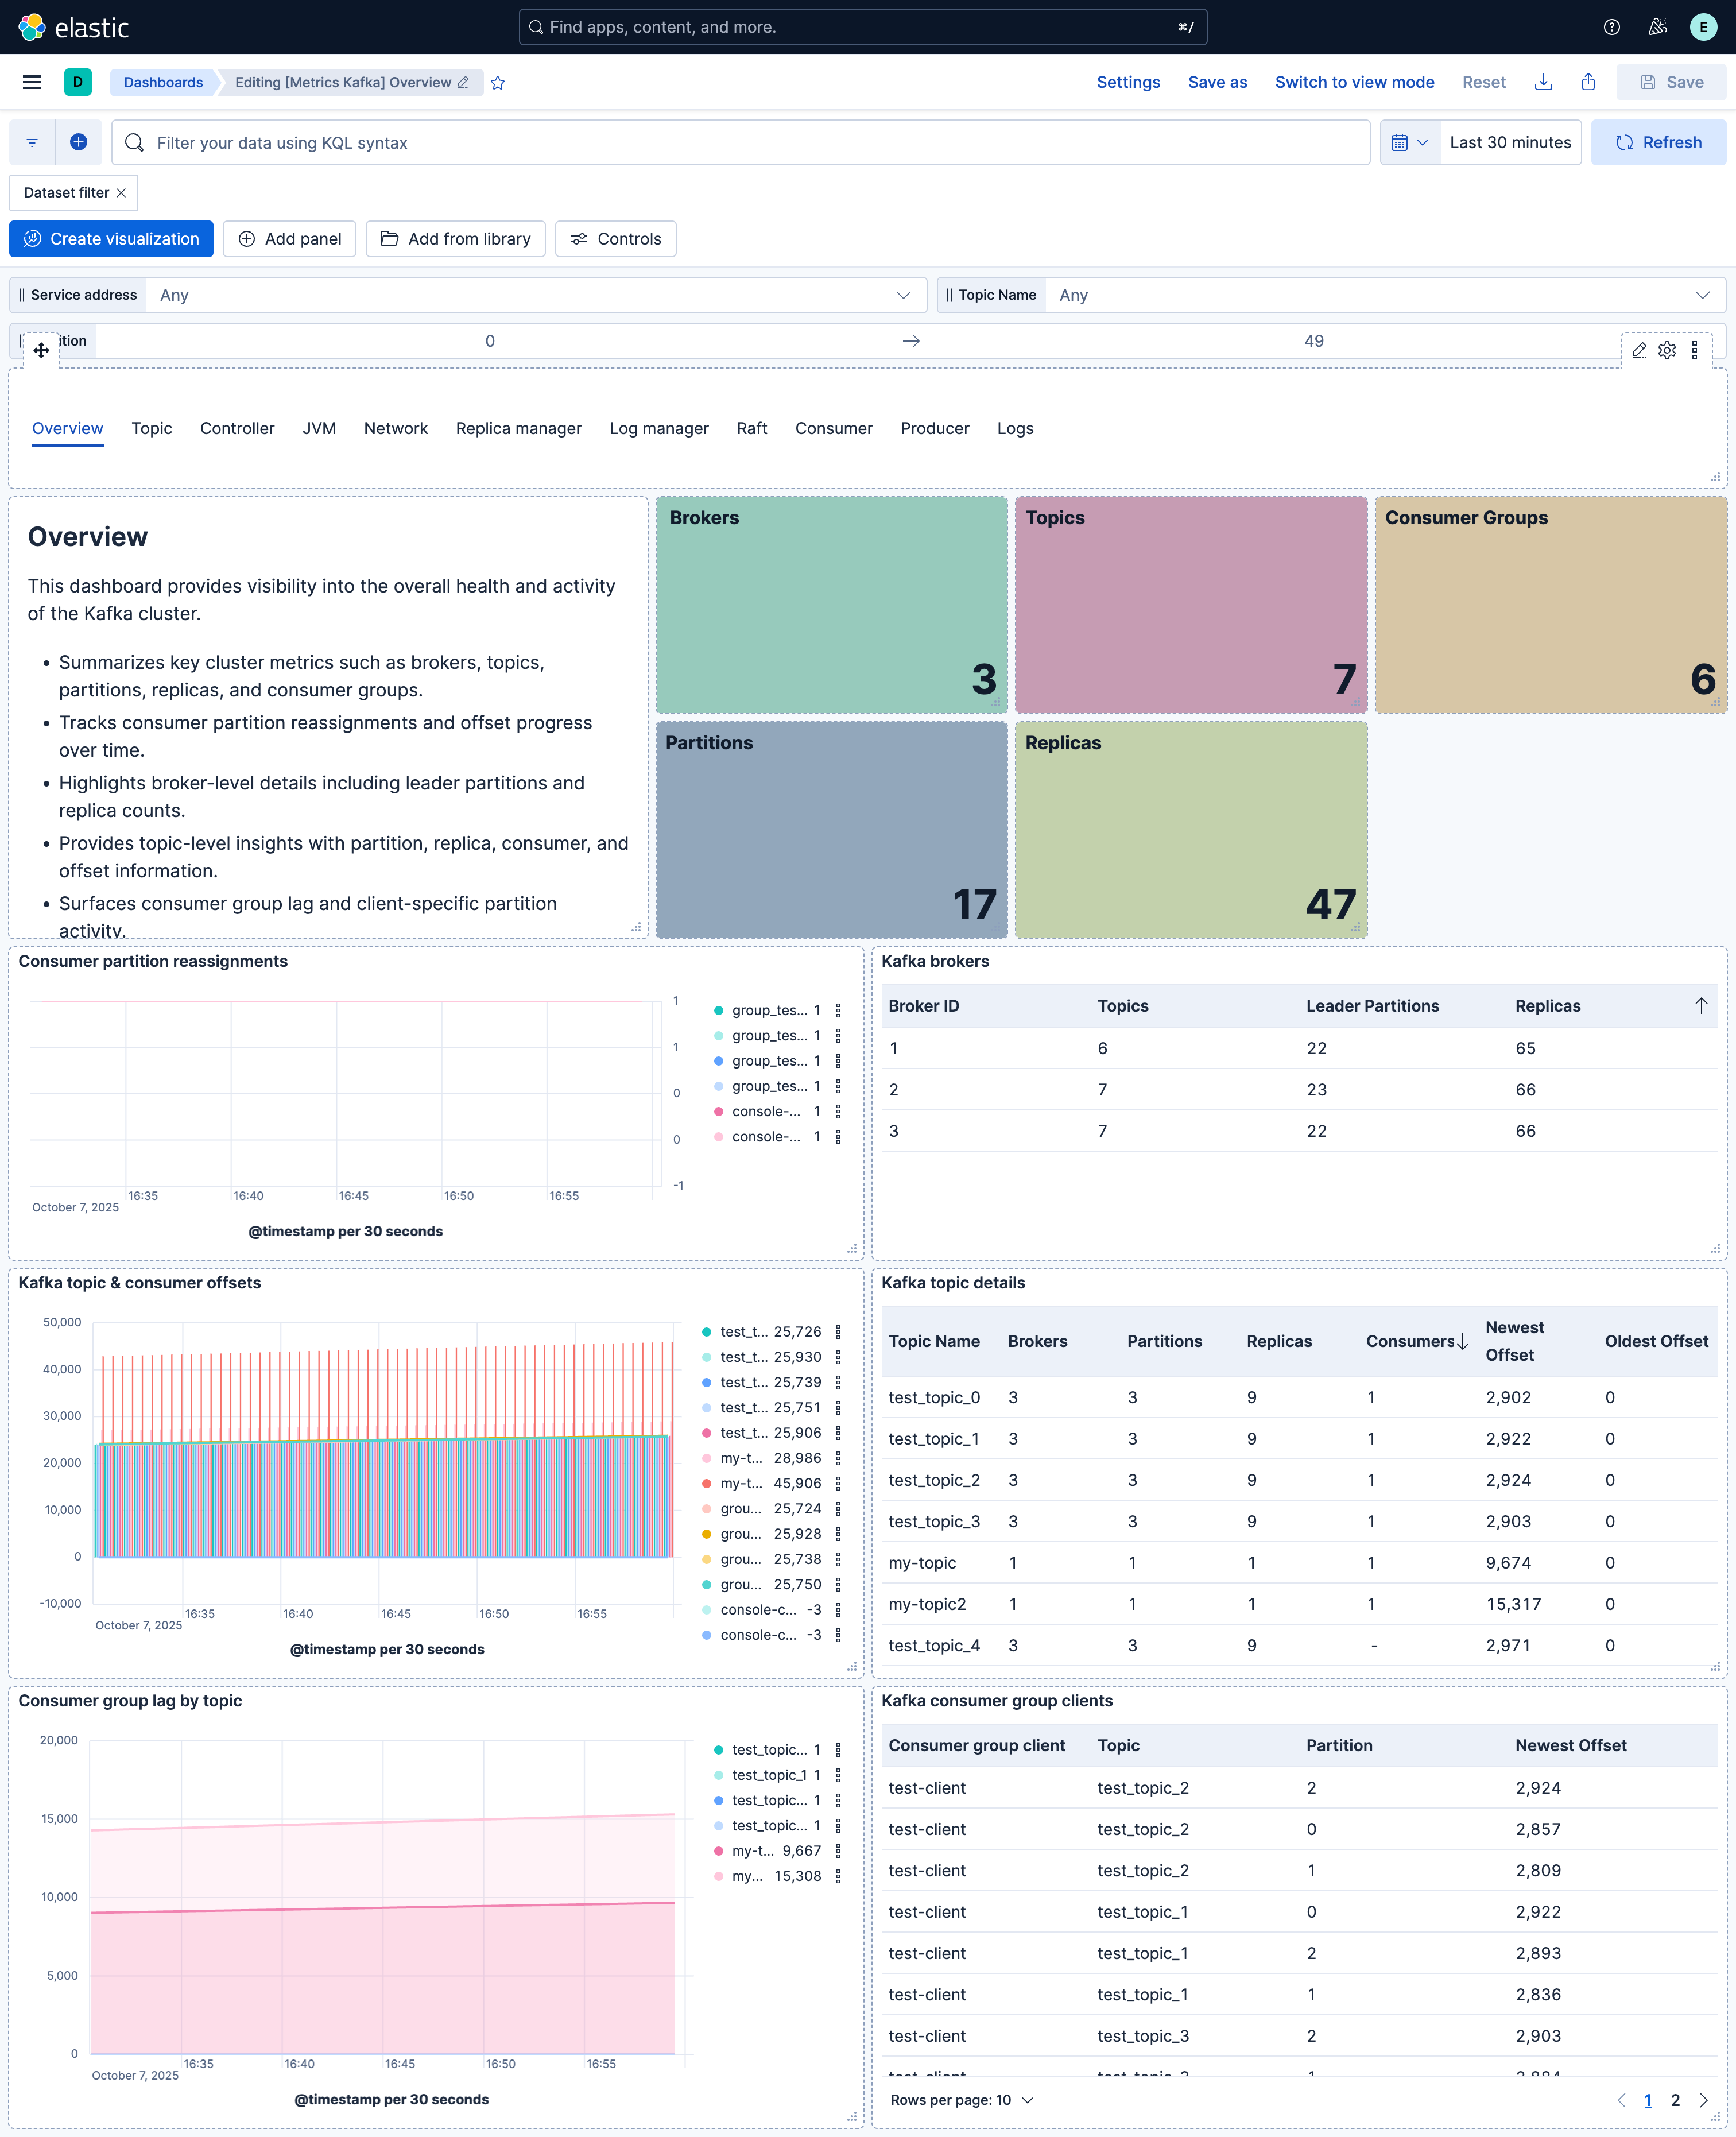
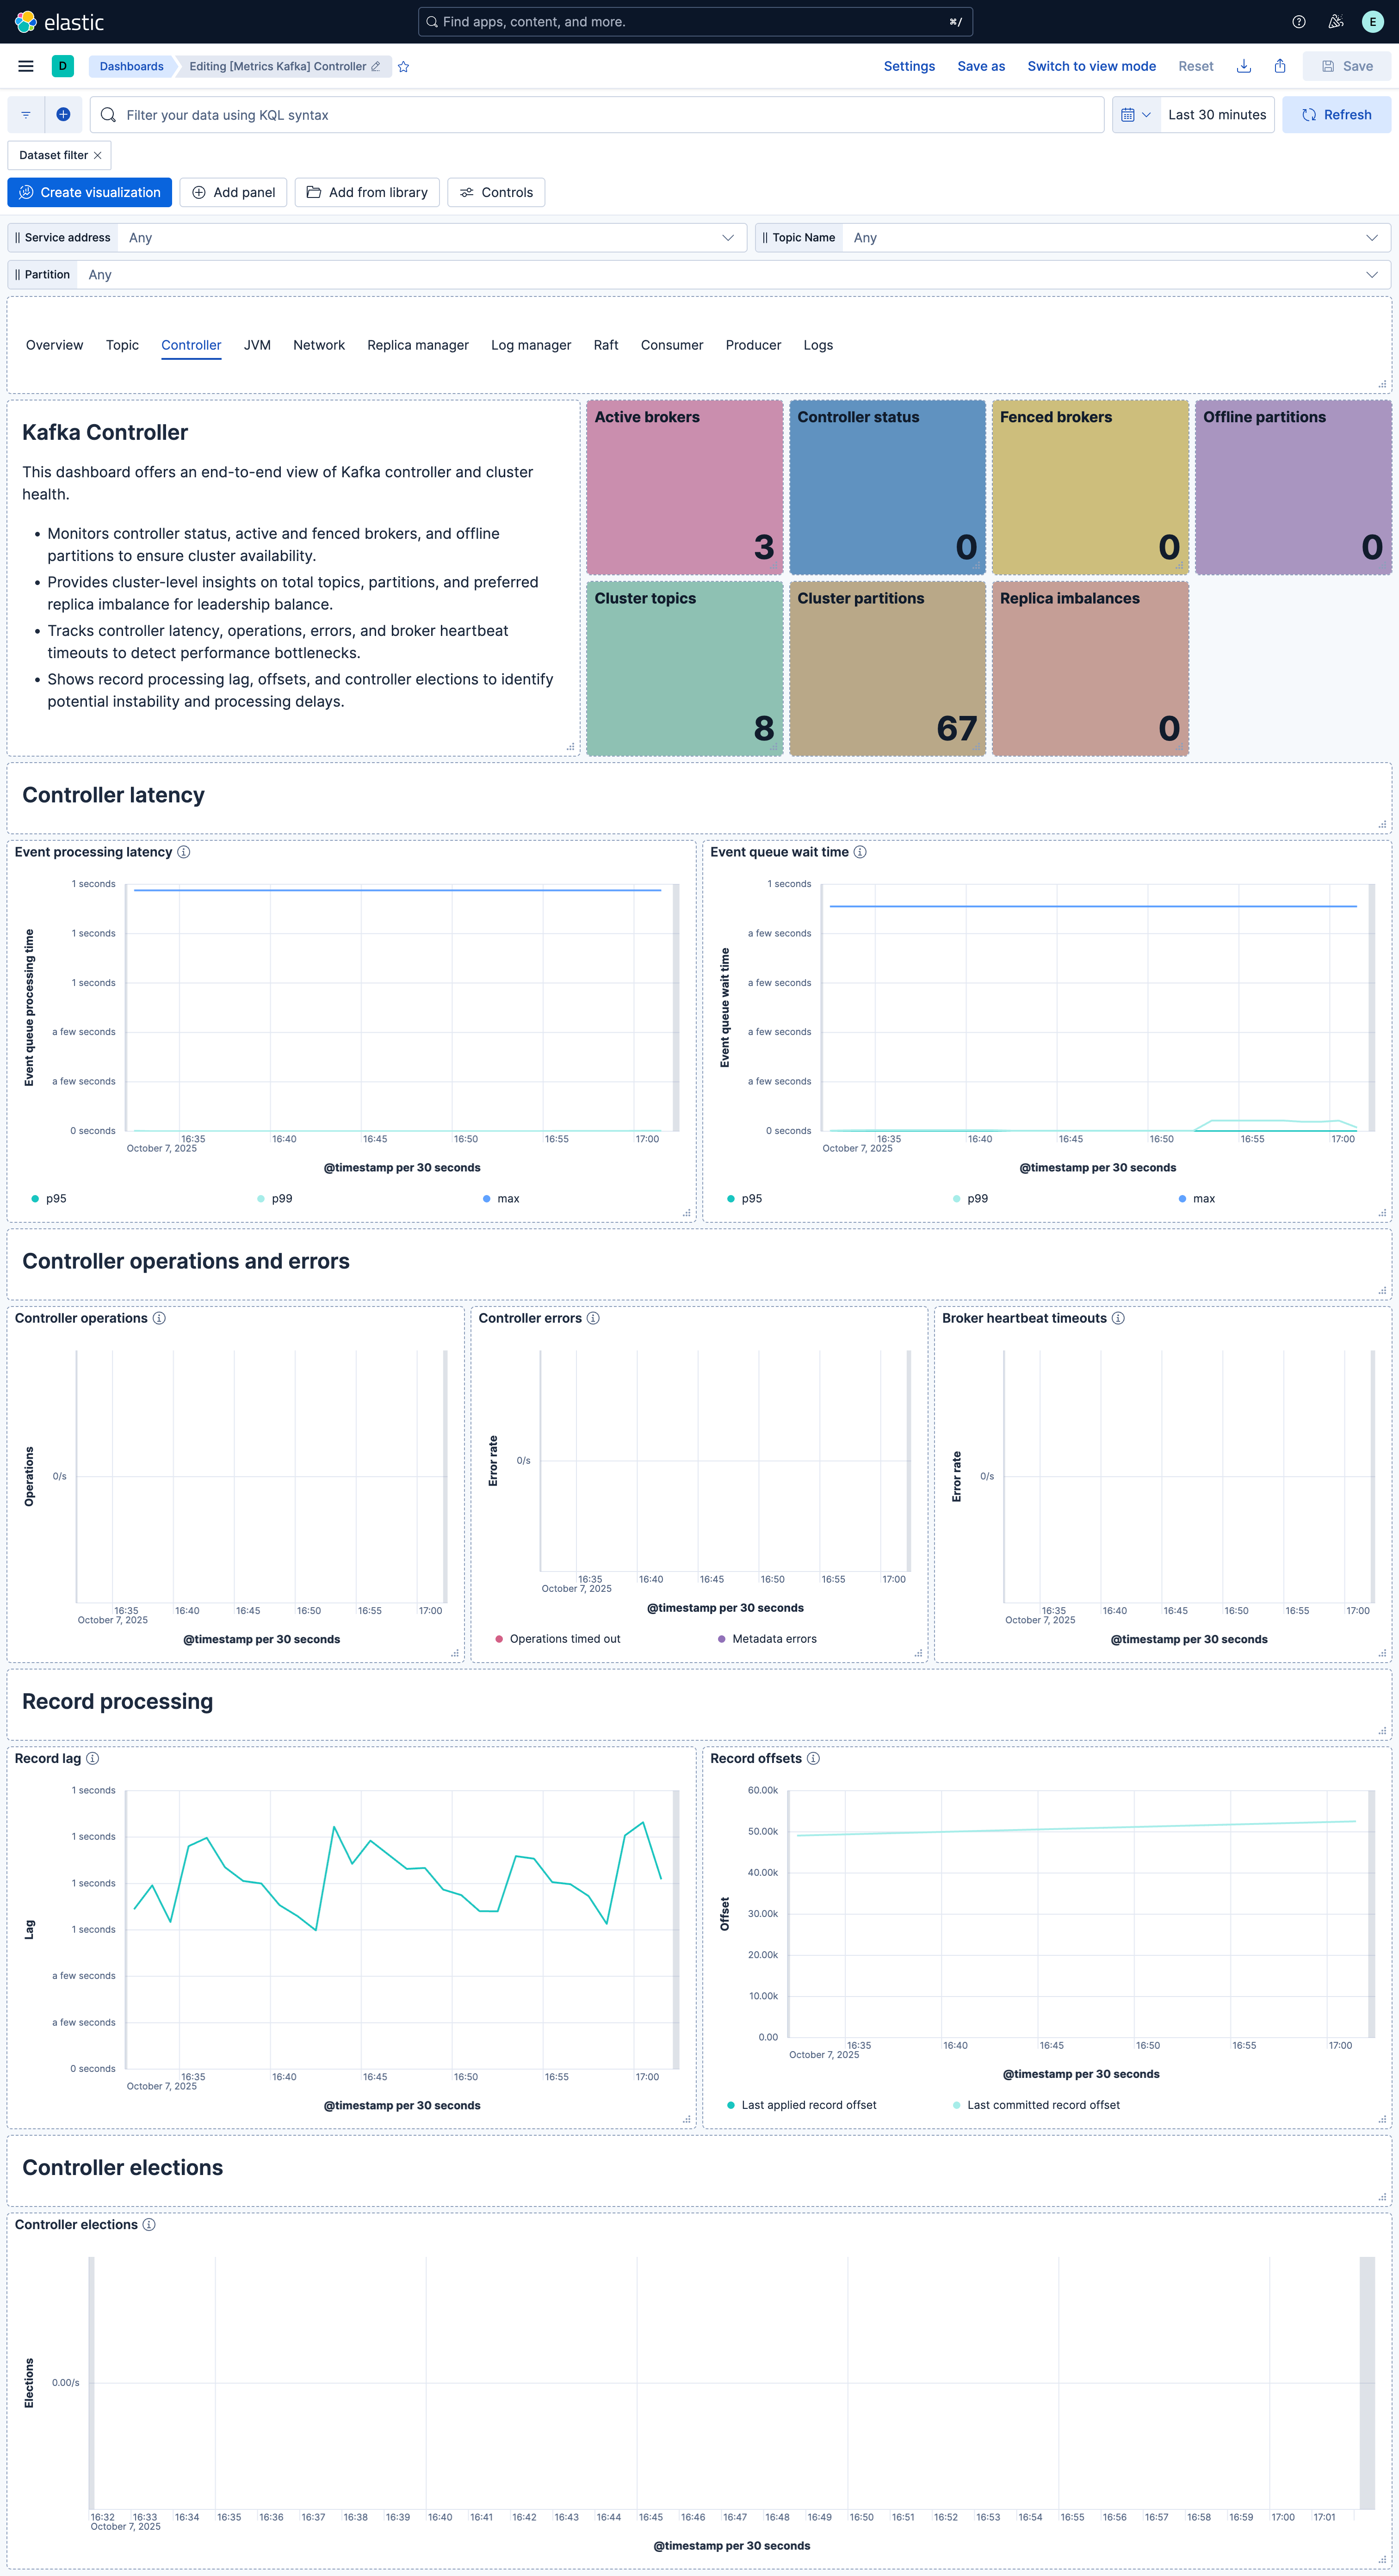
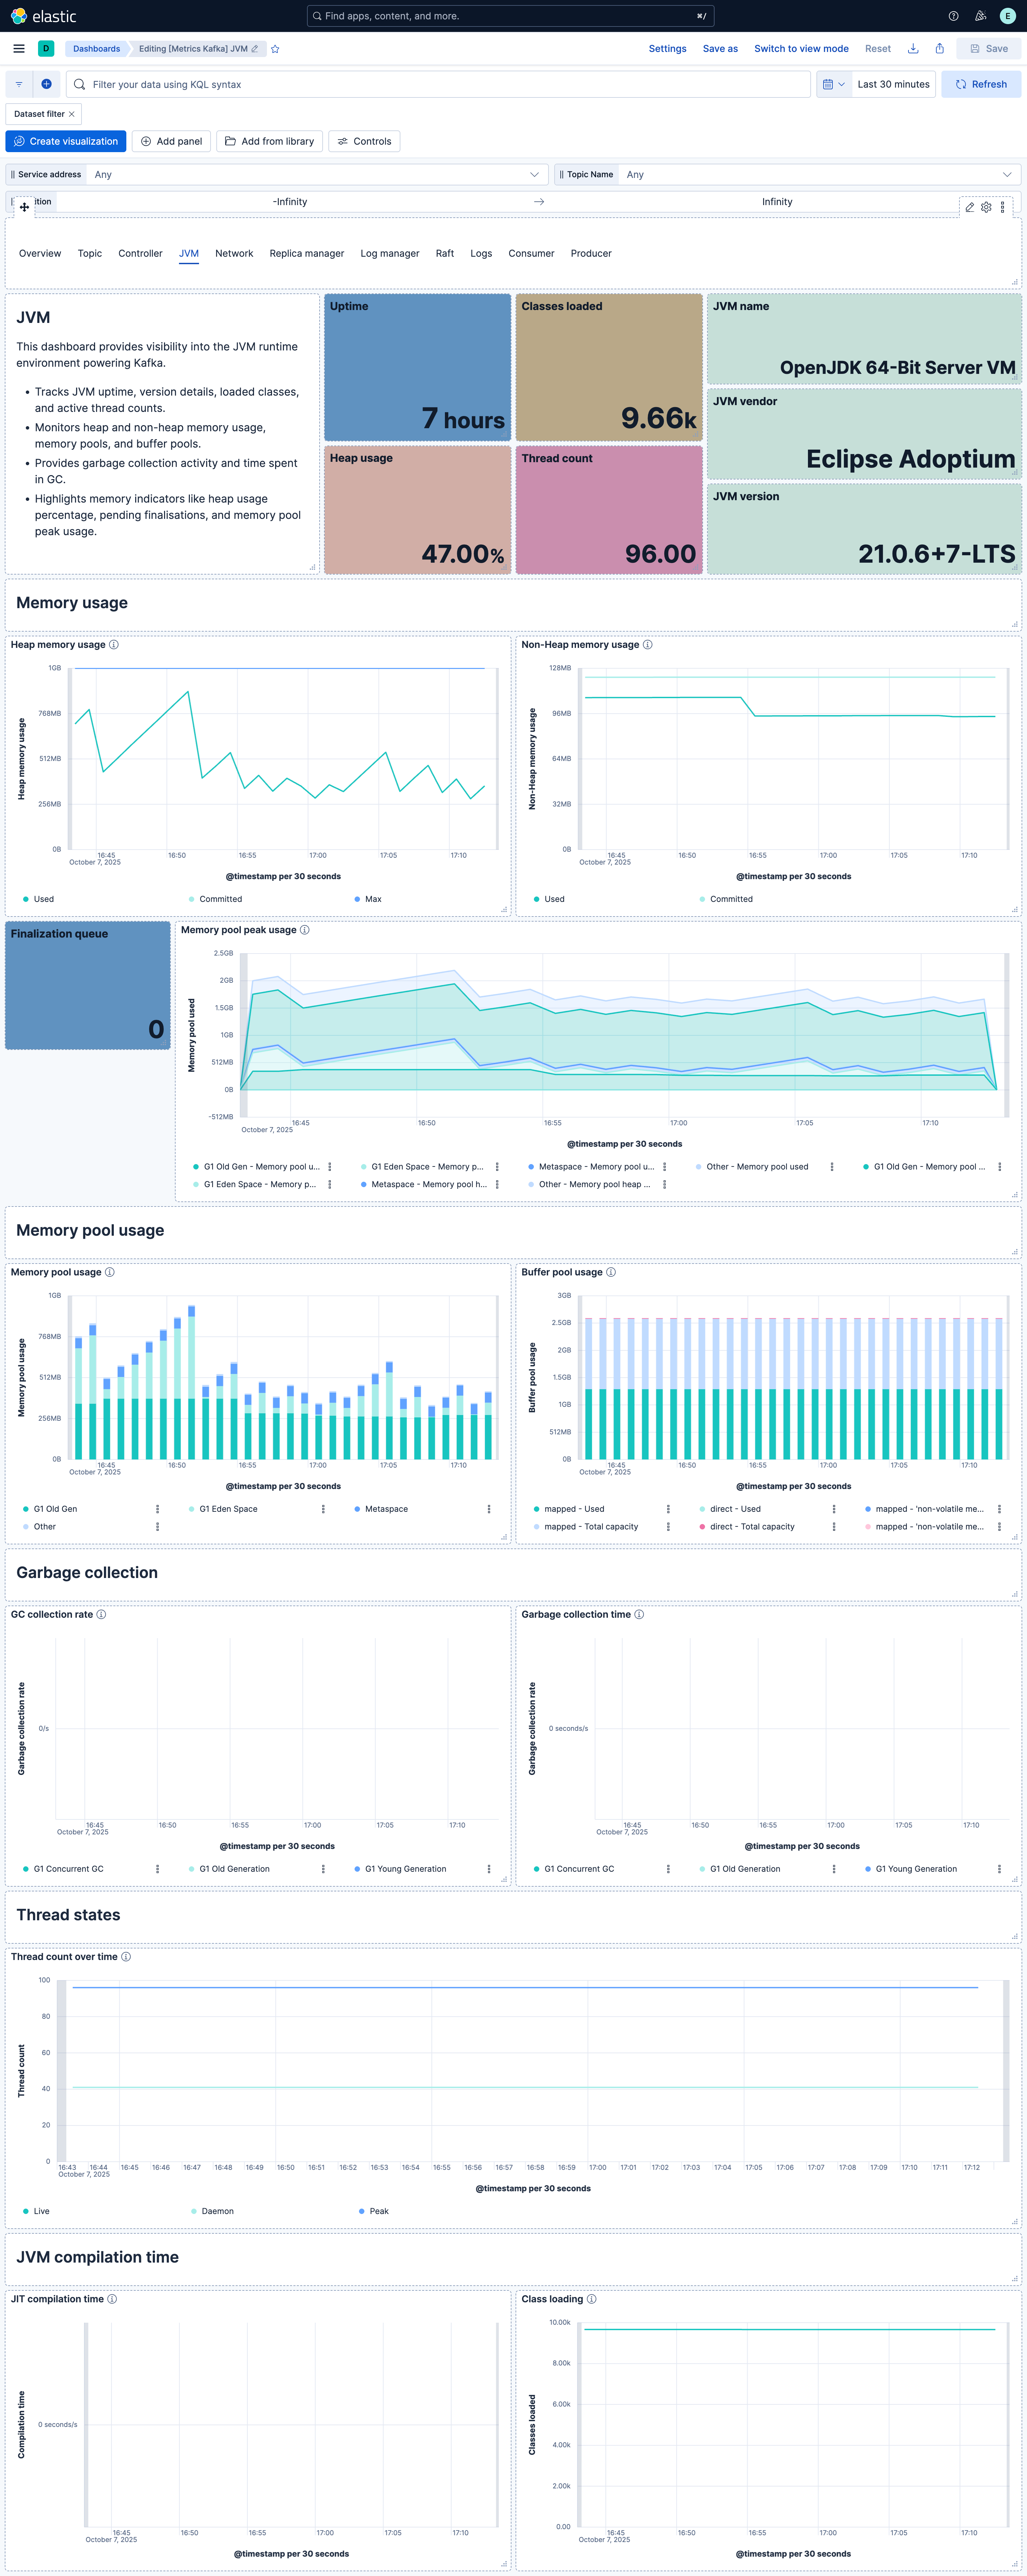
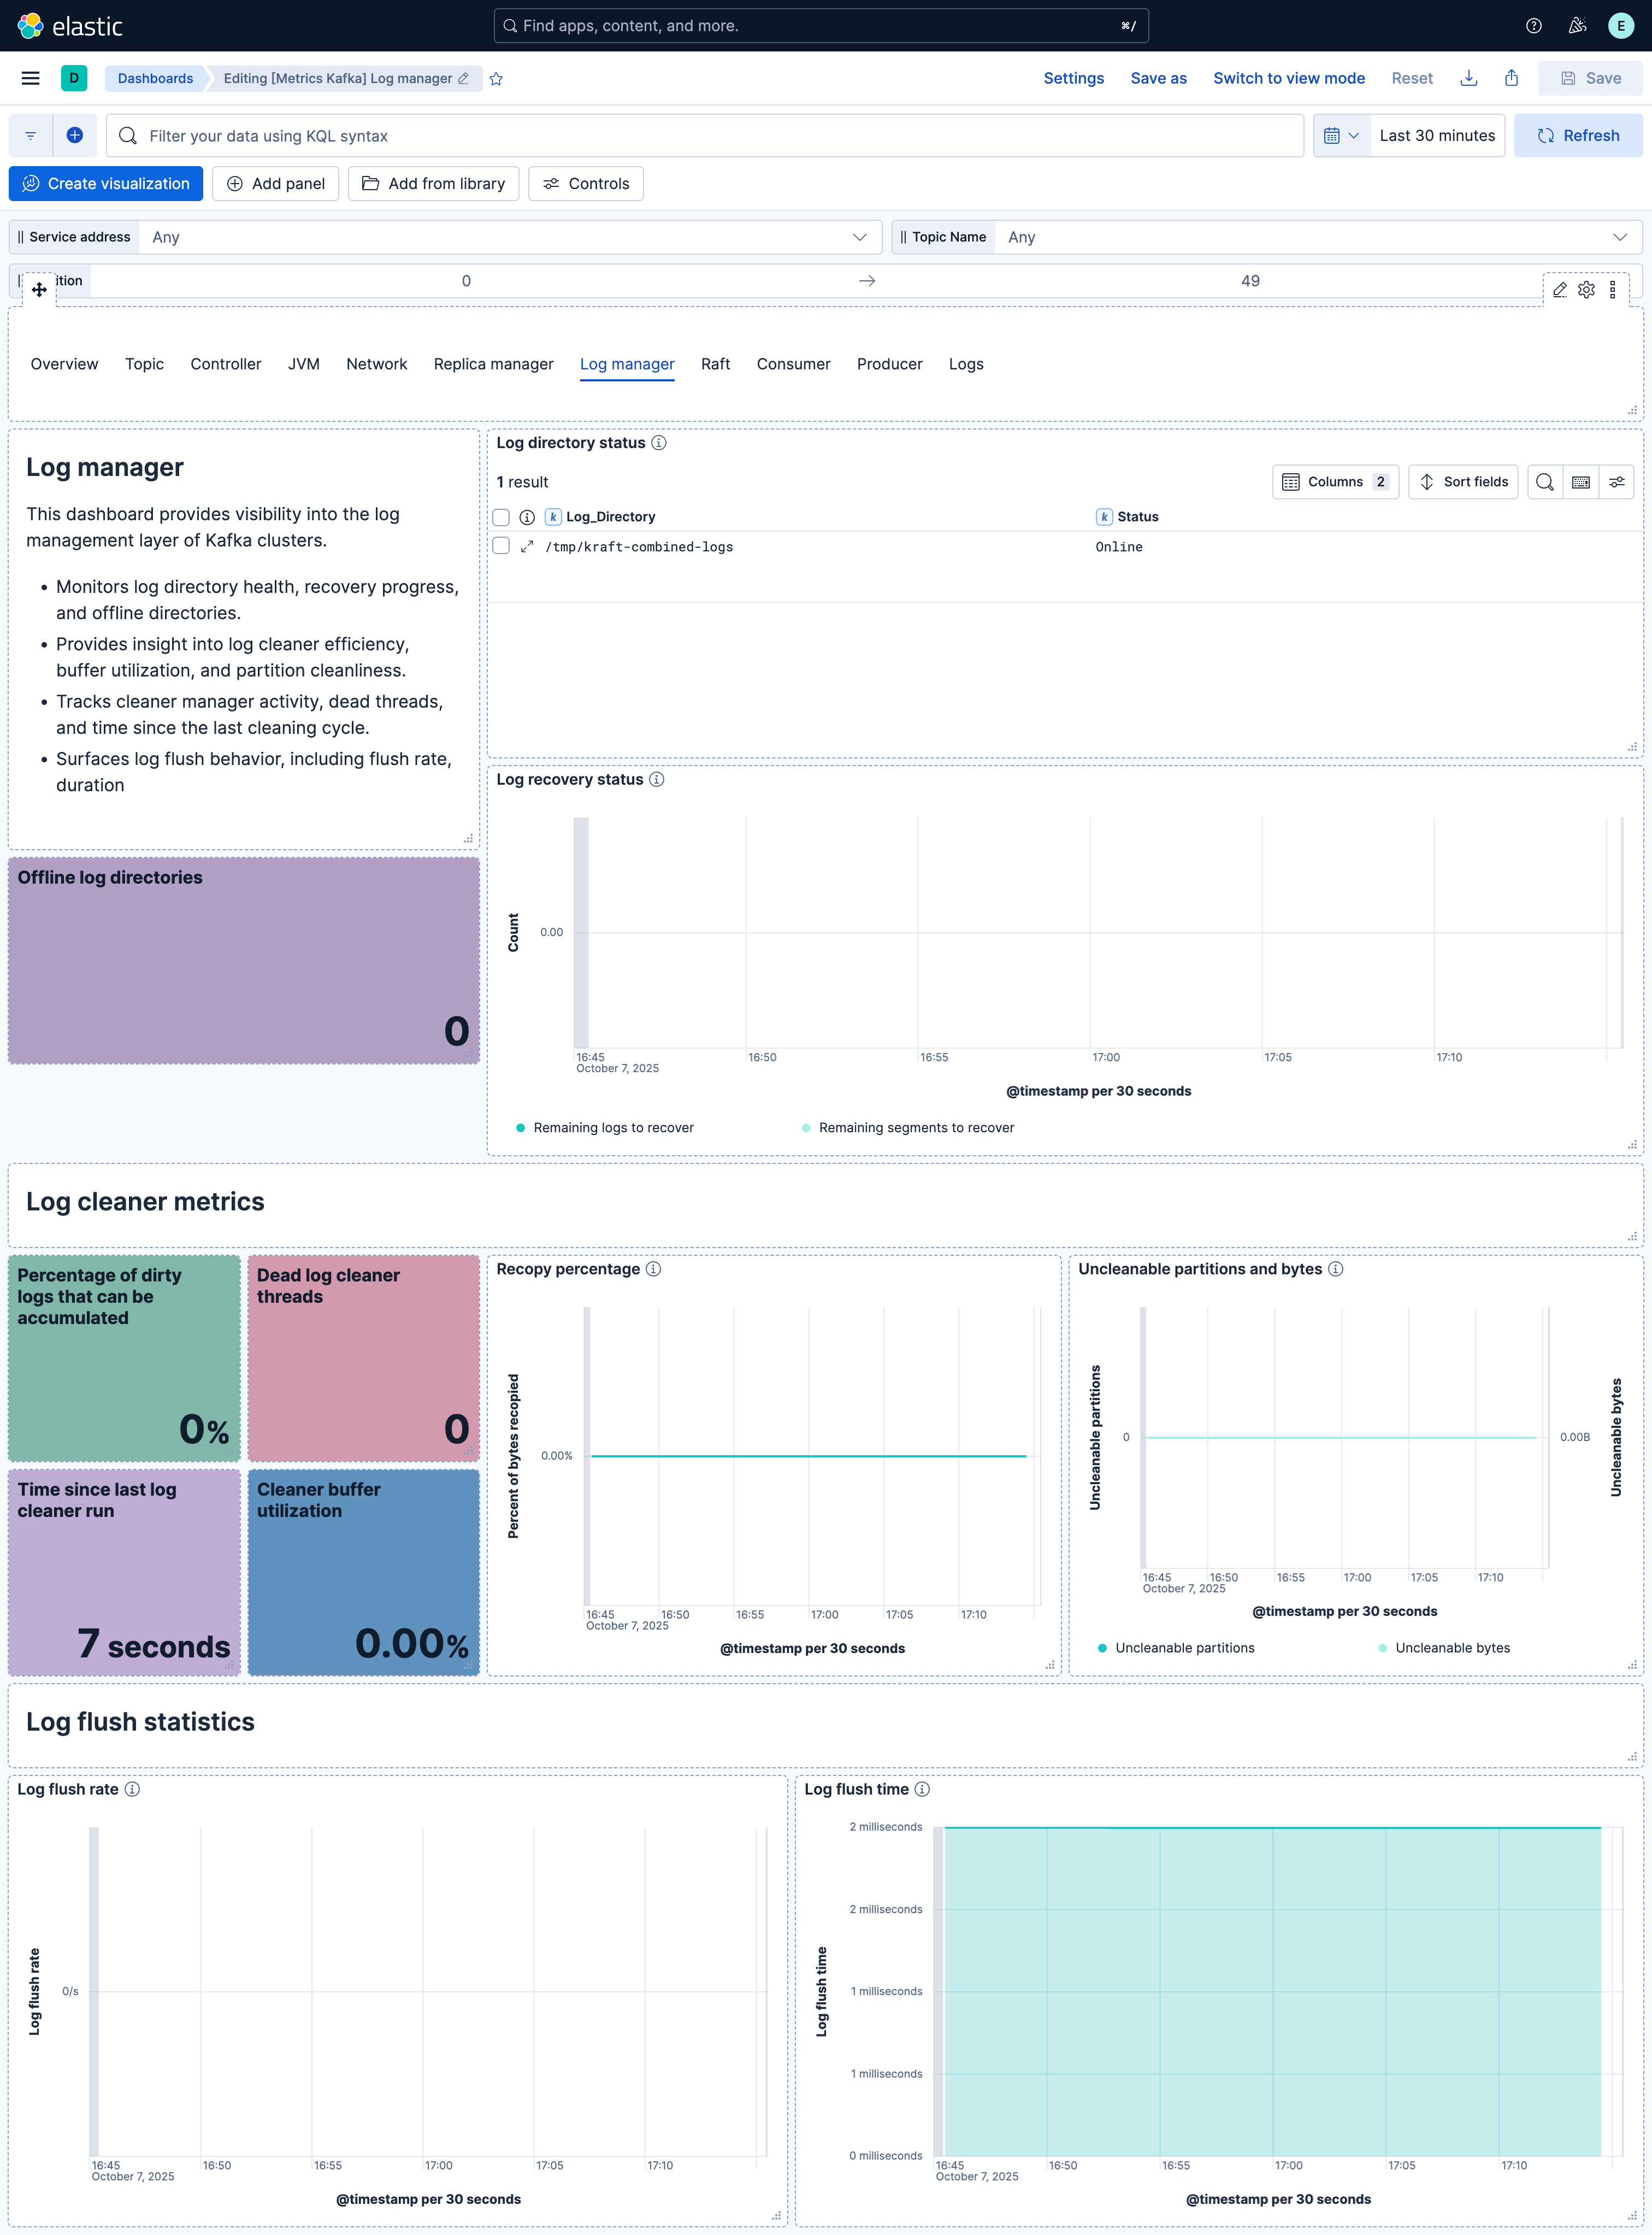
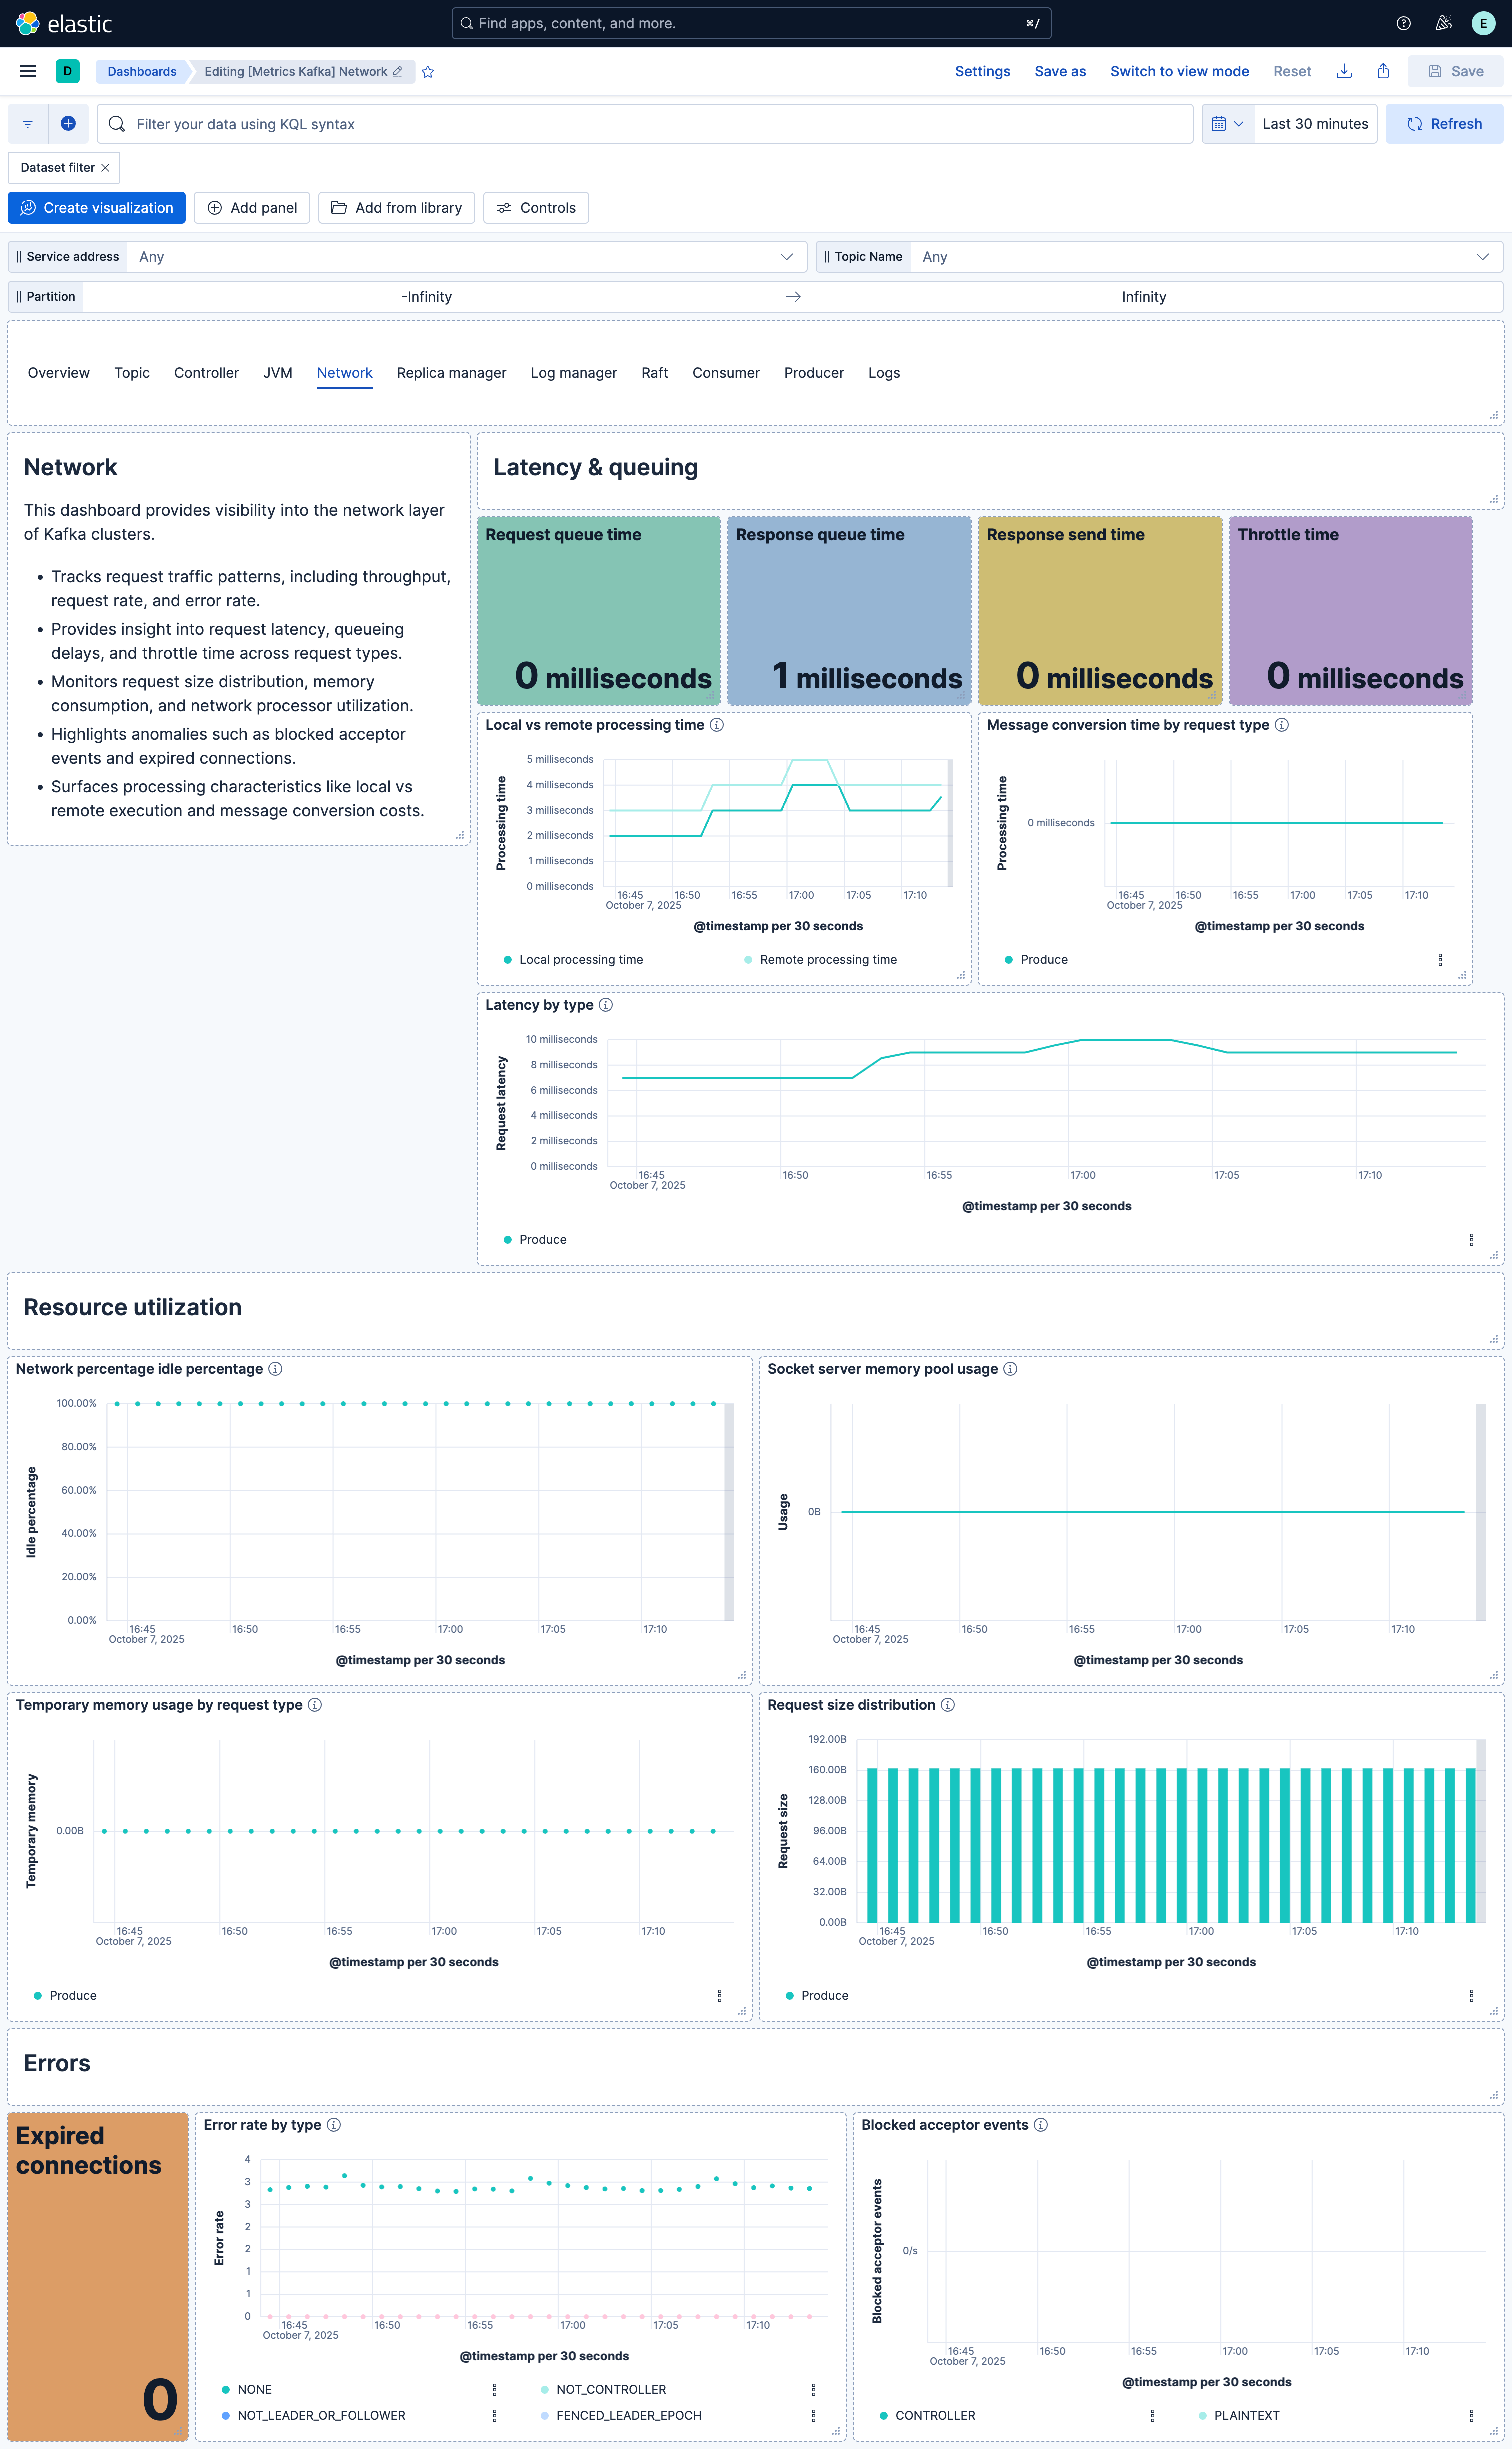
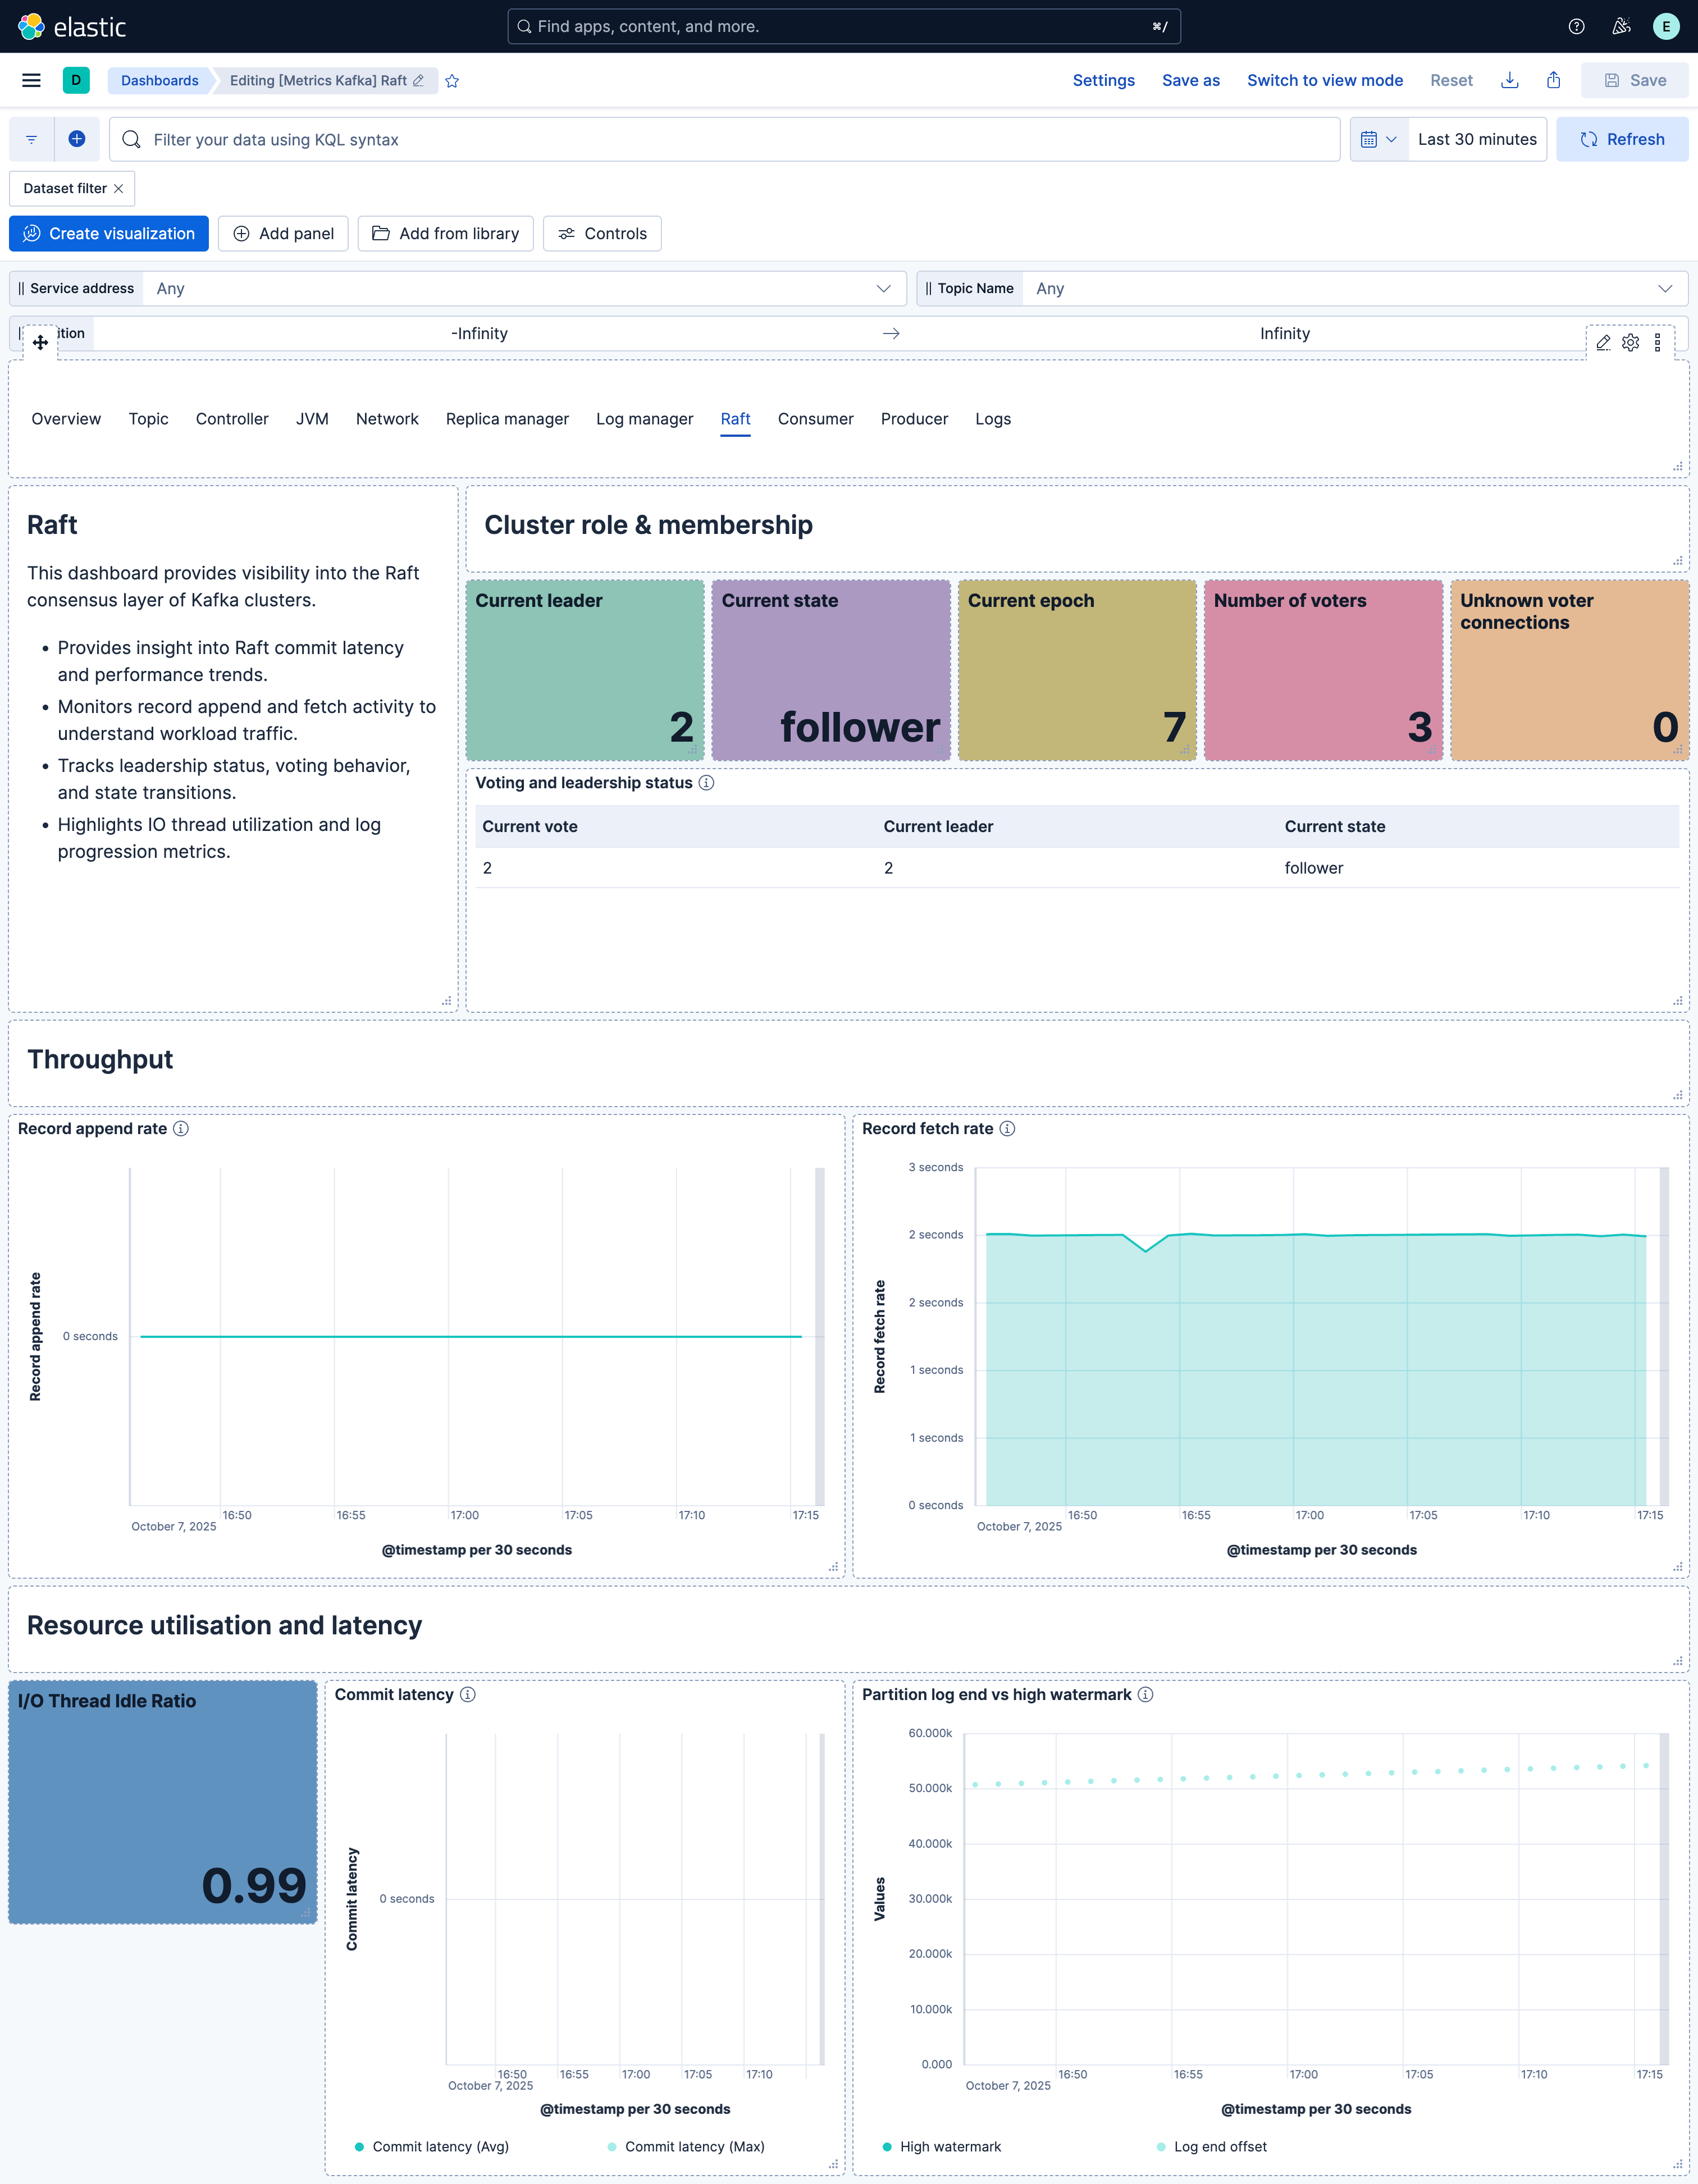
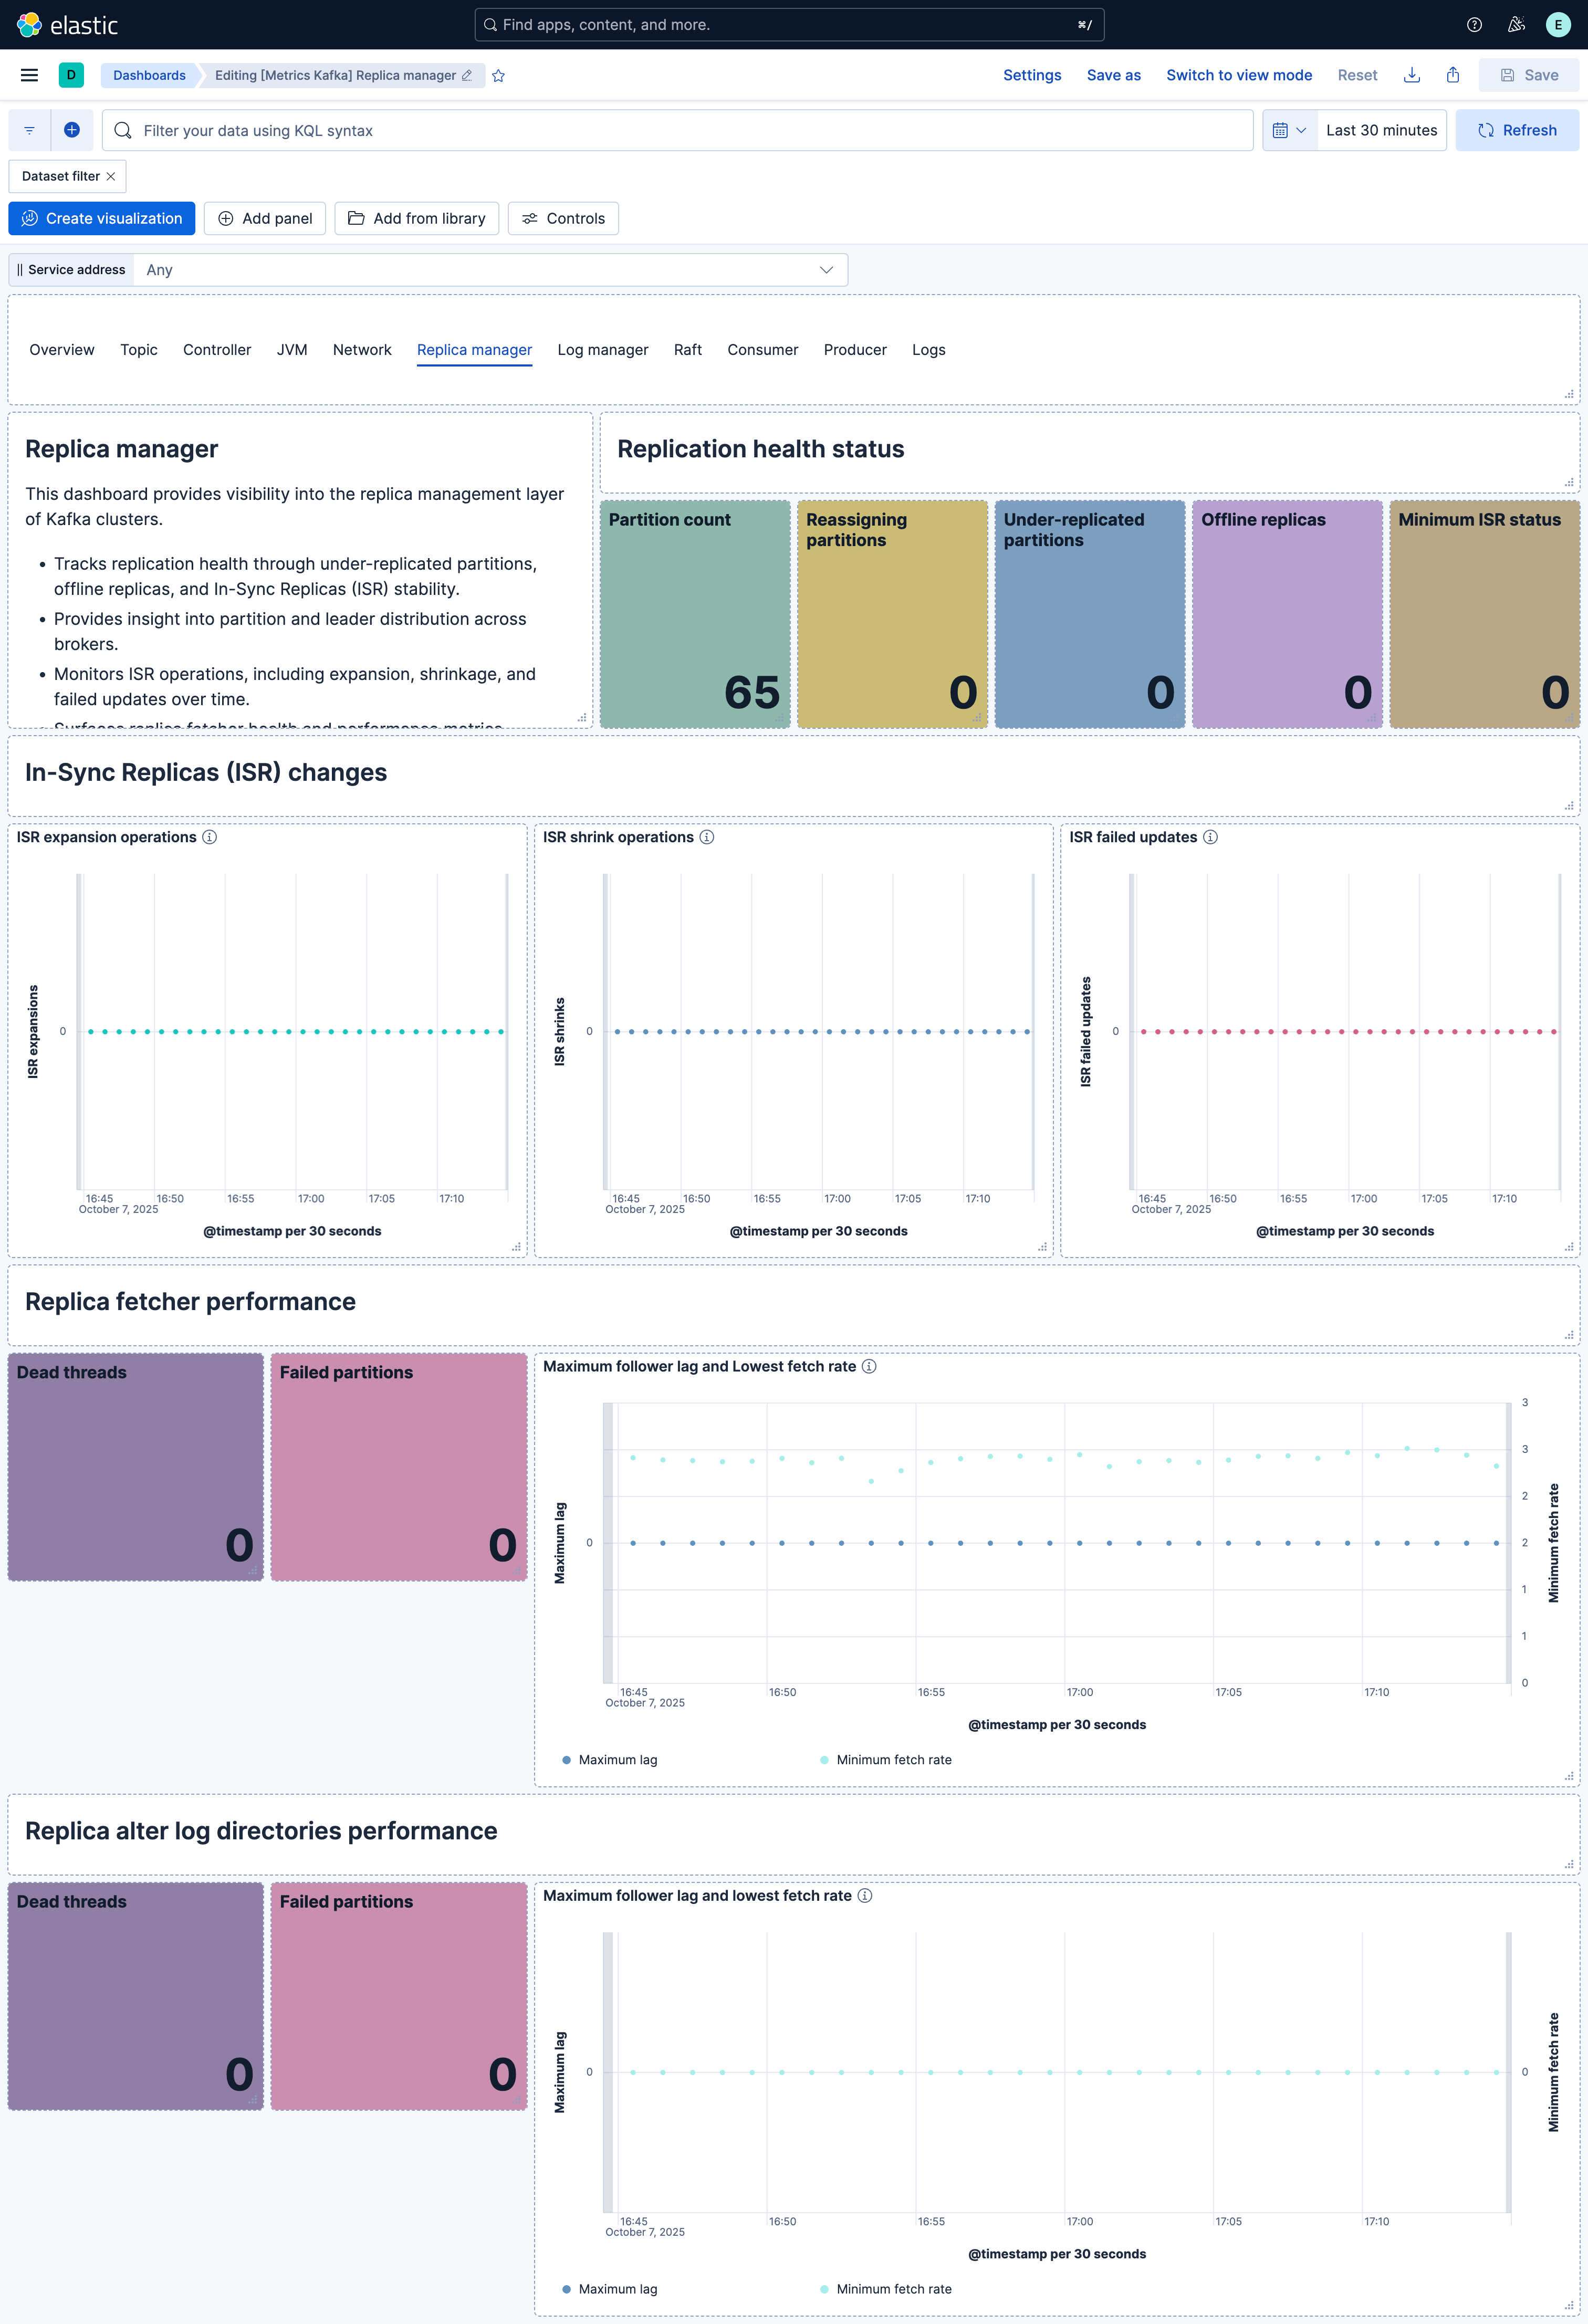
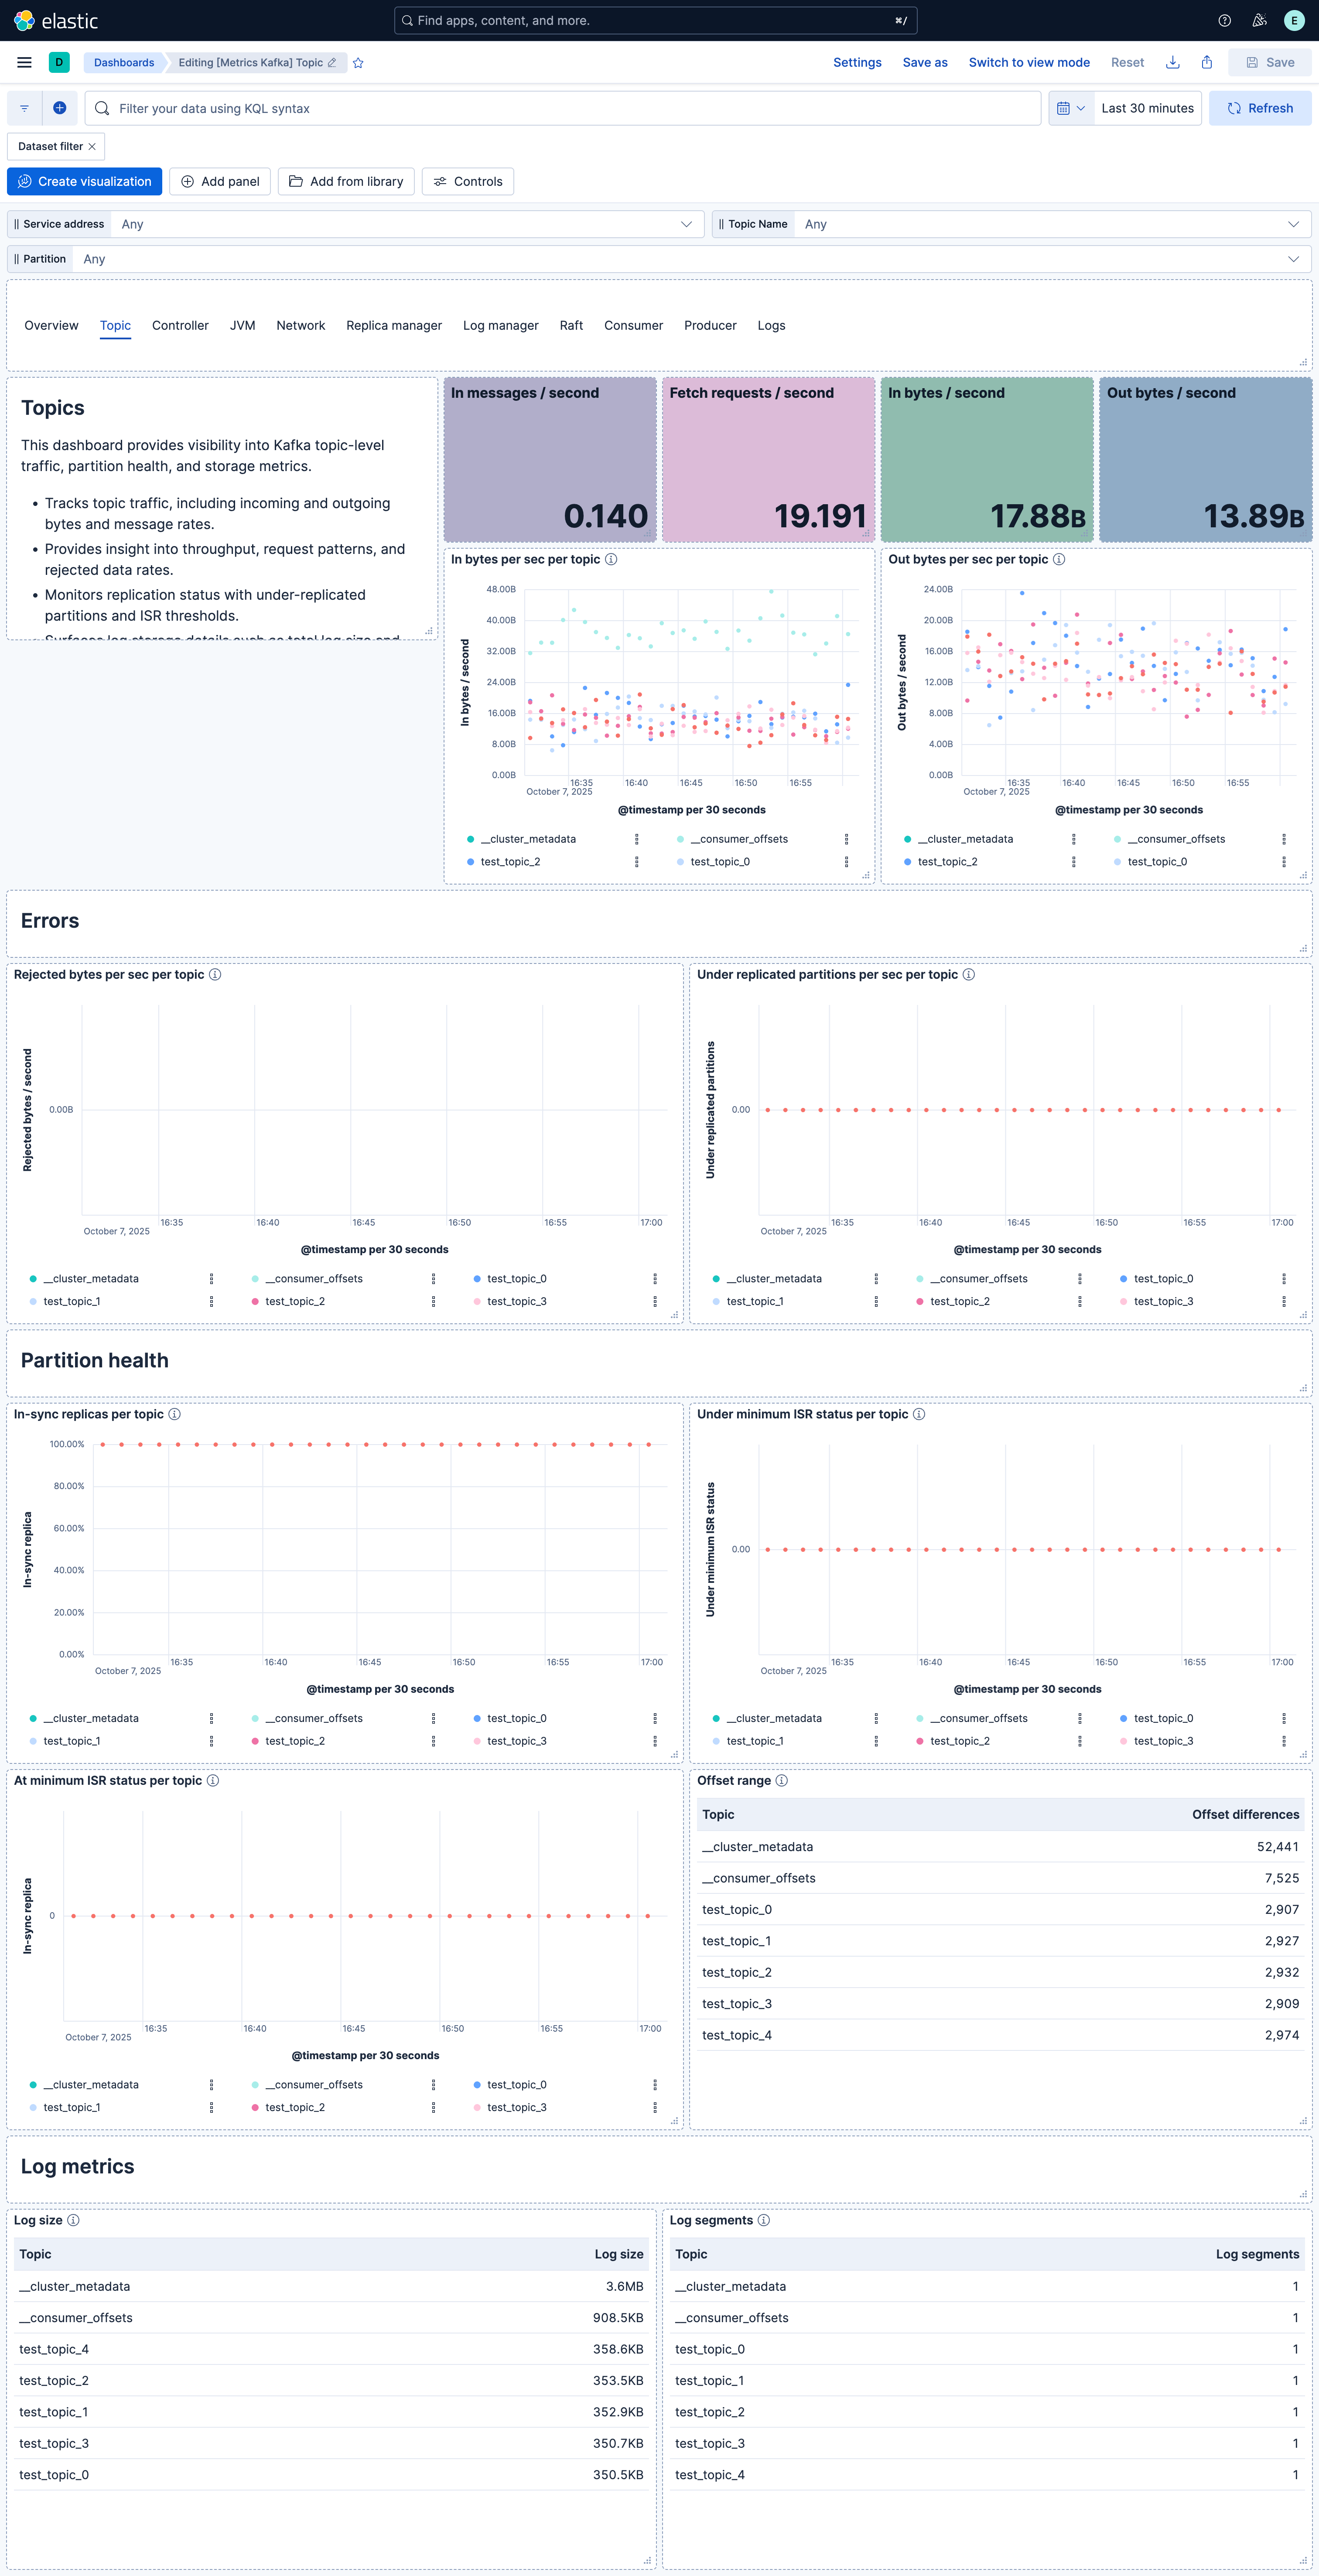
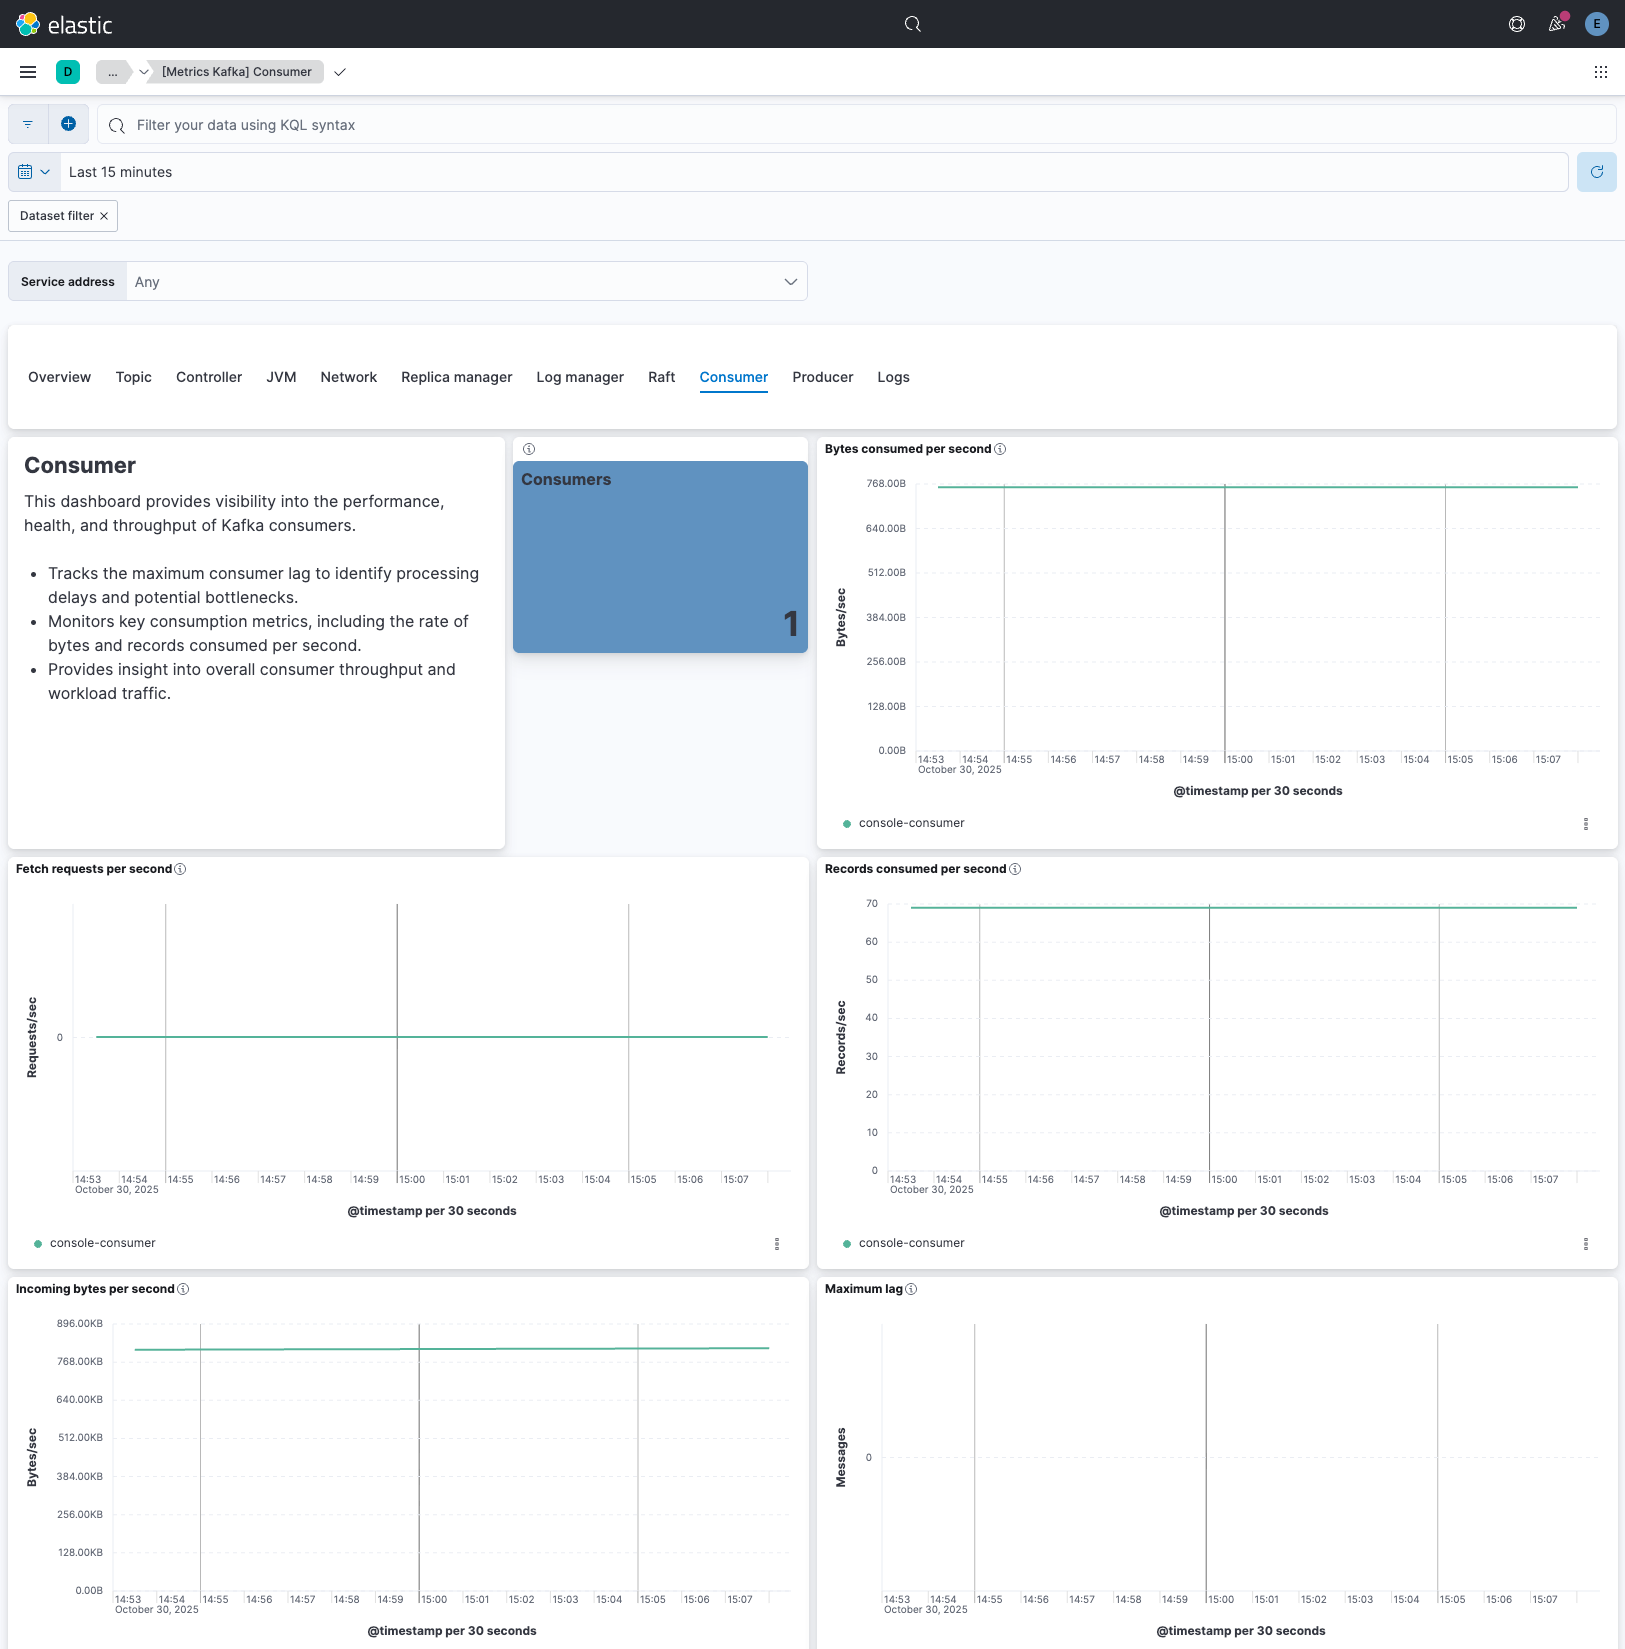
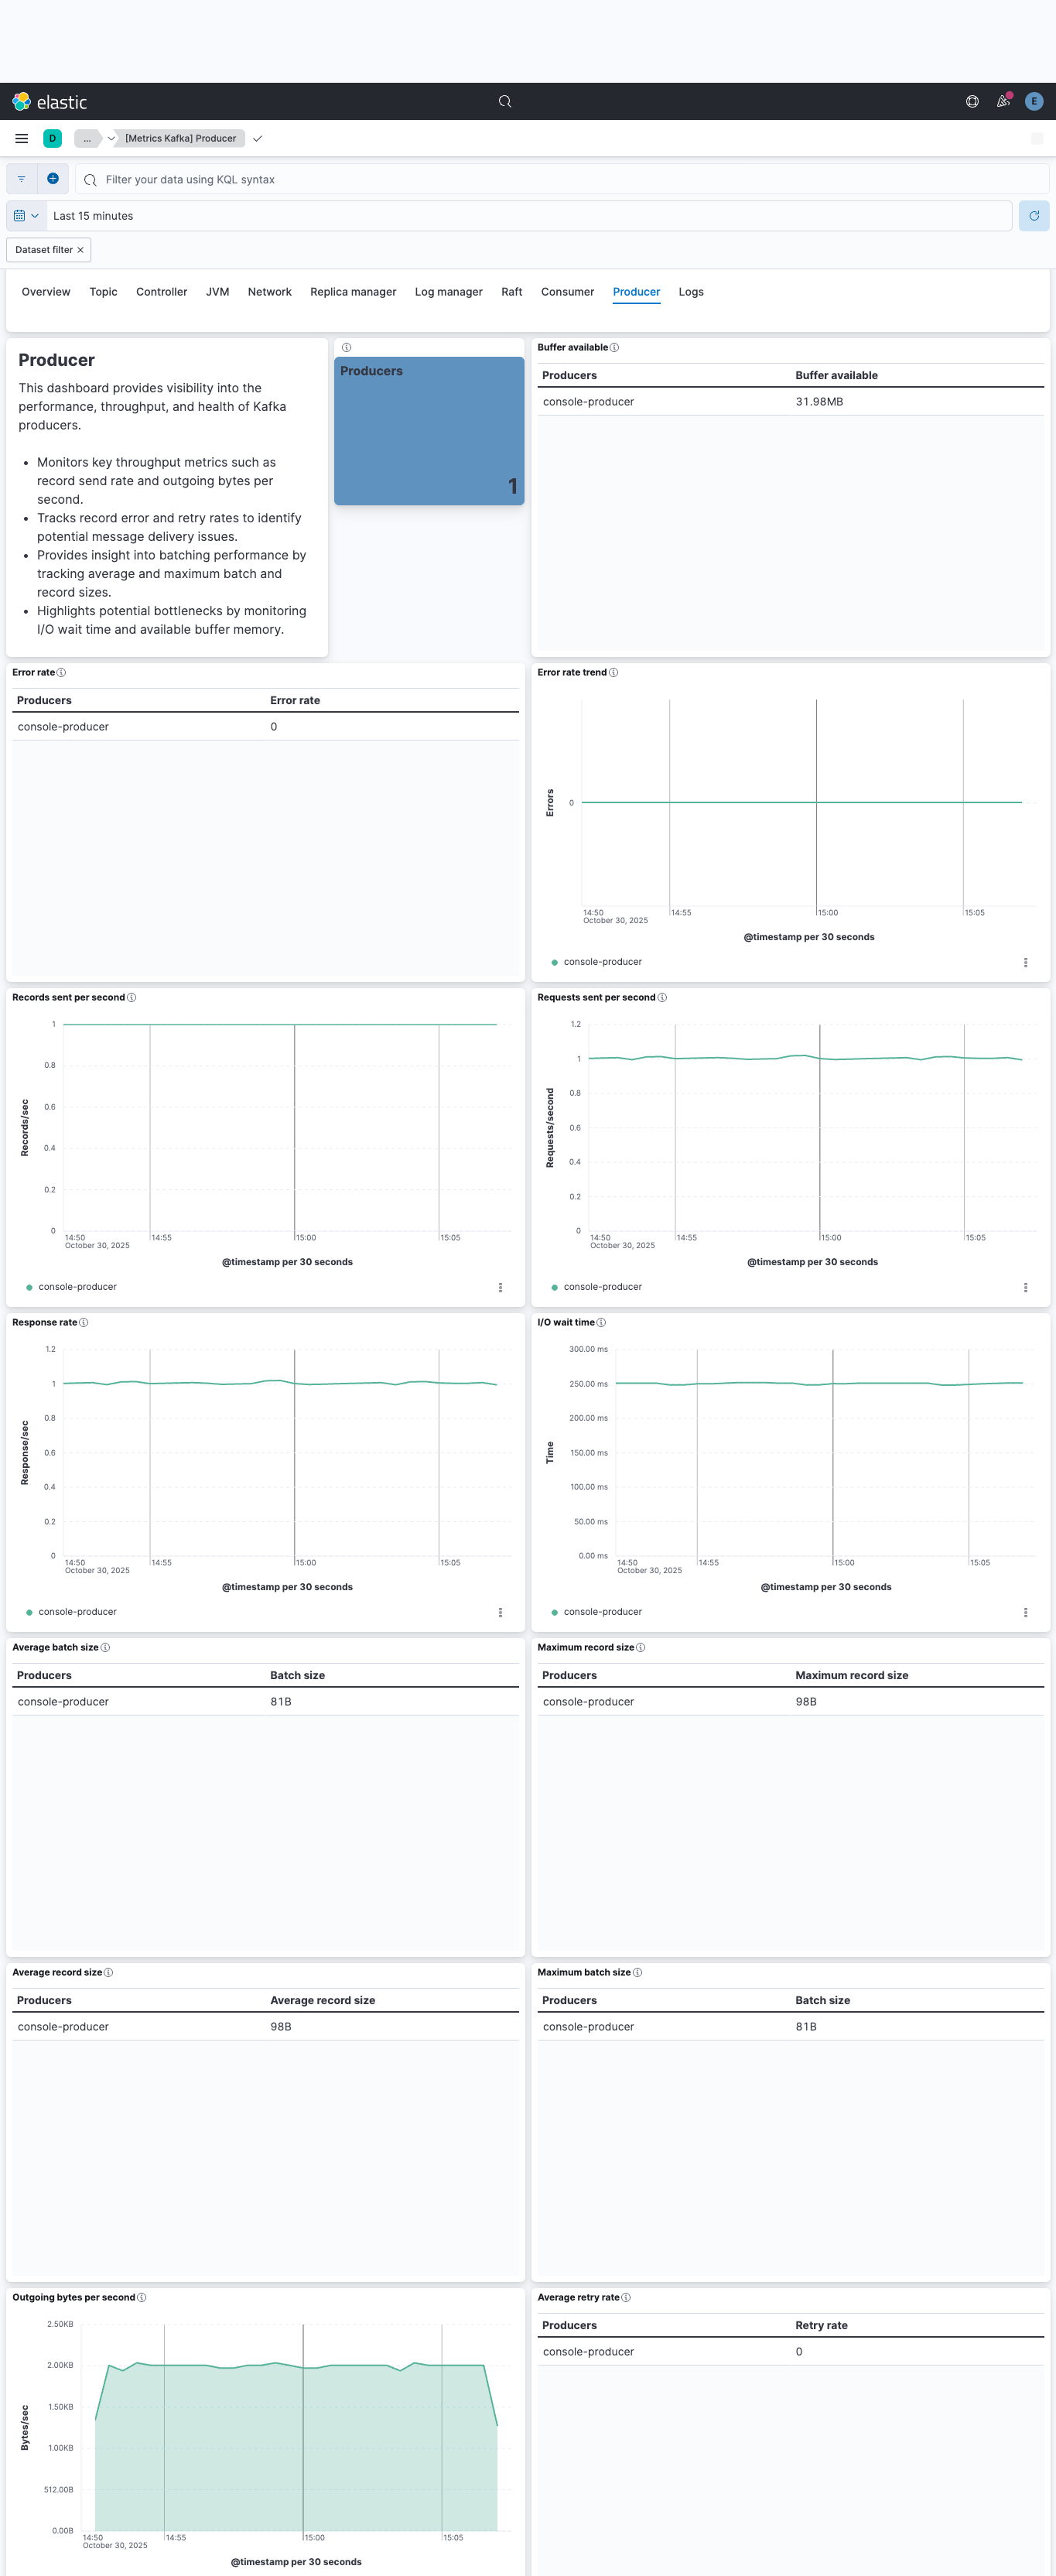
Changelog
| Version | Details | Minimum Kibana version |
|---|---|---|
| 1.27.3 | Bug fix (View pull request) Document the minimum Elastic Agent versions required for Kafka 4.x support. |
9.0.6 8.19.6 |
| 1.27.2 | Enhancement (View pull request) Add group field to package manifest. |
9.0.6 8.19.6 |
| 1.27.1 | Enhancement (View pull request) Update package title and description to improve clarity of use. |
9.0.6 8.19.6 |
| 1.27.0 | Enhancement (View pull request) Introduce Condition option |
9.0.6 8.19.6 |
| 1.26.0 | Enhancement (View pull request) Bump Kibana version, update documentation. |
9.0.6 8.19.6 |
| 1.25.1 | Bug fix (View pull request) Fix issue preventing dashboards from loading in Elasticsearch stack version 8.13.x. |
9.0.0 8.13.0 |
| 1.25.0 | Enhancement (View pull request) Add dashboards for consumer and producer datastreams. |
9.0.0 8.13.0 |
| 1.24.0 | Enhancement (View pull request) Add dashboard for the datasets topic, jvm, controller, network, replica_manager, log_manager and raft. |
9.0.0 8.13.0 |
| 1.23.2 | Enhancement (View pull request) Update documentation to account for newly added datasets. |
9.0.0 8.13.0 |
| 1.23.1 | Enhancement (View pull request) Add system tests for consumer and producer data streams. |
9.0.0 8.13.0 |
| 1.23.0 | Enhancement (View pull request) Add support for producer and consumer data streams. |
9.0.0 8.13.0 |
| 1.22.0 | Enhancement (View pull request) Add system tests to the datasets including controller, jvm, log_manager, network, replica_manager, topic. |
9.0.0 8.13.0 |
| 1.21.1 | Bug fix (View pull request) Remove unused field mappings from the jvm dataset. |
9.0.0 8.13.0 |
| 1.21.0 | Enhancement (View pull request) Add controller, jvm, log_manager, network, replica_manager, topic datasets. |
9.0.0 8.13.0 |
| 1.20.0 | Enhancement (View pull request) Add raft data stream. |
9.0.0 8.13.0 |
| 1.19.0 | Enhancement (View pull request) Allow @custom pipeline access to event.original without setting preserve_original_event. |
9.0.0 8.13.0 |
| 1.18.4 | Bug fix (View pull request) Update supported kafka versions in README. |
9.0.0 8.13.0 |
| 1.18.3 | Bug fix (View pull request) Fix edge-case in parsing failures for certain Kafka authentication logs. |
9.0.0 8.13.0 |
| 1.18.2 | Bug fix (View pull request) Fix parsing failure for certain Kafka authentication logs. |
9.0.0 8.13.0 |
| 1.18.1 | Bug fix (View pull request) Updated SSL description to be uniform and to include links to documentation. |
9.0.0 8.13.0 |
| 1.18.0 | Enhancement (View pull request) Add support for Kibana 9.0.0. |
9.0.0 8.13.0 |
| 1.17.0 | Enhancement (View pull request) Allow the usage of deprecated log input and support for stack 9.0 |
8.13.0 |
| 1.16.0 | Enhancement (View pull request) Add processor support for broker, consumergroup and partition data streams. |
8.13.0 |
| 1.15.0 | Enhancement (View pull request) ECS version updated to 8.11.0. Update the kibana constraint to ^8.13.0. Modified the field definitions to remove ECS fields made redundant by the ecs@mappings component template. |
8.13.0 |
| 1.14.0 | Enhancement (View pull request) Add global filter on data_stream.dataset to improve performance. |
8.12.0 |
| 1.13.0 | Enhancement (View pull request) Enable secrets for sensitive fields. For more details, refer https://www.elastic.co/guide/en/fleet/current/agent-policy.html#agent-policy-secret-values |
8.12.0 |
| 1.12.1 | Bug fix (View pull request) Disable secrets for older stack versions due to errors. |
8.8.0 |
| 1.12.0 | Enhancement (View pull request) Enable 'secret' for the sensitive fields, supported from 8.12. |
8.8.0 |
| 1.11.0 | Enhancement (View pull request) Add missing SSL fields to agent config. |
8.8.0 |
| 1.10.0 | Enhancement (View pull request) Update the package format_version to 3.0.0. |
8.8.0 |
| 1.9.2 | Bug fix (View pull request) Add null check and ignore_missing check to the rename processor |
8.8.0 |
| 1.9.1 | Enhancement (View pull request) Migrate visualizations to lens. |
8.8.0 |
| 1.9.0 | Enhancement (View pull request) Revert changes to permissions to reroute events to logs-- for log datastream |
8.8.0 |
| 1.8.0 | Enhancement (View pull request) Enable time series data streams for the metrics datasets. This dramatically reduces storage for metrics and is expected to progressively improve query performance. For more details, see https://www.elastic.co/guide/en/elasticsearch/reference/current/tsds.html. |
8.8.0 |
| 1.7.0 | Enhancement (View pull request) Add permissions to reroute events to logs-- for log datastream |
8.0.0 7.14.0 |
| 1.6.0 | Enhancement (View pull request) Rename ownership from obs-service-integrations to obs-infraobs-integrations |
8.0.0 7.14.0 |
| 1.5.6 | Enhancement (View pull request) Modifed the dimension field mapping to support public cloud deployment. |
8.0.0 7.14.0 |
| 1.5.5 | Enhancement (View pull request) Add dimension fields for partition datastream. |
8.0.0 7.14.0 |
| 1.5.4 | Enhancement (View pull request) Add dimension mapping for consumergroup datastream. |
8.0.0 7.14.0 |
| 1.5.3 | Enhancement (View pull request) Added dimension fields for broker datastream. |
8.0.0 7.14.0 |
| 1.5.2 | Enhancement (View pull request) Add metric_type mapping for partition datastream. |
8.0.0 7.14.0 |
| 1.5.1 | Enhancement (View pull request) Add metric_type mapping for consumer_group datastream. |
8.0.0 7.14.0 |
| 1.5.0 | Enhancement (View pull request) Add metric_type mapping for broker datastream. |
8.0.0 7.14.0 |
| 1.4.1 | Enhancement (View pull request) Added categories and/or subcategories. |
8.0.0 7.14.0 |
| 1.4.0 | Enhancement (View pull request) Update ECS version to 8.5.1 |
8.0.0 7.14.0 |
| 1.3.1 | Enhancement (View pull request) Update the datashoboard fields |
8.0.0 7.14.0 |
| 1.3.0 | Enhancement (View pull request) Added infrastructure category. |
8.0.0 7.14.0 |
| 1.2.4 | Enhancement (View pull request) Support SASL mechanism |
8.0.0 7.14.0 |
| 1.2.3 | Enhancement (View pull request) Add documentation for multi-fields |
8.0.0 7.14.0 |
| 1.2.2 | Bug fix (View pull request) Pass down the SSL configs. |
8.0.0 7.14.0 |
| 1.2.1 | Bug fix (View pull request) Add missing event.* fields into ecs.yml |
— |
| 1.2.0 | Enhancement (View pull request) Update to ECS 8.0 |
— |
| 1.1.0 | Enhancement (View pull request) Support Kibana 8.0 |
8.0.0 7.14.0 |
| 1.0.0 | Enhancement (View pull request) Release Kafka as GA |
— |
| 0.7.2 | Enhancement (View pull request) Uniform with guidelines |
— |
| 0.7.1 | Bug fix (View pull request) Fix logic that checks for the 'forwarded' tag |
— |
| 0.7.0 | Enhancement (View pull request) Update to ECS 1.12.0 |
— |
| 0.6.2 | Enhancement (View pull request) Convert to generated ECS fields |
— |
| 0.6.1 | Enhancement (View pull request) update to ECS 1.11.0 |
— |
| 0.6.0 | Enhancement (View pull request) Update integration description |
— |
| 0.5.0 | Enhancement (View pull request) Enable ECS dependency Enhancement (View pull request) Set "event.module" and "event.dataset" |
— |
| 0.4.0 | Enhancement (View pull request) Update to ECS 1.10.0 and adding event.original option |
— |
| 0.3.8 | Enhancement (View pull request) Updating package owner |
— |
| 0.3.7 | Bug fix (View pull request) Correct sample event file. |
— |
| 0.1.0 | Enhancement (View pull request) initial release |
— |