Citrix ADC Integration
Elastic Cloud Serverless projects are autoscaled environments, fully managed by Elastic and available on Elastic Cloud. Availability This functionality is generally available and ready for production usage. Elastic Cloud Serverless projects are autoscaled environments, fully managed by Elastic and available on Elastic Cloud. Availability This functionality is generally available and ready for production usage. The Elastic Stack includes Elastic's core products such as Elasticsearch, Kibana, Logstash, and Beats. Availability This functionality is generally available and ready for production usage. Unless stated otherwise on the page, this functionality is available when your Elastic Stack is deployed on Elastic Cloud Hosted, Elastic Cloud Enterprise, Elastic Cloud on Kubernetes, and self-managed environments. This documentation corresponds to the latest patch available for each minor version. If you're not using the latest patch, check the release notes for changes.
Serverless Observability
Generally available
Serverless Security
Generally available
Stack
9.0+
Generally available since 9.0
| Version | 1.22.0 (View all) |
| Subscription level What's this? |
Basic |
| Developed by What's this? |
Elastic |
| Ingestion method(s) | API, File, Network Protocol |
| Minimum Kibana version(s) | 9.0.0 8.13.0 |
The Citrix ADC integration allows you to monitor your Citrix ADC instance. Citrix ADC is an application delivery controller that performs application-specific traffic analysis to intelligently distribute, optimize, and secure Layer 4 - Layer 7 (L4–L7) network traffic for web applications.
The Citrix Web App Firewall prevents security breaches, data loss, and possible unauthorized modifications to websites that access sensitive business or customer information. It does so by filtering both requests and responses, examining them for evidence of malicious activity, and blocking requests that exhibit such activity. Your site is protected not only from common types of attacks, but also from new, as yet unknown attacks. In addition to protecting web servers and websites from unauthorized access, the Web App Firewall protects against vulnerabilities in legacy CGI code or scripts, web frameworks, web server software, and other underlying operating systems.
Use the Citrix ADC integration to:
Collect metrics related to the interface, lbvserver, service, system, vpn and logs. Create visualizations to monitor, measure and analyze the usage trend and key data, and derive business insights. Create alerts to reduce the MTTD and also the MTTR by referencing relevant logs when troubleshooting an issue.
As an example, you can use the data from this integration to understand the load of the virtual servers, client-server connections, requests and responses across the Citrix ADC.
The Citrix ADC integration collects metrics data.
Metrics give you insight into the statistics of the Citrix ADC. Metrics data streams collected by the Citrix ADC integration include interface, lbvserver, service, system and vpn, so that the user could monitor and troubleshoot the performance of the Citrix ADC instances.
Log is used to retrieve Citrix Netscaler logs. See more details in the documentation here.
You can monitor metrics and logs inside the ingested documents for Citrix ADC in the logs-* index pattern from Discover.
This integration has been tested against Citrix ADC v13.0, v13.1 and v14.1.
Elastic Agent must be installed. For more details, check the Elastic Agent installation instructions.
The minimum Kibana version required is 8.12.0.
You need Elasticsearch for storing and searching your data and Kibana for visualizing and managing it. You can use our hosted Elasticsearch Service on Elastic Cloud, which is recommended, or self-manage the Elastic Stack on your own hardware.
To ingest data from Citrix ADC, you must know the host(s) and the administrator credentials for the Citrix ADC instance.
Host Configuration Format: http[s]://<hostname>:<port>
Example Host Configuration: http://example.com:9090
For step-by-step instructions on how to set up an integration, check the quick start.
It is recommended to configure the application firewall to enable CEF-formatted logs.
- Navigate to Security the NetScaler GUI.
- Click Application Firewall node.
- Select Change Engine Settings.
- Enable CEF Logging.
You can use the Citrix WAF GUI to configure syslog servers and WAF message types to be sent to the syslog servers. Refer to How to Send Application Firewall Messages to a Separate Syslog Server and How to Send NetScaler Application Firewall Logs to Syslog Server and NS.log for details.
Using RFC 5424 compliant syslog messages is recommended when using syslog, if supported by NetScaler. Support for RFC 5424 was added in NetScaler 14.1. Refer to Configuring audit log action.
After the integration is successfully configured, click the Assets tab of the Citrix ADC Integration to display a list of available dashboards. The dashboard for your configured datastream should be populated with the required data.
In Kibana navigate to Management > Integrations.
In the search bar, type Citrix ADC.
Select the Citrix ADC integration and add it.
While adding the integration, if you want to collect logs via logfile, keep Collect logs from Citrix ADC via file toggle on and then configure following parameters:
- Paths
or if you want to collect logs via TCP, keep Collect logs from Citrix ADC via TCP toggle on and then configure following parameters:
- Listen Address
- Listen Port
or if you want to collect logs via UDP, keep Collect logs from Citrix ADC via UDP toggle on and and then configure following parameters:
- Listen Address
- Listen Port
Save the integration.
It is possible that for some fields, Citrix ADC sets dummy values. For example, a field cpuusagepcnt is represented by citrix_adc.system.cpu.utilization.pct. cpuusagepcnt is set to 4294967295 for some instances. If you also encounter it for some fields, reach out to the Citrix ADC support team.
If host.ip is shown conflicted under logs-* data view, this issue can be solved by reindexing the Interface, LBVserver, Service, System, and VPN data stream's indices.
This is the interface data stream. The Citrix ADC interfaces are numbered in slot/port notation. In addition to modifying the characteristics of individual interfaces, you can configure virtual LANs to restrict traffic to specific groups of hosts. interface data stream collects metrics related to id, state, inbound packets, outbound packets and received packets.
Example
{
    "@timestamp": "2022-10-07T06:24:46.588Z",
    "agent": {
        "ephemeral_id": "6bbf5dd0-e14b-4006-ac77-ee175a9e81b8",
        "id": "6713ae74-2a36-4e79-bc7b-954d6b48d5bd",
        "name": "docker-fleet-agent",
        "type": "filebeat",
        "version": "8.4.1"
    },
    "citrix_adc": {
        "interface": {
            "disabled": {
                "count": 0
            },
            "link": {
                "down_time": "00:00:11",
                "up_time": "4.06:45:16"
            },
            "mac": {
                "moved": {
                    "count": 0,
                    "rate": 0
                }
            },
            "packets": {
                "inbound": {
                    "dropped": {
                        "count": 2797172,
                        "rate": 32
                    },
                    "dropped_by_hardware": {
                        "count": 0,
                        "rate": 0
                    },
                    "error_free": {
                        "discarded": {
                            "count": 0,
                            "rate": 0
                        }
                    }
                },
                "outbound": {
                    "dropped_by_hardware": {
                        "count": 0,
                        "rate": 0
                    },
                    "error_free": {
                        "discarded": {
                            "count": 0,
                            "rate": 0
                        }
                    }
                },
                "received": {
                    "count": 5396347,
                    "jumbo": {
                        "count": 0,
                        "rate": 0
                    },
                    "multicast": {
                        "count": 278537,
                        "rate": 0
                    },
                    "rate": 38,
                    "tagged": {
                        "count": 0,
                        "rate": 0
                    }
                },
                "transmission": {
                    "dropped": {
                        "count": 0,
                        "rate": 0
                    }
                },
                "transmitted": {
                    "count": 2511171,
                    "jumbo": {
                        "count": 0,
                        "rate": 0
                    },
                    "rate": 5,
                    "tagged": {
                        "count": 0,
                        "rate": 0
                    }
                }
            },
            "received": {
                "bytes": {
                    "rate": 4603,
                    "value": 1103884030
                }
            },
            "stalled": {
                "count": 0
            },
            "state": "UP",
            "transmitted": {
                "bytes": {
                    "rate": 1924,
                    "value": 776571650
                }
            }
        }
    },
    "data_stream": {
        "dataset": "citrix_adc.interface",
        "namespace": "ep",
        "type": "logs"
    },
    "ecs": {
        "version": "8.11.0"
    },
    "elastic_agent": {
        "id": "6713ae74-2a36-4e79-bc7b-954d6b48d5bd",
        "snapshot": false,
        "version": "8.4.1"
    },
    "event": {
        "agent_id_status": "verified",
        "category": [
            "web"
        ],
        "created": "2022-10-07T06:24:46.588Z",
        "dataset": "citrix_adc.interface",
        "ingested": "2022-10-07T06:24:50Z",
        "kind": "event",
        "module": "citrix_adc",
        "original": "{\"curintfstate\":\"UP\",\"curlinkdowntime\":\"00:00:11\",\"curlinkstate\":\"DOWN\",\"curlinkuptime\":\"4.06:45:16\",\"errdroppedrxpkts\":\"2797172\",\"errdroppedrxpktsrate\":32,\"errdroppedtxpkts\":\"0\",\"errdroppedtxpktsrate\":0,\"errifindiscards\":\"0\",\"errifindiscardsrate\":0,\"errlinkhangs\":\"0\",\"errnicmuted\":\"0\",\"errpktrx\":\"0\",\"errpktrxrate\":0,\"errpkttx\":\"0\",\"errpkttxrate\":0,\"id\":\"0/1\",\"interfacealias\":\"\",\"jumbopktsreceived\":\"0\",\"jumbopktsreceivedrate\":0,\"jumbopktstransmitted\":\"0\",\"jumbopktstransmittedrate\":0,\"linkreinits\":\"0\",\"macmovedrate\":0,\"netscalerpktsrate\":6,\"nicerrdisables\":\"0\",\"nicerrifoutdiscards\":\"0\",\"nicerrifoutdiscardsrate\":0,\"nicmulticastpktsrate\":0,\"nicrxstalls\":\"0\",\"nicstsstalls\":\"0\",\"nictotmulticastpkts\":\"278537\",\"nictxstalls\":\"0\",\"rxbytesrate\":4603,\"rxcrcerrors\":\"0\",\"rxcrcerrorsrate\":0,\"rxlacpdu\":\"0\",\"rxlacpdurate\":0,\"rxpktsrate\":38,\"totmacmoved\":\"0\",\"totnetscalerpkts\":\"2493179\",\"totrxbytes\":\"1103884064\",\"totrxpkts\":\"5396347\",\"tottxbytes\":\"776571619\",\"tottxpkts\":\"2511171\",\"trunkpktsreceived\":\"0\",\"trunkpktsreceivedrate\":0,\"trunkpktstransmitted\":\"0\",\"trunkpktstransmittedrate\":0,\"txbytesrate\":1924,\"txlacpdu\":\"0\",\"txlacpdurate\":0,\"txpktsrate\":5}",
        "type": [
            "info"
        ]
    },
    "input": {
        "type": "httpjson"
    },
    "interface": {
        "id": "0/1"
    },
    "tags": [
        "preserve_original_event",
        "citrix_adc-interface",
        "forwarded"
    ]
}
ECS Field Reference
Please refer to the following document for detailed information on ECS fields.
Exported fields
| Field | Description | Type | Unit | Metric Type |
|---|---|---|---|---|
| @timestamp | Event timestamp. | date | ||
| citrix_adc.interface.disabled.count | Number of times the specified interface is disabled by the NetScaler. | double | counter | |
| citrix_adc.interface.link.down_time | Duration for which the link is DOWN. | keyword | ||
| citrix_adc.interface.link.up_time | Duration for which the link is UP. | keyword | ||
| citrix_adc.interface.mac.moved.count | Number of MAC moves between ports. | double | counter | |
| citrix_adc.interface.mac.moved.rate | Rate (/s) counter for totmacmoved. | double | gauge | |
| citrix_adc.interface.packets.inbound.dropped.count | Number of inbound packets dropped by the specified interface. | double | counter | |
| citrix_adc.interface.packets.inbound.dropped.rate | Rate (/s) counter for errdroppedrxpkts. | double | gauge | |
| citrix_adc.interface.packets.inbound.dropped_by_hardware.count | Number of inbound packets dropped by the hardware on a specified interface once the NetScaler appliance starts or the interface statistics are cleared. | double | counter | |
| citrix_adc.interface.packets.inbound.dropped_by_hardware.rate | Rate (/s) counter for errpktrx. | double | gauge | |
| citrix_adc.interface.packets.inbound.error_free.discarded.count | Number of error-free inbound packets discarded by the specified interface due to a lack of resources. | double | counter | |
| citrix_adc.interface.packets.inbound.error_free.discarded.rate | Rate (/s) counter for errifindiscards. | double | gauge | |
| citrix_adc.interface.packets.outbound.dropped_by_hardware.count | Number of outbound packets dropped by the hardware on a specified interface since the NetScaler appliance was started or the interface statistics were cleared. | double | counter | |
| citrix_adc.interface.packets.outbound.dropped_by_hardware.rate | Rate (/s) counter for errpkttx. | double | gauge | |
| citrix_adc.interface.packets.outbound.error_free.discarded.count | Number of error-free outbound packets discarded by the specified interface due to a lack of resources. | double | counter | |
| citrix_adc.interface.packets.outbound.error_free.discarded.rate | Rate (/s) counter for nicerrifoutdiscards. | double | gauge | |
| citrix_adc.interface.packets.received.count | Number of packets received by an interface since the NetScaler appliance was started or the interface statistics were cleared. | double | counter | |
| citrix_adc.interface.packets.received.jumbo.count | Number of Jumbo Packets received on specified interface. | double | counter | |
| citrix_adc.interface.packets.received.jumbo.rate | Rate (/s) counter for jumbopktsreceived. | double | gauge | |
| citrix_adc.interface.packets.received.multicast.count | Number of multicast packets received by the specified interface since the NetScaler appliance was started or the interface statistics were cleared. | double | counter | |
| citrix_adc.interface.packets.received.multicast.rate | Rate (/s) counter for nictotmulticastpkts. | double | gauge | |
| citrix_adc.interface.packets.received.rate | Rate (/s) counter for totrxpkts. | double | gauge | |
| citrix_adc.interface.packets.received.tagged.count | Number of Tagged Packets received on specified Trunk interface through Allowed VLan List. | double | counter | |
| citrix_adc.interface.packets.received.tagged.rate | Rate (/s) counter for trunkpktsreceived. | double | gauge | |
| citrix_adc.interface.packets.transmission.dropped.count | Number of packets dropped in transmission by the specified interface due to one of the following reasons. (1) VLAN mismatch. (2) Oversized packets. (3) Interface congestion. (4) Loopback packets sent on non loopback interface. | double | ||
| citrix_adc.interface.packets.transmission.dropped.rate | Rate (/s) counter for errdroppedtxpkts. | double | ||
| citrix_adc.interface.packets.transmitted.count | Number of packets transmitted by an interface since the NetScaler appliance was started or the interface statistics were cleared. | double | counter | |
| citrix_adc.interface.packets.transmitted.jumbo.count | Number of Jumbo packets transmitted on specified interface by upper layer, with TSO enabled actual trasmission size could be non Jumbo. | double | counter | |
| citrix_adc.interface.packets.transmitted.jumbo.rate | Rate (/s) counter for jumbopktstransmitted. | double | gauge | |
| citrix_adc.interface.packets.transmitted.rate | Rate (/s) counter for tottxpkts. | double | gauge | |
| citrix_adc.interface.packets.transmitted.tagged.count | Number of Tagged Packets transmitted on specified Trunk interface through Allowed VLan List. | double | counter | |
| citrix_adc.interface.packets.transmitted.tagged.rate | Rate (/s) counter for trunkpktstransmitted. | double | gauge | |
| citrix_adc.interface.received.bytes.rate | Rate (/s) counter for totrxbytes. | double | gauge | |
| citrix_adc.interface.received.bytes.value | Number of bytes received by an interface since the NetScaler appliance was started or the interface statistics were cleared. | double | byte | counter |
| citrix_adc.interface.stalled.count | Number of times the interface stalled, when receiving packets, since the NetScaler appliance was started or the interface statistics were cleared. | double | counter | |
| citrix_adc.interface.state | Current state of the specified interface. | keyword | ||
| citrix_adc.interface.transmitted.bytes.rate | Rate (/s) counter for tottxbytes. | double | gauge | |
| citrix_adc.interface.transmitted.bytes.value | Number of bytes transmitted by an interface since the NetScaler appliance was started or the interface statistics were cleared. | double | byte | counter |
| data_stream.dataset | Data stream dataset. | constant_keyword | ||
| data_stream.namespace | Data stream namespace. | constant_keyword | ||
| data_stream.type | Data stream type. | constant_keyword | ||
| input.type | Type of Filebeat input. | keyword | ||
| interface.id | Interface ID as reported by an observer (typically SNMP interface ID). | keyword |
This is the lbvserver data stream. The load balancing server is logically located between the client and the server farm, and manages traffic flow to the servers in the server farm. lbvserver data stream collects metrics related to name, state, client connections, requests and responses.
Example
{
    "@timestamp": "2022-10-07T06:25:28.550Z",
    "agent": {
        "ephemeral_id": "5d00842d-a4ee-4502-9a8c-16100e326dc0",
        "id": "6713ae74-2a36-4e79-bc7b-954d6b48d5bd",
        "name": "docker-fleet-agent",
        "type": "filebeat",
        "version": "8.4.1"
    },
    "citrix_adc": {
        "lbvserver": {
            "client": {
                "connections": {
                    "current": {
                        "count": 8
                    },
                    "established": {
                        "count": 6
                    }
                },
                "response_time": {
                    "application_performance_index": 1
                }
            },
            "connections": {
                "actual": {
                    "count": 8
                }
            },
            "down": {
                "backup": {
                    "hits": 13
                }
            },
            "health": 67,
            "hit": {
                "count": 10,
                "rate": 5
            },
            "name": "elastic",
            "packets": {
                "received": {
                    "count": 7
                },
                "sent": {
                    "count": 8,
                    "rate": 8
                }
            },
            "protocol": "HTTP",
            "request": {
                "deferred": {
                    "count": 13,
                    "rate": 13
                },
                "received": {
                    "bytes": {
                        "rate": 7,
                        "value": 7
                    },
                    "count": 5,
                    "rate": 5
                },
                "surge_queue": {
                    "count": 8
                },
                "waiting": {
                    "count": 6
                }
            },
            "requests_responses": {
                "dropped": {
                    "count": 13
                },
                "invalid": {
                    "count": 13
                }
            },
            "response": {
                "received": {
                    "bytes": {
                        "rate": 7,
                        "value": 7
                    },
                    "count": 5,
                    "rate": 5
                }
            },
            "service": {
                "active": {
                    "count": 10
                },
                "inactive": {
                    "count": 6
                }
            },
            "spillover": {
                "count": 8
            },
            "state": "DOWN",
            "threshold": {
                "spillover": 8
            },
            "time_to_last_byte": {
                "avg": 6
            },
            "transaction": {
                "frustrating": {
                    "count": 1
                },
                "tolerable": {
                    "count": 3
                }
            }
        }
    },
    "data_stream": {
        "dataset": "citrix_adc.lbvserver",
        "namespace": "ep",
        "type": "logs"
    },
    "ecs": {
        "version": "8.11.0"
    },
    "elastic_agent": {
        "id": "6713ae74-2a36-4e79-bc7b-954d6b48d5bd",
        "snapshot": false,
        "version": "8.4.1"
    },
    "event": {
        "agent_id_status": "verified",
        "category": [
            "web"
        ],
        "created": "2022-10-07T06:25:28.550Z",
        "dataset": "citrix_adc.lbvserver",
        "ingested": "2022-10-07T06:25:32Z",
        "kind": "event",
        "module": "citrix_adc",
        "original": "{\"actsvcs\":\"10\",\"avgcltttlb\":\"6\",\"cltresponsetimeapdex\":1,\"cltttlbtransactionsrate\":3,\"cpuusagepm\":\"10\",\"curbackuppersistencesessions\":\"8\",\"curclntconnections\":\"8\",\"curmptcpsessions\":\"13\",\"curpersistencesessions\":\"8\",\"cursrvrconnections\":\"8\",\"cursubflowconn\":\"13\",\"deferredreq\":\"13\",\"deferredreqrate\":13,\"establishedconn\":\"6\",\"frustratingttlbtransactions\":\"1\",\"frustratingttlbtransactionsrate\":1,\"h2requestsrate\":7,\"h2responsesrate\":7,\"hitsrate\":5,\"httpmaxhdrfldlenpkts\":\"3\",\"httpmaxhdrszpkts\":\"3\",\"inactsvcs\":\"6\",\"invalidrequestresponse\":\"13\",\"invalidrequestresponsedropped\":\"13\",\"labelledconn\":\"8\",\"name\":\"elastic\",\"pktsrecvdrate\":8,\"pktssentrate\":8,\"primaryipaddress\":\"8.8.8.8\",\"primaryport\":80,\"pushlabel\":\"8\",\"reqretrycount\":\"3\",\"reqretrycountexceeded\":\"3\",\"requestbytesrate\":7,\"requestsrate\":5,\"responsebytesrate\":7,\"responsesrate\":5,\"sothreshold\":\"8\",\"state\":\"DOWN\",\"surgecount\":\"8\",\"svcsurgecount\":\"8\",\"svrbusyerrrate\":3,\"tcpmaxooopkts\":\"3\",\"toleratingttlbtransactions\":\"3\",\"toleratingttlbtransactionsrate\":1,\"totalconnreassemblyqueue75\":\"13\",\"totalconnreassemblyqueueflush\":\"3\",\"totalh2requests\":\"7\",\"totalh2responses\":\"7\",\"totalpktsrecvd\":\"7\",\"totalpktssent\":\"8\",\"totalrequestbytes\":\"7\",\"totalrequests\":\"5\",\"totalresponsebytes\":\"7\",\"totalresponses\":\"5\",\"totalsvrbusyerr\":\"3\",\"totcltttlbtransactions\":\"3\",\"tothits\":\"10\",\"totspillovers\":\"8\",\"totvserverdownbackuphits\":\"13\",\"type\":\"HTTP\",\"vslbhealth\":\"67\",\"vsvrsurgecount\":\"6\"}",
        "type": [
            "info"
        ]
    },
    "input": {
        "type": "httpjson"
    },
    "related": {
        "ip": [
            "8.8.8.8"
        ]
    },
    "server": {
        "ip": "8.8.8.8",
        "port": 80
    },
    "tags": [
        "preserve_original_event",
        "citrix_adc-lbvserver",
        "forwarded"
    ]
}
ECS Field Reference
Please refer to the following document for detailed information on ECS fields.
Exported fields
| Field | Description | Type | Unit | Metric Type |
|---|---|---|---|---|
| @timestamp | Event timestamp. | date | ||
| citrix_adc.lbvserver.client.connections.current.count | Number of current client connections. | double | gauge | |
| citrix_adc.lbvserver.client.connections.established.count | Number of client connections in ESTABLISHED state. | double | gauge | |
| citrix_adc.lbvserver.client.response_time.application_performance_index | Vserver APDEX (Application Performance Index) index based on client response times. | double | ||
| citrix_adc.lbvserver.connections.actual.count | Number of current connections to the actual servers behind the virtual server. | double | gauge | |
| citrix_adc.lbvserver.down.backup.hits | Number of times traffic was diverted to the backup vserver since the primary vserver was DOWN. | double | counter | |
| citrix_adc.lbvserver.health | Health of the vserver. This gives percentage of UP services bound to the vserver. | double | ||
| citrix_adc.lbvserver.hit.count | Total vserver hits. | double | counter | |
| citrix_adc.lbvserver.hit.rate | Rate (/s) counter for tothits. | double | gauge | |
| citrix_adc.lbvserver.name | Name of the virtual server. | keyword | ||
| citrix_adc.lbvserver.packets.received.count | Total number of packets received by the service or virtual server. | double | counter | |
| citrix_adc.lbvserver.packets.sent.count | Total number of packets sent. | double | counter | |
| citrix_adc.lbvserver.packets.sent.rate | Rate (/s) counter for totalpktssent. | double | gauge | |
| citrix_adc.lbvserver.protocol | Protocol associated with the vserver. | keyword | ||
| citrix_adc.lbvserver.request.deferred.count | Number of deferred requests on specific vserver. | double | counter | |
| citrix_adc.lbvserver.request.deferred.rate | Rate (/s) counter for deferredreq. | double | gauge | |
| citrix_adc.lbvserver.request.received.bytes.rate | Rate (/s) counter for totalrequestbytes. | double | gauge | |
| citrix_adc.lbvserver.request.received.bytes.value | Total number of request bytes received on the service or virtual server. | double | byte | counter |
| citrix_adc.lbvserver.request.received.count | Total number of requests received on the service or virtual server. | double | counter | |
| citrix_adc.lbvserver.request.received.rate | Rate (/s) counter for totalrequests. | double | gauge | |
| citrix_adc.lbvserver.request.surge_queue.count | Number of requests in the surge queue. | double | gauge | |
| citrix_adc.lbvserver.request.waiting.count | Number of requests waiting on specific vserver. | double | gauge | |
| citrix_adc.lbvserver.requests_responses.dropped.count | Number invalid requests/responses dropped on the vserver. | double | counter | |
| citrix_adc.lbvserver.requests_responses.invalid.count | Number invalid requests/responses on the vserver. | double | counter | |
| citrix_adc.lbvserver.response.received.bytes.rate | Rate (/s) counter for totalresponsebytes. | double | gauge | |
| citrix_adc.lbvserver.response.received.bytes.value | Number of response bytes received by the service or virtual server. | double | byte | counter |
| citrix_adc.lbvserver.response.received.count | Number of responses received on the service or virtual server. | double | counter | |
| citrix_adc.lbvserver.response.received.rate | Rate (/s) counter for totalresponses. | double | gauge | |
| citrix_adc.lbvserver.service.active.count | Number of ACTIVE services bound to a vserver. | double | gauge | |
| citrix_adc.lbvserver.service.inactive.count | Number of INACTIVE services bound to a vserver. | double | gauge | |
| citrix_adc.lbvserver.spillover.count | Number of times vserver experienced spill over. | double | counter | |
| citrix_adc.lbvserver.state | Current state of the server. | keyword | ||
| citrix_adc.lbvserver.threshold.spillover | Spill Over Threshold set on the vserver. | double | gauge | |
| citrix_adc.lbvserver.time_to_last_byte.avg | Average TTLB (Time To Last Byte) between the client and the server. | double | gauge | |
| citrix_adc.lbvserver.transaction.frustrating.count | Frustrating transactions based on APDEX (Application Performance Index) threshold. | double | gauge | |
| citrix_adc.lbvserver.transaction.tolerable.count | Tolerable transactions based on APDEX (Application Performance Index) threshold. | double | gauge | |
| data_stream.dataset | Data stream dataset. | constant_keyword | ||
| data_stream.namespace | Data stream namespace. | constant_keyword | ||
| data_stream.type | Data stream type. | constant_keyword | ||
| input.type | Type of Filebeat input. | keyword |
This is the service data stream. With the help of the service endpoint, metrics like throughput, client-server connections, request bytes can be collected along with other statistics for Service resources. service data stream collects metrics related to name, IP address, port, throughput and transactions.
Example
{
    "@timestamp": "2022-10-07T06:26:11.339Z",
    "agent": {
        "ephemeral_id": "2fa2a685-d35a-40a6-8212-7a9dd581d647",
        "id": "6713ae74-2a36-4e79-bc7b-954d6b48d5bd",
        "name": "docker-fleet-agent",
        "type": "filebeat",
        "version": "8.4.1"
    },
    "citrix_adc": {
        "service": {
            "client_connection": {
                "count": 8
            },
            "primary": {
                "ip_address": "127.0.0.1",
                "port": 80
            },
            "request": {
                "bytes": {
                    "rate": 139,
                    "value": 8334520
                },
                "count": 15133,
                "rate": 0
            },
            "response": {
                "bytes": {
                    "rate": 316,
                    "value": 26482988
                },
                "count": 15133,
                "rate": 0
            },
            "reuse_pool": 2,
            "server": {
                "connection": {
                    "count": 2,
                    "established": {
                        "count": 2
                    }
                },
                "time_to_first_byte": {
                    "avg": 34
                }
            },
            "surge_queue": {
                "count": 0
            },
            "throughput": {
                "rate": 0,
                "value": 0
            },
            "transaction": {
                "active": {
                    "count": 0
                },
                "frustrating": {
                    "count": 0
                },
                "time_to_last_byte": {
                    "count": 0
                },
                "tolerable": {
                    "count": 0
                }
            }
        }
    },
    "data_stream": {
        "dataset": "citrix_adc.service",
        "namespace": "ep",
        "type": "logs"
    },
    "ecs": {
        "version": "8.11.0"
    },
    "elastic_agent": {
        "id": "6713ae74-2a36-4e79-bc7b-954d6b48d5bd",
        "snapshot": false,
        "version": "8.4.1"
    },
    "event": {
        "agent_id_status": "verified",
        "category": [
            "web"
        ],
        "created": "2022-10-07T06:26:11.339Z",
        "dataset": "citrix_adc.service",
        "ingested": "2022-10-07T06:26:14Z",
        "kind": "event",
        "module": "citrix_adc",
        "original": "{\"activetransactions\":\"0\",\"avgsvrttfb\":\"34\",\"curclntconnections\":\"8\",\"curload\":\"0\",\"curreusepool\":\"2\",\"cursrvrconnections\":\"2\",\"curtflags\":\"0\",\"frustratingttlbtransactions\":\"0\",\"httpmaxhdrfldlenpkts\":\"0\",\"httpmaxhdrszpkts\":\"0\",\"maxclients\":\"0\",\"name\":\"nshttpd-gui-127.0.0.1-80\",\"primaryipaddress\":\"127.0.0.1\",\"primaryport\":80,\"requestbytesrate\":139,\"requestsrate\":0,\"responsebytesrate\":316,\"responsesrate\":0,\"serviceorder\":\"0\",\"servicetype\":\"HTTP\",\"state\":\"UP\",\"surgecount\":\"0\",\"svrestablishedconn\":\"2\",\"tcpmaxooopkts\":\"0\",\"throughput\":\"0\",\"throughputrate\":0,\"toleratingttlbtransactions\":\"0\",\"totalconnreassemblyqueue75\":\"0\",\"totalconnreassemblyqueueflush\":\"0\",\"totalrequestbytes\":\"8334520\",\"totalrequests\":\"15133\",\"totalresponsebytes\":\"26482988\",\"totalresponses\":\"15133\",\"totsvrttlbtransactions\":\"0\",\"vsvrservicehits\":\"0\",\"vsvrservicehitsrate\":0}",
        "type": [
            "info"
        ]
    },
    "input": {
        "type": "httpjson"
    },
    "related": {
        "ip": [
            "127.0.0.1"
        ]
    },
    "service": {
        "name": "nshttpd-gui-127.0.0.1-80",
        "state": "UP",
        "type": "HTTP"
    },
    "tags": [
        "preserve_original_event",
        "citrix_adc-service",
        "forwarded"
    ]
}
ECS Field Reference
Please refer to the following document for detailed information on ECS fields.
Exported fields
| Field | Description | Type | Unit | Metric Type |
|---|---|---|---|---|
| @timestamp | Event timestamp. | date | ||
| citrix_adc.service.client_connection.count | Number of current client connections. | double | counter | |
| citrix_adc.service.primary.ip_address | The IP address on which specific service is running. | ip | ||
| citrix_adc.service.primary.port | The port on which the service is running. | long | ||
| citrix_adc.service.request.bytes.rate | Rate (/s) counter for totalrequestbytes. | double | gauge | |
| citrix_adc.service.request.bytes.value | Total number of request bytes received on specific service or virtual server. | double | byte | counter |
| citrix_adc.service.request.count | Total number of requests received on specific service or virtual server. | double | counter | |
| citrix_adc.service.request.rate | Rate (/s) counter for totalrequests. | double | gauge | |
| citrix_adc.service.response.bytes.rate | Rate (/s) counter for totalresponsebytes. | double | gauge | |
| citrix_adc.service.response.bytes.value | Number of response bytes received by specific service or virtual server. | double | byte | counter |
| citrix_adc.service.response.count | Number of responses received on specific service or virtual server. | double | counter | |
| citrix_adc.service.response.rate | Rate (/s) counter for totalresponses. | double | gauge | |
| citrix_adc.service.reuse_pool | Number of requests in the idle queue/reuse pool. | double | ||
| citrix_adc.service.server.connection.count | Number of current connections to the actual servers behind the virtual server. | double | counter | |
| citrix_adc.service.server.connection.established.count | Number of server connections in ESTABLISHED state. | double | counter | |
| citrix_adc.service.server.time_to_first_byte.avg | Average TTFB (Time To First Byte) between the NetScaler appliance and the server. | double | gauge | |
| citrix_adc.service.surge_queue.count | Number of requests in the surge queue. | double | counter | |
| citrix_adc.service.throughput.rate | Rate (/s) counter for throughput. | double | gauge | |
| citrix_adc.service.throughput.value | Number of bytes received or sent by specific service (Mbps). | double | counter | |
| citrix_adc.service.transaction.active.count | Number of active transactions handled by specific service. | double | counter | |
| citrix_adc.service.transaction.frustrating.count | Frustrating transactions based on APDEX (Application Performance Index) threshold (>4T). | double | gauge | |
| citrix_adc.service.transaction.time_to_last_byte.count | Total transactions where server TTLB (Time To Last Byte) is calculated. | double | counter | |
| citrix_adc.service.transaction.tolerable.count | Tolerable transactions based on APDEX (Application Performance Index) threshold (>T ;; <4T). | double | counter | |
| data_stream.dataset | Data stream dataset. | constant_keyword | ||
| data_stream.namespace | Data stream namespace. | constant_keyword | ||
| data_stream.type | Data stream type. | constant_keyword | ||
| input.type | Type of Filebeat input. | keyword |
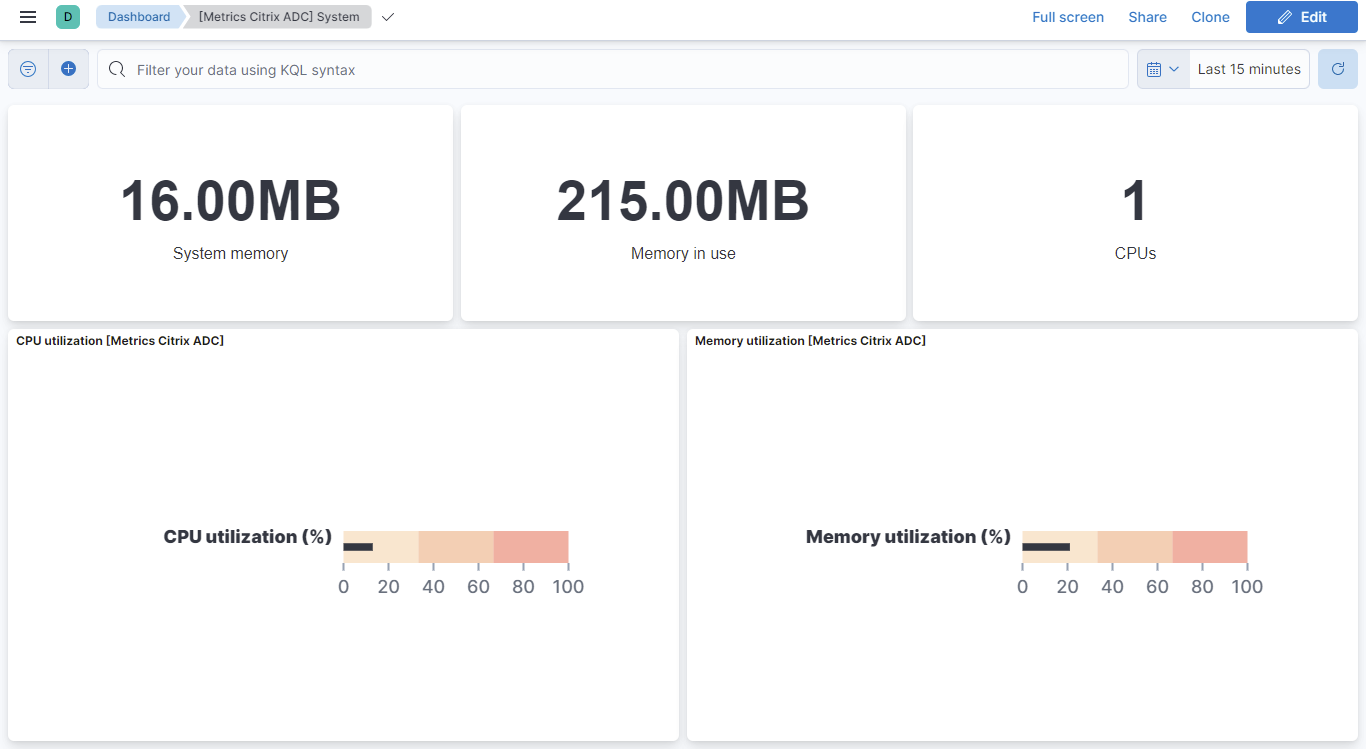
This is the system data stream. With the help of the system endpoint, metrics like memory in use, total system memory, CPU count can be collected along with other statistics for system resources.
Example
{
    "@timestamp": "2022-11-03T11:58:48.678Z",
    "agent": {
        "ephemeral_id": "17888c67-ea5e-4c24-ad2d-6e1572930f9d",
        "id": "f1fb7954-85ee-4fe3-971d-546763d1571b",
        "name": "docker-fleet-agent",
        "type": "filebeat",
        "version": "8.4.1"
    },
    "citrix_adc": {
        "system": {
            "cpu": {
                "count": 1,
                "utilization": {
                    "additional_management": {
                        "pct": 0
                    },
                    "avg": {
                        "pct": 4294967300
                    },
                    "management": {
                        "pct": 0.8
                    },
                    "master": {
                        "pct": 4294967300
                    },
                    "packets": {
                        "pct": 1.1
                    },
                    "pct": 1.1,
                    "slave": {
                        "pct": 4294967300
                    }
                }
            },
            "disk": {
                "usage": {
                    "flash_partition": {
                        "pct": 12
                    },
                    "var_partition": {
                        "pct": 12
                    }
                }
            },
            "memory": {
                "size": {
                    "value": 0
                },
                "usage": {
                    "value": 226492416
                },
                "utilization": {
                    "pct": 21.114572
                }
            },
            "start": {
                "time": "2022-09-22T03:50:13.000Z"
            }
        }
    },
    "data_stream": {
        "dataset": "citrix_adc.system",
        "namespace": "ep",
        "type": "logs"
    },
    "ecs": {
        "version": "8.11.0"
    },
    "elastic_agent": {
        "id": "f1fb7954-85ee-4fe3-971d-546763d1571b",
        "snapshot": false,
        "version": "8.4.1"
    },
    "event": {
        "agent_id_status": "verified",
        "category": [
            "web"
        ],
        "created": "2022-11-03T11:58:48.678Z",
        "dataset": "citrix_adc.system",
        "ingested": "2022-11-03T11:58:52Z",
        "kind": "event",
        "module": "citrix_adc",
        "original": "{\"errorcode\":0,\"message\":\"Done\",\"severity\":\"NONE\",\"system\":{\"addimgmtcpuusagepcnt\":0,\"auxtemp0\":0,\"auxtemp1\":0,\"auxtemp2\":0,\"auxtemp3\":0,\"auxvolt0\":0,\"auxvolt1\":0,\"auxvolt2\":0,\"auxvolt3\":0,\"auxvolt4\":0,\"auxvolt5\":0,\"auxvolt6\":0,\"auxvolt7\":0,\"cpu0temp\":0,\"cpu1temp\":0,\"cpufan0speed\":0,\"cpufan1speed\":0,\"cpuusage\":\"1\",\"cpuusagepcnt\":1.1,\"disk0avail\":1278,\"disk0perusage\":12,\"disk0size\":1585,\"disk0used\":180,\"disk1avail\":11441,\"disk1perusage\":12,\"disk1size\":14179,\"disk1used\":1603,\"fan0speed\":0,\"fan2speed\":0,\"fan3speed\":0,\"fan4speed\":0,\"fan5speed\":0,\"fanspeed\":0,\"internaltemp\":0,\"mastercpuusage\":\"4294967295\",\"memsizemb\":\"0\",\"memusagepcnt\":21.114572,\"memuseinmb\":\"216\",\"mgmtcpu0usagepcnt\":0.8,\"mgmtcpuusagepcnt\":0.8,\"numcpus\":\"1\",\"pktcpuusagepcnt\":1.1,\"powersupply1status\":\"NOT SUPPORTED\",\"powersupply2status\":\"NOT SUPPORTED\",\"powersupply3status\":\"NOT SUPPORTED\",\"powersupply4status\":\"NOT SUPPORTED\",\"rescpuusage\":\"4294967295\",\"rescpuusagepcnt\":4294967295,\"slavecpuusage\":\"4294967295\",\"starttime\":\"Thu Sep 22 03:50:13 2022\",\"starttimelocal\":\"Thu Sep 22 09:20:13 2022\",\"systemfanspeed\":0,\"timesincestart\":\"00:00:00\",\"voltagev12n\":0,\"voltagev12p\":0,\"voltagev33main\":0,\"voltagev33stby\":0,\"voltagev5n\":0,\"voltagev5p\":0,\"voltagev5sb\":0,\"voltagevbat\":0,\"voltagevcc0\":0,\"voltagevcc1\":0,\"voltagevsen2\":0,\"voltagevtt\":0}}",
        "type": [
            "info"
        ]
    },
    "input": {
        "type": "httpjson"
    },
    "tags": [
        "preserve_original_event",
        "citrix_adc-system",
        "forwarded"
    ]
}
ECS Field Reference
Please refer to the following document for detailed information on ECS fields.
Exported fields
| Field | Description | Type | Unit | Metric Type |
|---|---|---|---|---|
| @timestamp | Event timestamp. | date | ||
| citrix_adc.system.cpu.count | The number of CPUs on the NetScaler appliance. | double | gauge | |
| citrix_adc.system.cpu.utilization.additional_management.pct | Additional Management CPU utilization percentage. | double | percent | gauge |
| citrix_adc.system.cpu.utilization.avg.pct | Shows average CPU utilization percentage if more than 1 CPU is present. | double | percent | gauge |
| citrix_adc.system.cpu.utilization.management.pct | Average Management CPU utilization percentage. | double | percent | gauge |
| citrix_adc.system.cpu.utilization.master.pct | CPU 0 (currently the master CPU) utilization, as percentage of capacity. | double | percent | gauge |
| citrix_adc.system.cpu.utilization.packets.pct | Average CPU utilization percentage for all packet engines excluding management PE. | double | percent | gauge |
| citrix_adc.system.cpu.utilization.pct | CPU utilization percentage. | double | percent | gauge |
| citrix_adc.system.cpu.utilization.slave.pct | CPU 1 (currently the slave CPU) utilization, as percentage of capacity. | double | percent | gauge |
| citrix_adc.system.disk.usage.flash_partition.pct | Used space in /flash partition of the disk, as a percentage. | double | percent | gauge |
| citrix_adc.system.disk.usage.var_partition.pct | Used space in /var partition of the disk, as a percentage. | double | percent | gauge |
| citrix_adc.system.memory.size.value | Total amount of system memory, in bytes. | double | byte | gauge |
| citrix_adc.system.memory.usage.value | Main memory currently in use, in bytes. | double | byte | gauge |
| citrix_adc.system.memory.utilization.pct | Percentage of memory utilization on NetScaler. | double | percent | gauge |
| citrix_adc.system.start.time | Time when the NetScaler appliance was last started. | date | ||
| data_stream.dataset | Data stream dataset. | constant_keyword | ||
| data_stream.namespace | Data stream namespace. | constant_keyword | ||
| data_stream.type | Data stream type. | constant_keyword | ||
| input.type | Type of Filebeat input. | keyword |
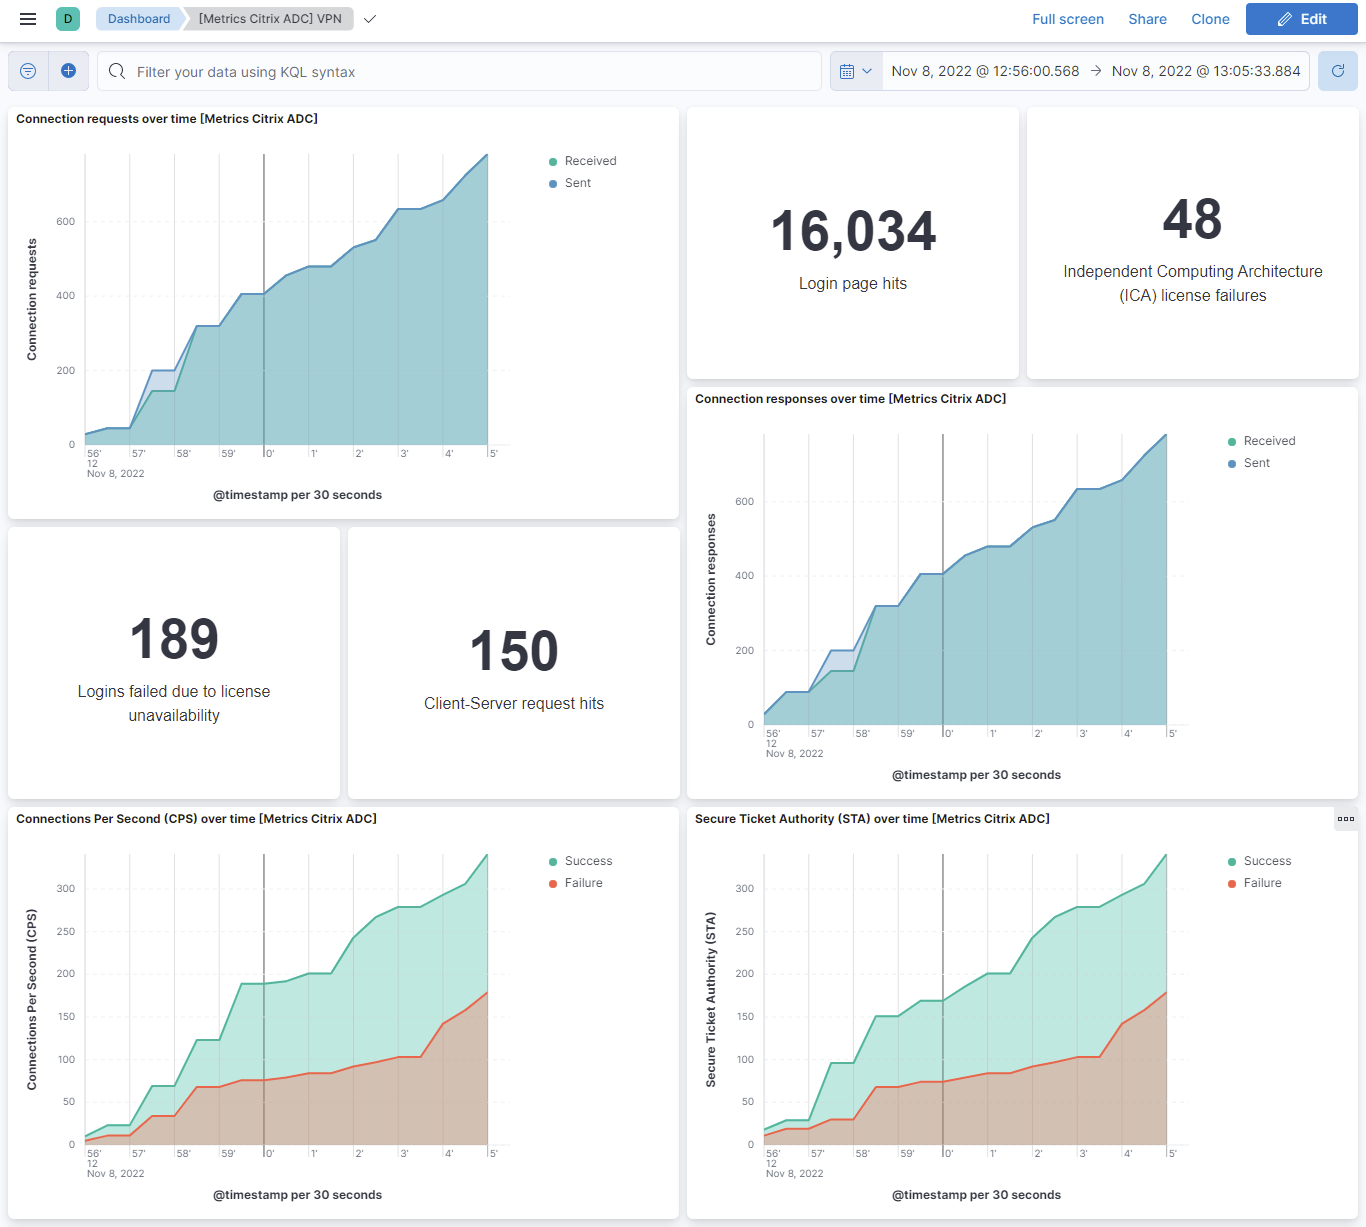
This is the vpn data stream. Citrix VPN is the add-on that provides full Secure Sockets Layer (SSL) virtual private network (VPN) capabilities to Citrix Gateway, allowing users to access remote applications on internal networks securely. vpn data stream collects metrics like CPS, ICA license, client-server requests, file system and sockets.
Example
{
    "@timestamp": "2022-10-10T11:42:13.787Z",
    "agent": {
        "ephemeral_id": "8fd05f47-0933-4b28-8412-6d4b6f365dff",
        "id": "98ae8a23-ea52-4679-b111-33a6d6e8db77",
        "name": "docker-fleet-agent",
        "type": "filebeat",
        "version": "8.4.1"
    },
    "citrix_adc": {
        "vpn": {
            "client_server": {
                "request": {
                    "hit": {
                        "count": 16,
                        "rate": 16
                    }
                }
            },
            "configuration_request_served": {
                "count": 8,
                "rate": 8
            },
            "cps": {
                "failure": {
                    "count": 11,
                    "rate": 11
                },
                "success": {
                    "count": 4,
                    "rate": 11
                }
            },
            "file_system": {
                "request": {
                    "received": {
                        "count": 16,
                        "rate": 16
                    }
                }
            },
            "ica": {
                "license_failure": {
                    "count": 7,
                    "rate": 7
                }
            },
            "login_failed": {
                "license_unavailable": {
                    "count": 16
                }
            },
            "login_page": {
                "hits": 8
            },
            "socks": {
                "client_error": {
                    "count": 8,
                    "rate": 8
                },
                "connection": {
                    "request": {
                        "received": {
                            "count": 3,
                            "rate": 2
                        },
                        "sent": {
                            "count": 2,
                            "rate": 2
                        }
                    },
                    "response": {
                        "received": {
                            "count": 2,
                            "rate": 2
                        },
                        "sent": {
                            "count": 8,
                            "rate": 8
                        }
                    }
                },
                "method": {
                    "request": {
                        "received": {
                            "count": 17,
                            "rate": 17
                        },
                        "sent": {
                            "count": 17,
                            "rate": 17
                        }
                    },
                    "response": {
                        "received": {
                            "count": 3,
                            "rate": 3
                        },
                        "sent": {
                            "count": 3,
                            "rate": 3
                        }
                    }
                },
                "server_error": {
                    "count": 8,
                    "rate": 8
                }
            },
            "sta": {
                "connection": {
                    "failure": {
                        "count": 4,
                        "rate": 4
                    },
                    "success": {
                        "count": 4,
                        "rate": 4
                    }
                },
                "request": {
                    "sent": {
                        "count": 11,
                        "rate": 11
                    }
                },
                "response": {
                    "received": {
                        "count": 7,
                        "rate": 7
                    }
                }
            }
        }
    },
    "data_stream": {
        "dataset": "citrix_adc.vpn",
        "namespace": "ep",
        "type": "logs"
    },
    "ecs": {
        "version": "8.11.0"
    },
    "elastic_agent": {
        "id": "98ae8a23-ea52-4679-b111-33a6d6e8db77",
        "snapshot": false,
        "version": "8.4.1"
    },
    "event": {
        "agent_id_status": "verified",
        "category": [
            "web"
        ],
        "created": "2022-10-10T11:42:13.787Z",
        "dataset": "citrix_adc.vpn",
        "ingested": "2022-10-10T11:42:17Z",
        "kind": "event",
        "module": "citrix_adc",
        "original": "{\"errorcode\":0,\"message\":\"Done\",\"severity\":\"NONE\",\"vpn\":{\"cfghtmlserved\":\"8\",\"cfghtmlservedrate\":8,\"cpsconnfailure\":\"11\",\"cpsconnfailurerate\":11,\"cpsconnsuccess\":\"4\",\"cpsconnsuccessrate\":11,\"csconnsuccrate\":16,\"csgconnectedusersrate\":17,\"csgptktvalidatenotstarted\":\"5\",\"csgptktvalidatenotstartedrate\":5,\"csgrtktvalidatenotstarted\":\"9\",\"csgrtktvalidatenotstartedrate\":9,\"csgtotalconnectedusers\":\"9\",\"cshttpprobehit\":\"16\",\"cshttpprobehitrate\":16,\"csnonhttpprobehit\":\"16\",\"csnonhttpprobehitrate\":16,\"csrequesthit\":\"16\",\"csrequesthitrate\":16,\"dnsreqhit\":\"8\",\"dnsreqhitrate\":8,\"fsrequestrate\":16,\"icalicensefailure\":\"7\",\"icalicensefailurerate\":7,\"iipdisabledmipdisabled\":\"9\",\"iipdisabledmipdisabledrate\":9,\"iipdisabledmipused\":\"16\",\"iipdisabledmipusedrate\":12,\"iipfailedmipdisabled\":\"9\",\"iipfailedmipdisabledrate\":9,\"iipfailedmipused\":\"12\",\"iipfailedmipusedrate\":12,\"iipspillovermipused\":\"12\",\"iipspillovermipusedrate\":12,\"indexhtmlhit\":\"8\",\"indexhtmlnoserved\":\"8\",\"socksclienterror\":\"8\",\"socksclienterrorrate\":8,\"socksconnreqrcvd\":\"3\",\"socksconnreqrcvdrate\":2,\"socksconnreqsent\":\"2\",\"socksconnreqsentrate\":2,\"socksconnresprcvd\":\"2\",\"socksconnresprcvdrate\":2,\"socksconnrespsent\":\"8\",\"socksconnrespsentrate\":8,\"socksmethreqrcvd\":\"17\",\"socksmethreqrcvdrate\":17,\"socksmethreqsent\":\"17\",\"socksmethreqsentrate\":17,\"socksmethresprcvd\":\"3\",\"socksmethresprcvdrate\":3,\"socksmethrespsent\":\"3\",\"socksmethrespsentrate\":3,\"socksservererror\":\"8\",\"socksservererrorrate\":8,\"staconnfailure\":\"4\",\"staconnfailurerate\":4,\"staconnsuccess\":\"4\",\"staconnsuccessrate\":4,\"stamonfail\":\"5\",\"stamonfailrate\":5,\"stamonrcvd\":\"7\",\"stamonrcvdrate\":5,\"stamonsent\":\"7\",\"stamonsentrate\":7,\"stamonsucc\":\"5\",\"stamonsuccrate\":5,\"starequestsent\":\"11\",\"starequestsentrate\":11,\"staresponserecvd\":\"7\",\"staresponserecvdrate\":7,\"totalcsconnsucc\":\"16\",\"totalfsrequest\":\"16\",\"vpnlicensefail\":\"16\",\"winsrequesthit\":\"16\",\"winsrequesthitrate\":16}}",
        "type": [
            "info"
        ]
    },
    "input": {
        "type": "httpjson"
    },
    "tags": [
        "preserve_original_event",
        "citrix_adc-vpn",
        "forwarded"
    ]
}
ECS Field Reference
Check this reference document for more information on ECS fields.
Exported fields
| Field | Description | Type | Metric Type |
|---|---|---|---|
| @timestamp | Event timestamp. | date | |
| citrix_adc.vpn.client_server.request.hit.count | Number of SSL VPN tunnels formed between VPN server and client. | double | gauge |
| citrix_adc.vpn.client_server.request.hit.rate | Rate (/s) counter for cpsconnsuccess. | double | gauge |
| citrix_adc.vpn.configuration_request_served.count | Number of client configuration requests received by VPN server. | double | gauge |
| citrix_adc.vpn.configuration_request_served.rate | Rate (/s) counter for cfghtmlserved. | double | gauge |
| citrix_adc.vpn.cps.failure.count | Number of CPS connection failures. | double | counter |
| citrix_adc.vpn.cps.failure.rate | Rate (/s) counter for cpsconnfailure. | double | gauge |
| citrix_adc.vpn.cps.success.count | Number of CPS connection success. | double | counter |
| citrix_adc.vpn.cps.success.rate | Rate (/s) counter for cpsconnsuccess. | double | gauge |
| citrix_adc.vpn.file_system.request.received.count | Number of file system requests received by VPN server. | double | counter |
| citrix_adc.vpn.file_system.request.received.rate | Rate (/s) counter for totalfsrequest. | double | gauge |
| citrix_adc.vpn.ica.license_failure.count | Number of ICA (Independent Computing Architecture) license failures. | double | counter |
| citrix_adc.vpn.ica.license_failure.rate | Rate (/s) counter for icalicensefailure. | double | gauge |
| citrix_adc.vpn.login_failed.license_unavailable.count | Number of users not able to login because of license unavailability. | double | counter |
| citrix_adc.vpn.login_page.hits | Number of requests for VPN login page. | double | counter |
| citrix_adc.vpn.socks.client_error.count | Number of SOCKS client errors. | double | counter |
| citrix_adc.vpn.socks.client_error.rate | Rate (/s) counter for socksclienterror. | double | gauge |
| citrix_adc.vpn.socks.connection.request.received.count | Number of received SOCKS connect requests. | double | counter |
| citrix_adc.vpn.socks.connection.request.received.rate | Rate (/s) counter for socksconnreqrcvd. | double | gauge |
| citrix_adc.vpn.socks.connection.request.sent.count | Number of sent SOCKS connect requests. | double | counter |
| citrix_adc.vpn.socks.connection.request.sent.rate | Rate (/s) counter for socksconnreqsent. | double | gauge |
| citrix_adc.vpn.socks.connection.response.received.count | Number of received SOCKS connect responses. | double | counter |
| citrix_adc.vpn.socks.connection.response.received.rate | Rate (/s) counter for socksconnresprcvd. | double | gauge |
| citrix_adc.vpn.socks.connection.response.sent.count | Number of sent SOCKS connect responses. | double | counter |
| citrix_adc.vpn.socks.connection.response.sent.rate | Rate (/s) counter for socksconnrespsent. | double | gauge |
| citrix_adc.vpn.socks.method.request.received.count | Number of received SOCKS method requests. | double | counter |
| citrix_adc.vpn.socks.method.request.received.rate | Rate (/s) counter for socksmethreqrcvd. | double | gauge |
| citrix_adc.vpn.socks.method.request.sent.count | Number of sent SOCKS method requests. | double | counter |
| citrix_adc.vpn.socks.method.request.sent.rate | Rate (/s) counter for socksmethreqsent. | double | gauge |
| citrix_adc.vpn.socks.method.response.received.count | Number of received SOCKS method responses. | double | counter |
| citrix_adc.vpn.socks.method.response.received.rate | Rate (/s) counter for socksmethresprcvd. | double | gauge |
| citrix_adc.vpn.socks.method.response.sent.count | Number of sent SOCKS method responses. | double | counter |
| citrix_adc.vpn.socks.method.response.sent.rate | Rate (/s) counter for socksmethrespsent. | double | gauge |
| citrix_adc.vpn.socks.server_error.count | Number of SOCKS server errors. | double | counter |
| citrix_adc.vpn.socks.server_error.rate | Rate (/s) counter for socksservererror. | double | gauge |
| citrix_adc.vpn.sta.connection.failure.count | Number of STA (Secure Ticket Authority) connection failures. | double | counter |
| citrix_adc.vpn.sta.connection.failure.rate | Rate (/s) counter for staconnfailure. | double | gauge |
| citrix_adc.vpn.sta.connection.success.count | Number of STA (Secure Ticket Authority) connection success. | double | counter |
| citrix_adc.vpn.sta.connection.success.rate | Rate (/s) counter for staconnsuccess. | double | gauge |
| citrix_adc.vpn.sta.request.sent.count | Number of STA (Secure Ticket Authority) requests sent. | double | counter |
| citrix_adc.vpn.sta.request.sent.rate | Rate (/s) counter for starequestsent. | double | gauge |
| citrix_adc.vpn.sta.response.received.count | Number of STA (Secure Ticket Authority) responses received. | double | counter |
| citrix_adc.vpn.sta.response.received.rate | Rate (/s) counter for staresponserecvd. | double | gauge |
| data_stream.dataset | Data stream dataset. | constant_keyword | |
| data_stream.namespace | Data stream namespace. | constant_keyword | |
| data_stream.type | Data stream type. | constant_keyword | |
| input.type | Type of Filebeat input. | keyword |
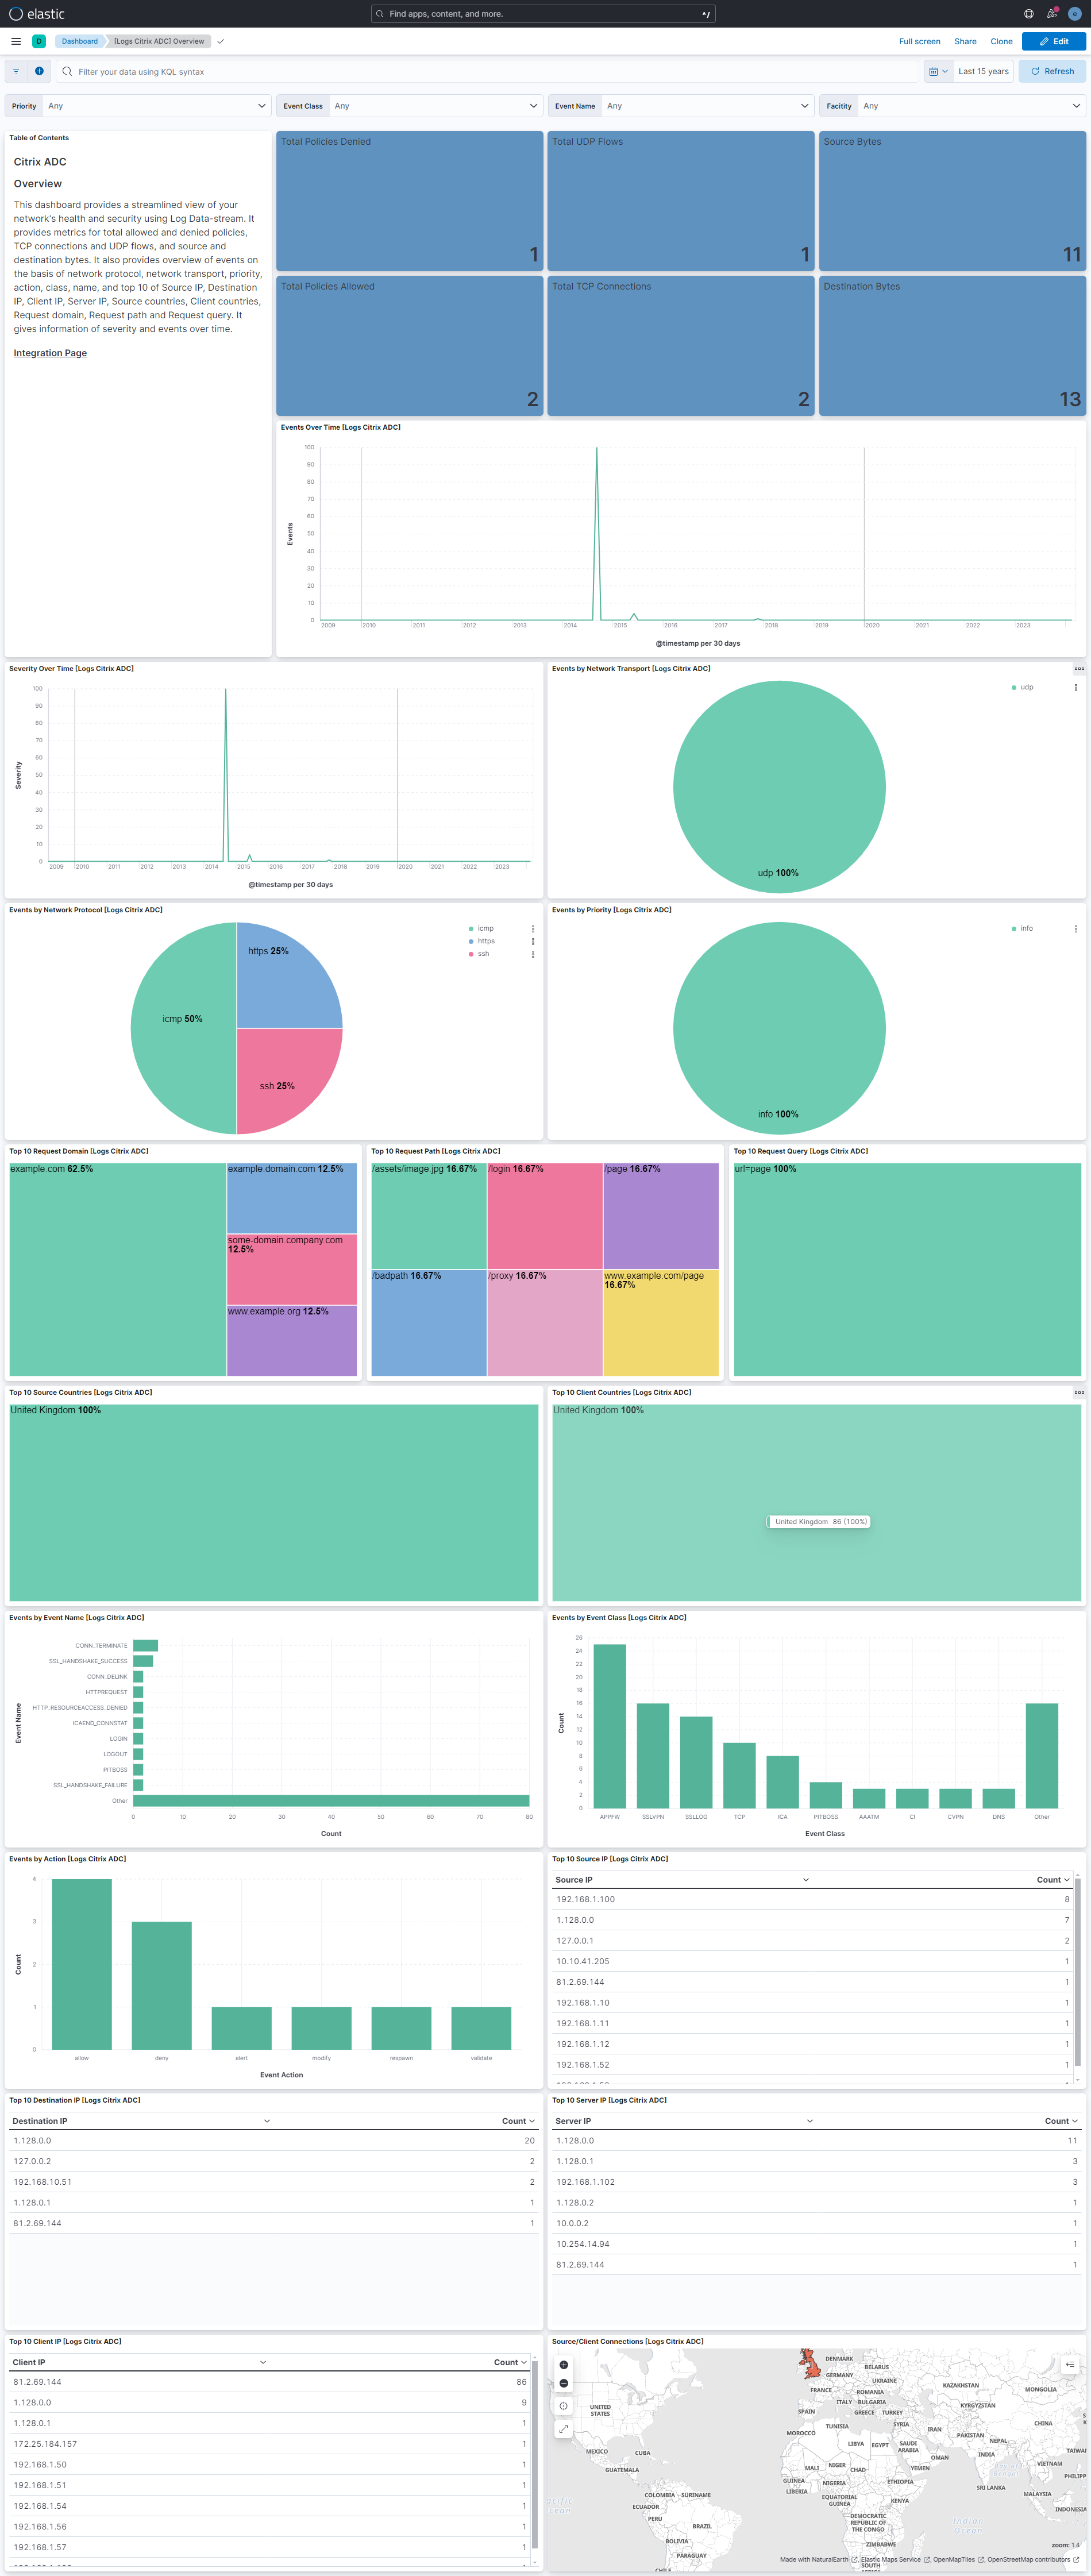
The citrix_adc.log dataset provides events from the configured syslog server.
Example
{
    "@timestamp": "2012-12-18T21:46:17.000Z",
    "agent": {
        "ephemeral_id": "2976e761-4399-4de7-8ea0-97ea83ec7726",
        "id": "418f7c57-c332-4913-b3ec-ddaa31f832a0",
        "name": "docker-fleet-agent",
        "type": "filebeat",
        "version": "8.12.0"
    },
    "citrix": {
        "cef_format": true,
        "cef_version": "0",
        "detail": "CEF:0|Citrix|NetScaler|NS10.0|APPFW|APPFW_STARTURL|6|src=175.16.199.1 spt=54711 method=GET request=http://vpx247.example.net/FFC/login_post.html?abc\\=def msg=Disallow Illegal URL. cn1=465 cn2=535 cs1=profile1 cs2=PPE0 cs3=IliG4Dxp1SjOhKVRDVBXmqvAaIcA000 cs4=ALERT cs5=2012 act=not blocked",
        "device_event_class_id": "APPFW",
        "device_product": "NetScaler",
        "device_vendor": "Citrix",
        "device_version": "NS10.0",
        "facility": "local0",
        "name": "APPFW_STARTURL",
        "ppe_id": "PPE0",
        "priority": "info",
        "profile_name": "profile1",
        "session_id": "IliG4Dxp1SjOhKVRDVBXmqvAaIcA000",
        "severity": "ALERT"
    },
    "client": {
        "geo": {
            "city_name": "London",
            "continent_name": "Europe",
            "country_iso_code": "GB",
            "country_name": "United Kingdom",
            "location": {
                "lat": 51.5142,
                "lon": -0.0931
            },
            "region_iso_code": "GB-ENG",
            "region_name": "England"
        },
        "ip": "81.2.69.144"
    },
    "data_stream": {
        "dataset": "citrix_adc.log",
        "namespace": "ep",
        "type": "logs"
    },
    "ecs": {
        "version": "8.11.0"
    },
    "elastic_agent": {
        "id": "418f7c57-c332-4913-b3ec-ddaa31f832a0",
        "snapshot": false,
        "version": "8.12.0"
    },
    "event": {
        "action": "not blocked",
        "agent_id_status": "verified",
        "dataset": "citrix_adc.log",
        "id": "465",
        "ingested": "2024-03-20T08:51:14Z",
        "original": "Dec 18 21:46:17 <local0.info> 81.2.69.144 CEF:0|Citrix|NetScaler|NS10.0|APPFW|APPFW_STARTURL|6|src=175.16.199.1 spt=54711 method=GET request=http://vpx247.example.net/FFC/login_post.html?abc\\=def msg=Disallow Illegal URL. cn1=465 cn2=535 cs1=profile1 cs2=PPE0 cs3=IliG4Dxp1SjOhKVRDVBXmqvAaIcA000 cs4=ALERT cs5=2012 act=not blocked",
        "severity": 6,
        "timezone": "+00:00"
    },
    "http": {
        "request": {
            "id": "535",
            "method": "GET"
        }
    },
    "input": {
        "type": "udp"
    },
    "log": {
        "source": {
            "address": "192.168.249.4:48549"
        }
    },
    "message": "Disallow Illegal URL.",
    "observer": {
        "product": "Netscaler",
        "type": "firewall",
        "vendor": "Citrix"
    },
    "source": {
        "geo": {
            "city_name": "Changchun",
            "continent_name": "Asia",
            "country_iso_code": "CN",
            "country_name": "China",
            "location": {
                "lat": 43.88,
                "lon": 125.3228
            },
            "region_iso_code": "CN-22",
            "region_name": "Jilin Sheng"
        },
        "ip": "175.16.199.1",
        "port": 54711
    },
    "tags": [
        "preserve_original_event",
        "citrix_adc.log",
        "forwarded"
    ],
    "url": {
        "domain": "vpx247.example.net",
        "extension": "html",
        "original": "http://vpx247.example.net/FFC/login_post.html?abc\\=def",
        "path": "/FFC/login_post.html",
        "query": "abc\\=def",
        "scheme": "http"
    }
}
ECS Field Reference
Check this reference document for more information on ECS fields.
Exported fields
| Field | Description | Type |
|---|---|---|
| @timestamp | Event timestamp. | date |
| citrix.cef_format | Whether the logging is in Citrix CEF format. | boolean |
| citrix.cef_version | The CEF format version used in the logs. | keyword |
| citrix.default_class | Whether the event class was the default. | boolean |
| citrix.detail | The CEF or Citrix Native format details for the event. | keyword |
| citrix.device_event_class_id | The ID of the event class. | keyword |
| citrix.device_product | The model of the appliance. | keyword |
| citrix.device_vendor | The name of the vendor for the device. | keyword |
| citrix.device_version | The version of the device. | keyword |
| citrix.extended | Additional data associated with the event. | flattened |
| citrix.facility | The logging facility. | keyword |
| citrix.host | The name of the host receiving the logs. | keyword |
| citrix.hostname | The name of the host receiving the logs. | keyword |
| citrix.name | The name of the security check. | keyword |
| citrix.ppe_id | Packet Processing Engine ID. | keyword |
| citrix.priority | The logging priority. | keyword |
| citrix.profile_name | The name of the profile that raised the event. | keyword |
| citrix.session_id | The ID for the session. | keyword |
| citrix.severity | The severity of the event. | keyword |
| citrix.signature_violation_category | The category that the violation is grouped into. | keyword |
| citrix_adc.log.access | keyword | |
| citrix_adc.log.access_type | keyword | |
| citrix_adc.log.action | keyword | |
| citrix_adc.log.adm_user | keyword | |
| citrix_adc.log.alert_level | keyword | |
| citrix_adc.log.alert_type | keyword | |
| citrix_adc.log.api_spec | keyword | |
| citrix_adc.log.app.launch_time | keyword | |
| citrix_adc.log.app.name | keyword | |
| citrix_adc.log.app.process_id | long | |
| citrix_adc.log.app.termination_time | keyword | |
| citrix_adc.log.app.termination_type | keyword | |
| citrix_adc.log.appfw_rfc_profile | keyword | |
| citrix_adc.log.application_name | keyword | |
| citrix_adc.log.auto_deploy_mins | long | |
| citrix_adc.log.browser | keyword | |
| citrix_adc.log.browser_type | keyword | |
| citrix_adc.log.bytes.received | long | |
| citrix_adc.log.bytes.sent | long | |
| citrix_adc.log.call_id | keyword | |
| citrix_adc.log.callee.domain_name | keyword | |
| citrix_adc.log.callee.user_name | keyword | |
| citrix_adc.log.caller.domain_name | keyword | |
| citrix_adc.log.caller.user_name | keyword | |
| citrix_adc.log.category | keyword | |
| citrix_adc.log.category_group | keyword | |
| citrix_adc.log.certificate_key_pair | keyword | |
| citrix_adc.log.channel_id_1 | long | |
| citrix_adc.log.channel_id_1_val | long | |
| citrix_adc.log.channel_id_2 | long | |
| citrix_adc.log.channel_id_2_val | long | |
| citrix_adc.log.channel_id_3 | long | |
| citrix_adc.log.channel_id_3_val | long | |
| citrix_adc.log.channel_id_4 | long | |
| citrix_adc.log.channel_id_4_val | long | |
| citrix_adc.log.channel_id_5 | long | |
| citrix_adc.log.channel_id_5_val | long | |
| citrix_adc.log.channel_update.begin | keyword | |
| citrix_adc.log.channel_update.end | keyword | |
| citrix_adc.log.cipher_suite | keyword | |
| citrix_adc.log.client_cookie | keyword | |
| citrix_adc.log.client_hostname | keyword | |
| citrix_adc.log.client_ip | ip | |
| citrix_adc.log.client_launcher | keyword | |
| citrix_adc.log.client_port | long | |
| citrix_adc.log.client_security_check_status | keyword | |
| citrix_adc.log.client_security_expression | keyword | |
| citrix_adc.log.client_type | keyword | |
| citrix_adc.log.client_version | keyword | |
| citrix_adc.log.clientside.jitter | long | |
| citrix_adc.log.clientside.packet_retransmits | long | |
| citrix_adc.log.clientside.rtt | keyword | |
| citrix_adc.log.clientside.rxbytes | long | |
| citrix_adc.log.clientside.txbytes | long | |
| citrix_adc.log.closure_reason | keyword | |
| citrix_adc.log.code | keyword | |
| citrix_adc.log.command | keyword | |
| citrix_adc.log.compression_ratio_recieved | double | |
| citrix_adc.log.compression_ratio_send | double | |
| citrix_adc.log.connection_id | keyword | |
| citrix_adc.log.connection_priority | keyword | |
| citrix_adc.log.content_length_bytes | long | |
| citrix_adc.log.content_type | keyword | |
| citrix_adc.log.content_type_mismatch | keyword | |
| citrix_adc.log.cookie_header_length | long | |
| citrix_adc.log.crl_name | keyword | |
| citrix_adc.log.customer_name | keyword | |
| citrix_adc.log.data | keyword | |
| citrix_adc.log.data_length | long | |
| citrix_adc.log.days_to_expire | long | |
| citrix_adc.log.deleted_rules | long | |
| citrix_adc.log.delink_time | date | |
| citrix_adc.log.delink_timezone | keyword | |
| citrix_adc.log.destination.ip | ip | |
| citrix_adc.log.destination.port | long | |
| citrix_adc.log.device_serial_number | keyword | |
| citrix_adc.log.domain | keyword | |
| citrix_adc.log.domain_name | keyword | |
| citrix_adc.log.duration | keyword | |
| citrix_adc.log.end_time | date | |
| citrix_adc.log.end_time_timezone | keyword | |
| citrix_adc.log.errmsg | keyword | |
| citrix_adc.log.error | keyword | |
| citrix_adc.log.error_code | keyword | |
| citrix_adc.log.error_line | keyword | |
| citrix_adc.log.failure_reason | keyword | |
| citrix_adc.log.field_name | keyword | |
| citrix_adc.log.field_type | keyword | |
| citrix_adc.log.flags | keyword | |
| citrix_adc.log.group | keyword | |
| citrix_adc.log.groups | keyword | |
| citrix_adc.log.handshake_time | keyword | |
| citrix_adc.log.header | keyword | |
| citrix_adc.log.header_length | long | |
| citrix_adc.log.hit.count | long | |
| citrix_adc.log.hit.rule | keyword | |
| citrix_adc.log.hostname | keyword | |
| citrix_adc.log.html_url | keyword | |
| citrix_adc.log.http_resources_accessed | keyword | |
| citrix_adc.log.ica_rtt | keyword | |
| citrix_adc.log.ica_uuid | ICA session UUID extracted from the optional bracket prefix in ICASTART and ICAEND_CONNSTAT messages (for example, [ICAUUID=…]). | keyword |
| citrix_adc.log.icap_server.ip | ip | |
| citrix_adc.log.icap_server.port | long | |
| citrix_adc.log.id | keyword | |
| citrix_adc.log.infomsg | keyword | |
| citrix_adc.log.ip_address | ip | |
| citrix_adc.log.issuer_name | keyword | |
| citrix_adc.log.l7_latency.max_notify_count | long | |
| citrix_adc.log.l7_latency.notify_interval | long | |
| citrix_adc.log.l7_latency.threshold_factor | long | |
| citrix_adc.log.l7_latency.waittime | keyword | |
| citrix_adc.log.l7_threshold_breach.avg_clientside_latency | long | |
| citrix_adc.log.l7_threshold_breach.avg_serverside_latency | long | |
| citrix_adc.log.l7_threshold_breach.max_clientside_latency | long | |
| citrix_adc.log.l7_threshold_breach.max_serverside_latency | long | |
| citrix_adc.log.last_contact | keyword | |
| citrix_adc.log.launch_mechanism | keyword | |
| citrix_adc.log.ldap_scope | keyword | |
| citrix_adc.log.license_limit | long | |
| citrix_adc.log.logout_method | keyword | |
| citrix_adc.log.matched_url | keyword | |
| citrix_adc.log.max_allowed.cookie_header_length | long | |
| citrix_adc.log.max_allowed.header_length | long | |
| citrix_adc.log.max_allowed.query_string_length | long | |
| citrix_adc.log.max_allowed.total_http_header_length | long | |
| citrix_adc.log.max_allowed.url_length | long | |
| citrix_adc.log.max_restarts | long | |
| citrix_adc.log.message | keyword | |
| citrix_adc.log.method | keyword | |
| citrix_adc.log.min_l7_latency | long | |
| citrix_adc.log.mode | keyword | |
| citrix_adc.log.module_path | keyword | |
| citrix_adc.log.nat.ip | ip | |
| citrix_adc.log.nat.port | long | |
| citrix_adc.log.natted.ip | ip | |
| citrix_adc.log.natted.port | long | |
| citrix_adc.log.newly_added_rules | long | |
| citrix_adc.log.non_http_services_accessed | keyword | |
| citrix_adc.log.nsica_session.acr_count | long | |
| citrix_adc.log.nsica_session.client.ip | ip | |
| citrix_adc.log.nsica_session.client.port | long | |
| citrix_adc.log.nsica_session.reconnect_count | long | |
| citrix_adc.log.nsica_session.server.ip | ip | |
| citrix_adc.log.nsica_session.server.port | long | |
| citrix_adc.log.nsica_session.status | keyword | |
| citrix_adc.log.nsica_status | keyword | |
| citrix_adc.log.old_pid | long | |
| citrix_adc.log.origin_server.ip | ip | |
| citrix_adc.log.origin_server.port | long | |
| citrix_adc.log.original_destination.ip | ip | |
| citrix_adc.log.original_destination.port | long | |
| citrix_adc.log.pcre_error_code | keyword | |
| citrix_adc.log.peid | keyword | |
| citrix_adc.log.policy_action | keyword | |
| citrix_adc.log.policy_violation | keyword | |
| citrix_adc.log.ppe | Packet Processing Engine identifier. | keyword |
| citrix_adc.log.process.id | long | |
| citrix_adc.log.process.name | keyword | |
| citrix_adc.log.profile | keyword | |
| citrix_adc.log.protocol | keyword | |
| citrix_adc.log.protocol_version | keyword | |
| citrix_adc.log.query_string_length | long | |
| citrix_adc.log.reason | keyword | |
| citrix_adc.log.referer_header | keyword | |
| citrix_adc.log.register | keyword | |
| citrix_adc.log.remote_ip | ip | |
| citrix_adc.log.reputation | long | |
| citrix_adc.log.request.bytes_sent | long | |
| citrix_adc.log.request.path | keyword | |
| citrix_adc.log.response.bytes_sent | long | |
| citrix_adc.log.response.code | long | |
| citrix_adc.log.rewritten_url | keyword | |
| citrix_adc.log.rule | keyword | |
| citrix_adc.log.rule_id | keyword | |
| citrix_adc.log.sequence_number | long | |
| citrix_adc.log.serial_number | keyword | |
| citrix_adc.log.server.ip | ip | |
| citrix_adc.log.server.name | keyword | |
| citrix_adc.log.server.port | long | |
| citrix_adc.log.server_authentication | keyword | |
| citrix_adc.log.serverside.jitter | long | |
| citrix_adc.log.serverside.packet_retransmits | long | |
| citrix_adc.log.serverside.rtt | keyword | |
| citrix_adc.log.service | keyword | |
| citrix_adc.log.session | keyword | |
| citrix_adc.log.session_end_time | keyword | |
| citrix_adc.log.session_guid | keyword | |
| citrix_adc.log.session_id | keyword | |
| citrix_adc.log.session_setup_time | keyword | |
| citrix_adc.log.signature_algorithm | keyword | |
| citrix_adc.log.signature_id | keyword | |
| citrix_adc.log.source.ip | ip | |
| citrix_adc.log.source.port | long | |
| citrix_adc.log.spcb_id | keyword | |
| citrix_adc.log.ssl_relay.address | ip | |
| citrix_adc.log.ssl_relay.port | long | |
| citrix_adc.log.sslvpn_client_type | keyword | |
| citrix_adc.log.sso_status | keyword | |
| citrix_adc.log.start_time | date | |
| citrix_adc.log.start_time_timezone | keyword | |
| citrix_adc.log.startup_duration | long | |
| citrix_adc.log.status | keyword | |
| citrix_adc.log.subject_name | keyword | |
| citrix_adc.log.timestamp | date | |
| citrix_adc.log.timezone | keyword | |
| citrix_adc.log.total_bytes_received | long | |
| citrix_adc.log.total_bytes_send | long | |
| citrix_adc.log.total_bytes_wire_recieved | keyword | |
| citrix_adc.log.total_bytes_wire_send | keyword | |
| citrix_adc.log.total_compressed_bytes_recieved | long | |
| citrix_adc.log.total_compressed_bytes_send | long | |
| citrix_adc.log.total_http_header_length | long | |
| citrix_adc.log.total_policies_allowed | long | |
| citrix_adc.log.total_policies_denied | long | |
| citrix_adc.log.total_tcp_connections | long | |
| citrix_adc.log.total_udp_flows | long | |
| citrix_adc.log.transaction_id | Transaction identifier. | keyword |
| citrix_adc.log.translated_destination.ip | ip | |
| citrix_adc.log.translated_destination.port | long | |
| citrix_adc.log.transport | keyword | |
| citrix_adc.log.type | keyword | |
| citrix_adc.log.unknown_content_type | keyword | |
| citrix_adc.log.url | keyword | |
| citrix_adc.log.url_length | long | |
| citrix_adc.log.user | keyword | |
| citrix_adc.log.useremail | keyword | |
| citrix_adc.log.username | keyword | |
| citrix_adc.log.valid_from | date | |
| citrix_adc.log.valid_to | date | |
| citrix_adc.log.value | keyword | |
| citrix_adc.log.violation_type | keyword | |
| citrix_adc.log.vserver.ip | ip | |
| citrix_adc.log.vserver.port | long | |
| citrix_adc.log.watch_id | keyword | |
| citrix_adc.log.x_forwarded_for_ip | Originating client IP address reported by the X-Forwarded-For header when the client connects through a proxy. Also mapped to network.forwarded_ip. | ip |
| cloud.image.id | Image ID for the cloud instance. | keyword |
| data_stream.dataset | Data stream dataset. | constant_keyword |
| data_stream.namespace | Data stream namespace. | constant_keyword |
| data_stream.type | Data stream type. | constant_keyword |
| event.dataset | Event dataset | constant_keyword |
| event.module | Event module | constant_keyword |
| host.containerized | If the host is a container. | boolean |
| host.os.build | OS build information. | keyword |
| host.os.codename | OS codename, if any. | keyword |
| input.type | Input type. | keyword |
| log.offset | Offset of the entry in the log file. | long |
| log.source.address | Source address from which the log event was read / sent from. | keyword |
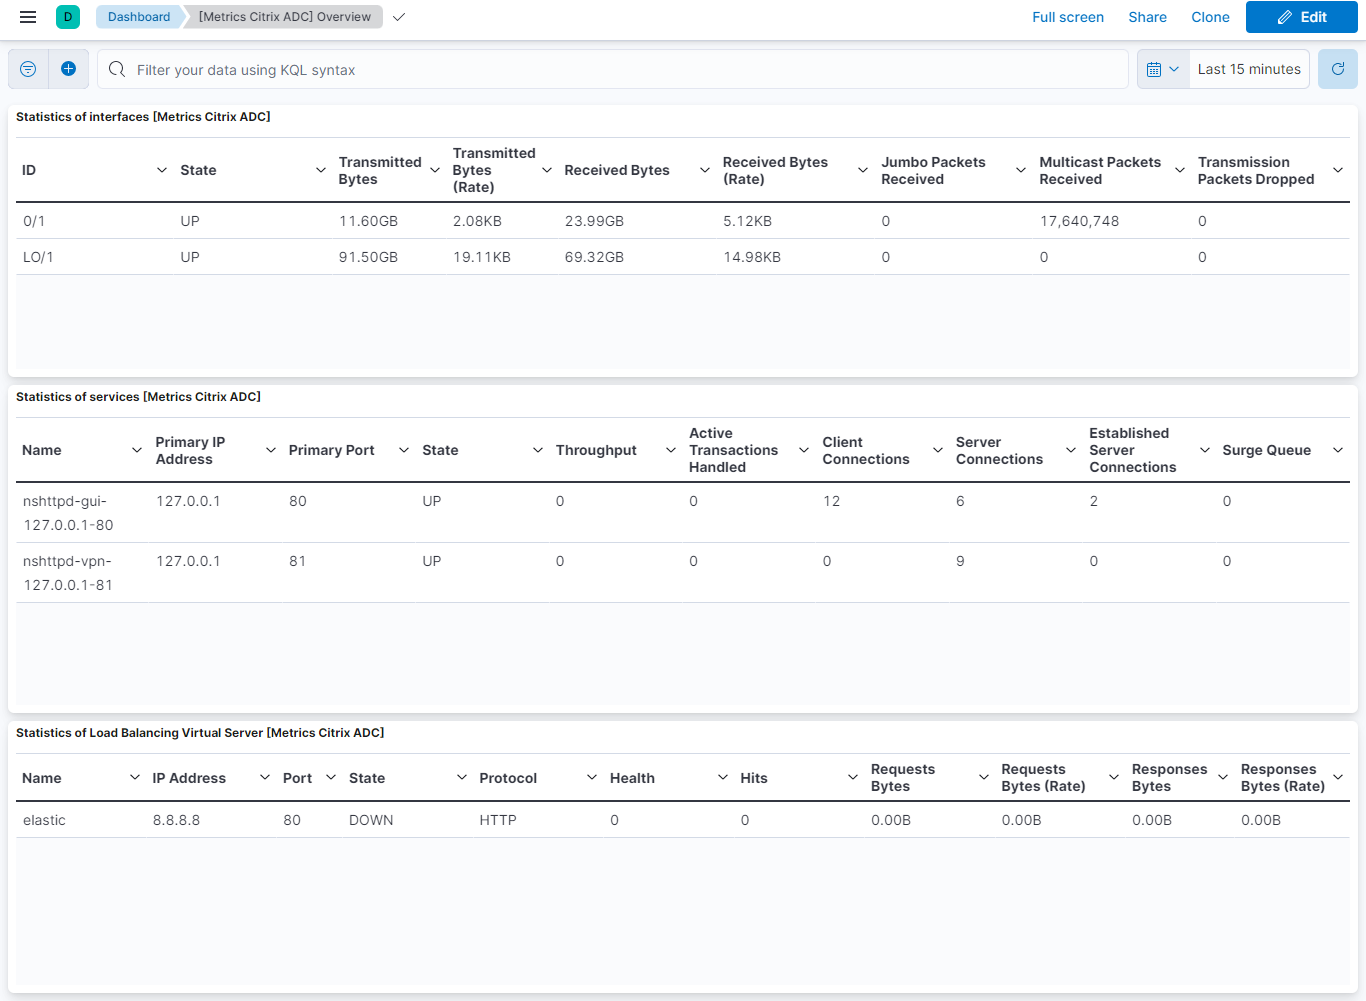
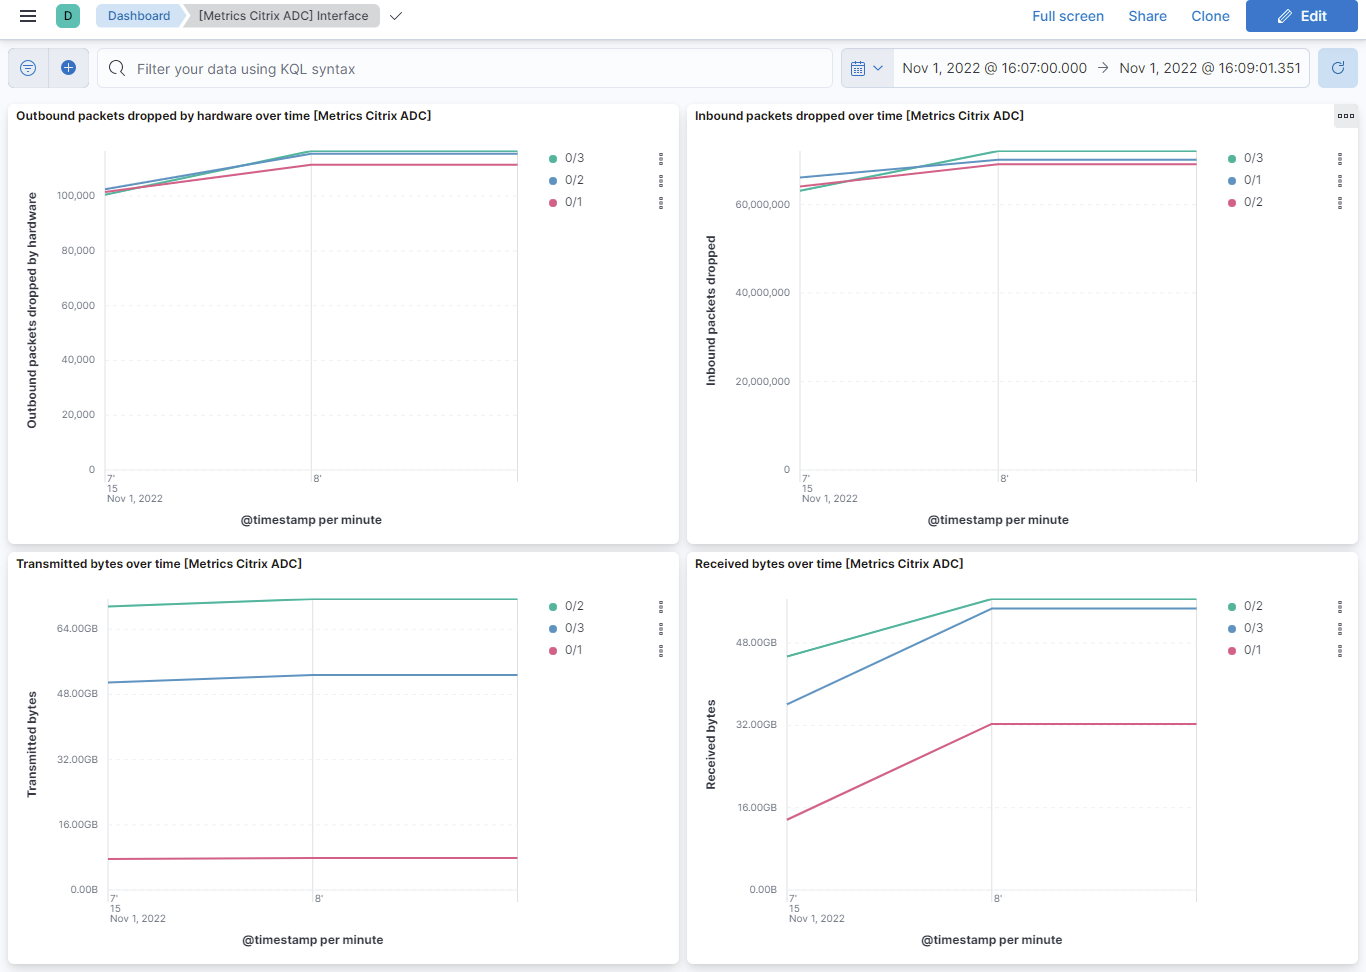
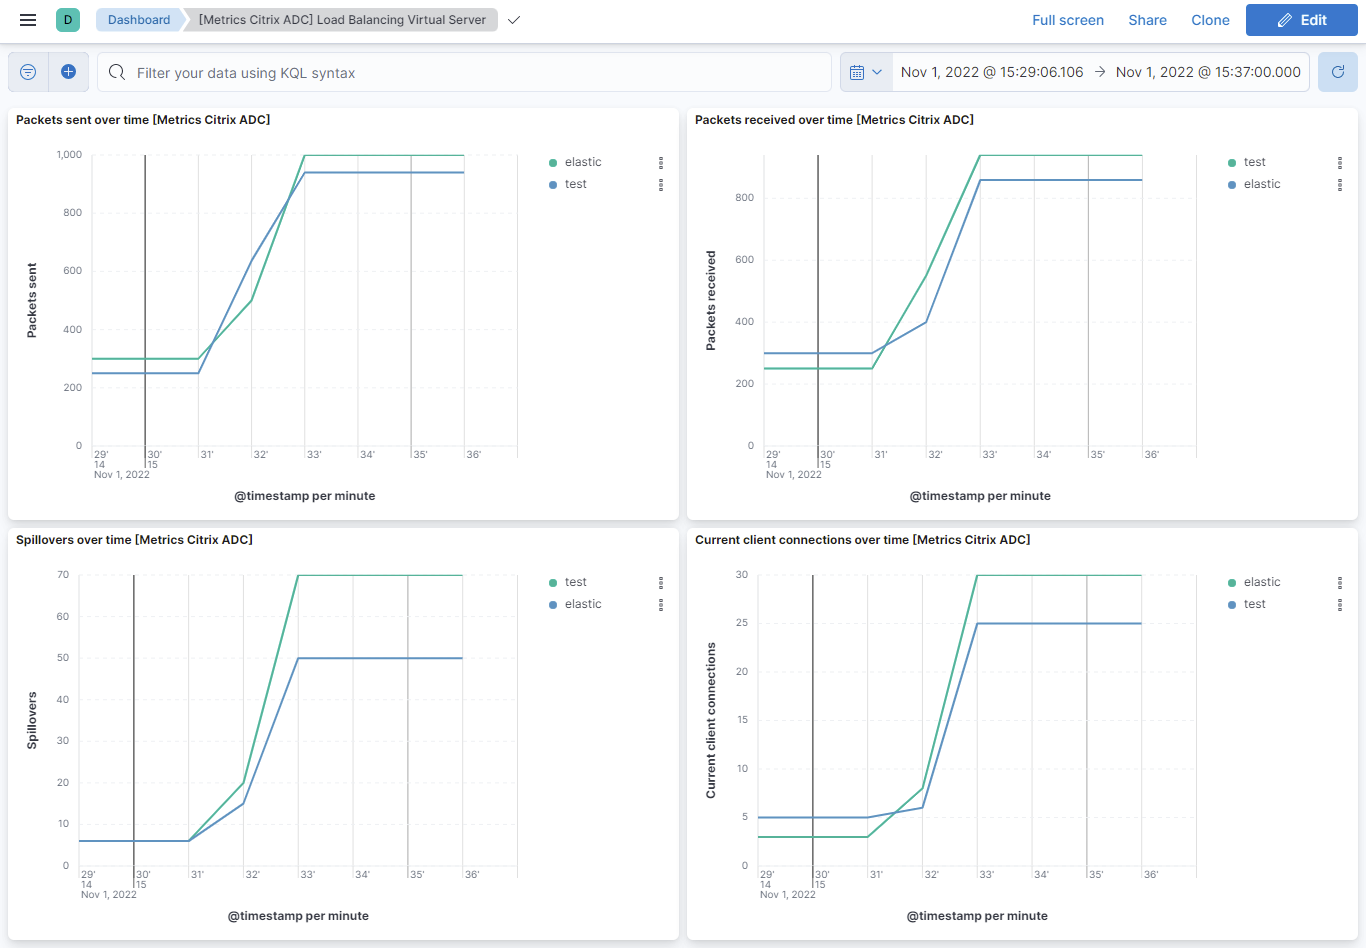
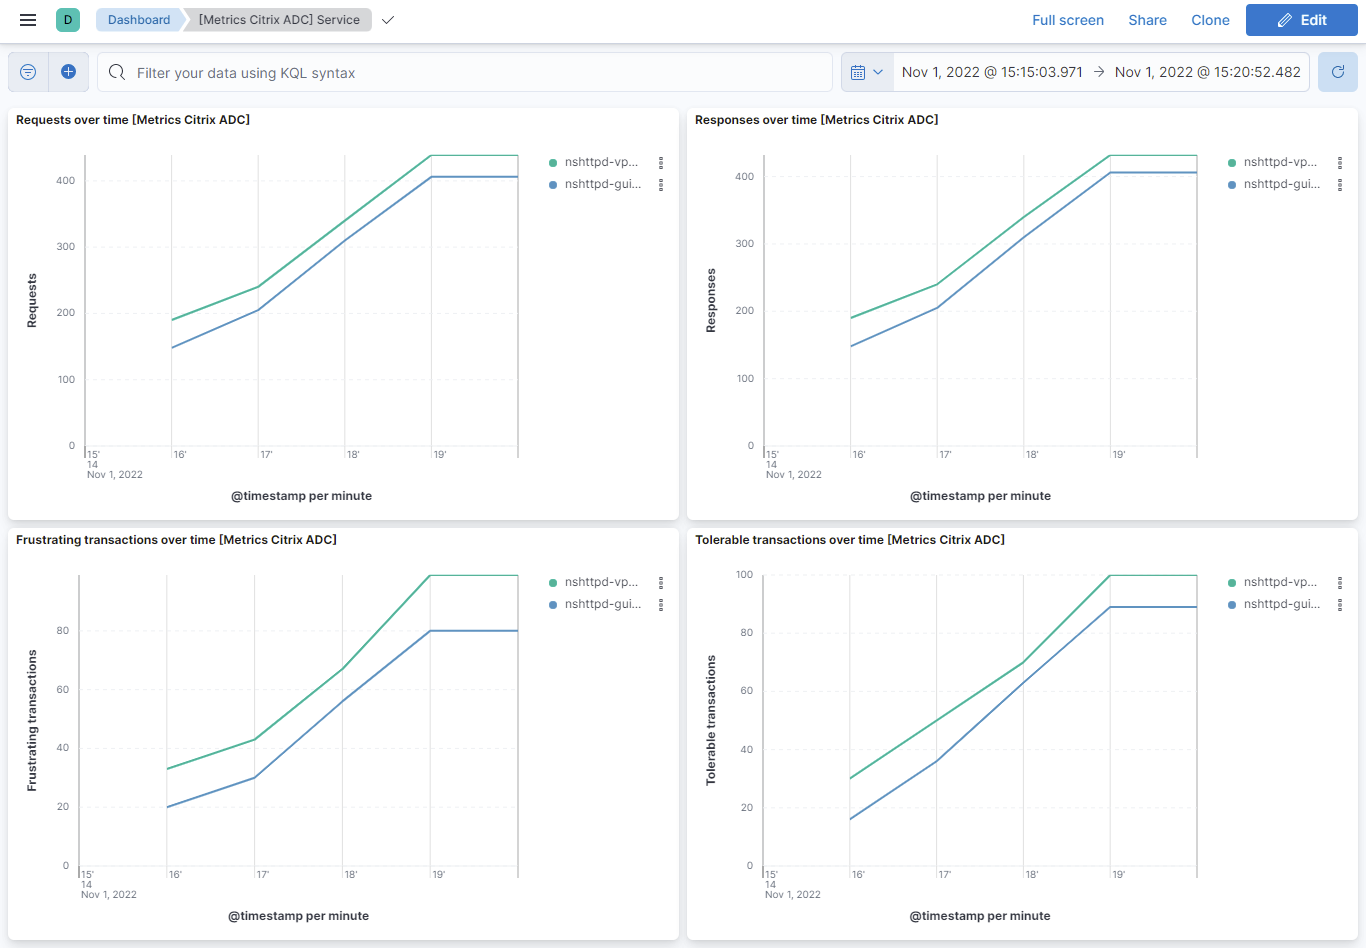
This integration includes one or more Kibana dashboards that visualizes the data collected by the integration. The screenshots below illustrate how the ingested data is displayed.
Changelog
| Version | Details | Minimum Kibana version |
|---|---|---|
| 1.22.0 | Enhancement (View pull request) Document that day-first Citrix logs need Custom Date Format set to dd/MM/yyyy:HH:mm:ss, and add a pipeline test for that setting. |
9.0.0 8.13.0 |
| 1.21.0 | Enhancement (View pull request) Changed owners. |
9.0.0 8.13.0 |
| 1.20.0 | Enhancement (View pull request) Add citrix_adc.log.x_forwarded_for_ip field, mapped to network.forwarded_ip and appended to related.ip. Bug fix (View pull request) Fix SSLVPN grok parsing for LOGIN, LOGOUT, TCPCONNSTAT, TCPCONN_TIMEDOUT, UDPFLOWSTAT and REMOVE_SESSION_DEBUG events to handle the optional X-Forwarded-For_ip field between Client_ip and Nat_ip, including comma-separated proxy chains, non-IP values and IPv4-mapped IPv6 addresses, an absent Client_ip value, and quoted Nat_ip values in UDPFLOWSTAT. The unquoted Nat_ip fallback in LOGOUT is now bounded, so an unrecognised message segment surfaces as a document error instead of being silently discarded; bare, quoted and unquoted Nat_ip values continue to parse as before. |
9.0.0 8.13.0 |
| 1.19.2 | Bug fix (View pull request) Fix SSLVPN Message events skipping the SSLVPN and AAATM feature pipeline, which made the Message grok processor unreachable. Bug fix (View pull request) Fix the Logout handler grok pattern so that citrix_adc.log.username is captured. The alternation was written inside a pattern name, where grok reads it as literal text. Bug fix (View pull request) Fix a typo that wrote the aaatm_handler assertion client IP to citrix_adx.log.client_ip instead of citrix_adc.log.client_ip. |
9.0.0 8.13.0 |
| 1.19.1 | Bug fix (View pull request) Fix APPFW_SCHEMA_ENDPOINT_NOTFOUND grok pattern so that url.original captures the actual endpoint URL instead of the literal "Endpoint:" token, and add http.request.method and citrix_adc.log.api_spec fields. |
9.0.0 8.13.0 |
| 1.19.0 | Enhancement (View pull request) Support ICASTART and ICAEND_CONNSTAT parsing with bracketed and non-bracketed prefixes, optional Client_ip tokens, and optional SSLRelayAddress. |
9.0.0 8.13.0 |
| 1.18.6 | Bug fix (View pull request) Fix ICASTART Grok pattern to handle empty customername (double space) and trailing carriage return characters. |
9.0.0 8.13.0 |
| 1.18.5 | Bug fix (View pull request) Fix parsing of Source/Destination IP, port, and byte counts for TCP CONN_TERMINATE events with trailing whitespace. |
9.0.0 8.13.0 |
| 1.18.4 | Bug fix (View pull request) Add parsing for APPFW native messages with IP-based format |
9.0.0 8.13.0 |
| 1.18.3 | Bug fix (View pull request) Fix invalid integrations:// cross-link path in documentation. |
9.0.0 8.13.0 |
| 1.18.2 | Bug fix (View pull request) Fix grok processing in native pipeline for headers with timezone. |
9.0.0 8.13.0 |
| 1.18.1 | Bug fix (View pull request) Fix grok processing for headerless details event types in native pipeline. |
9.0.0 8.13.0 |
| 1.18.0 | Enhancement (View pull request) Preserve event.original on pipeline error in log data stream. |
9.0.0 8.13.0 |
| 1.17.5 | Bug fix (View pull request) Properly parse failed status conditions in sslvpn pipeline |
9.0.0 8.13.0 |
| 1.17.4 | Enhancement (View pull request) Generate processor tags and normalize error handler. |
9.0.0 8.13.0 |
| 1.17.3 | Bug fix (View pull request) Add support for additional log format patterns in sslvpn_clisec |
9.0.0 8.13.0 |
| 1.17.2 | Bug fix (View pull request) Fix grok processing for HTTPREQUEST and UDPFLOWSTAT in sslvpn_and_aaatm_feature pipeline with optional patterns. |
9.0.0 8.13.0 |
| 1.17.1 | Bug fix (View pull request) Fix Grok processing for LOGOUT and HTTPREQUEST event types in sslvpn_and_aaatm_feature pipeline. |
9.0.0 8.13.0 |
| 1.17.0 | Enhancement (View pull request) Remove duplicated installation instructions from the documentation. |
9.0.0 8.13.0 |
| 1.16.0 | Enhancement (View pull request) Standardize user fields processing across integrations. |
9.0.0 8.13.0 |
| 1.15.2 | Bug fix (View pull request) Clarify prefer ingest methods in documentation |
9.0.0 8.13.0 |
| 1.15.1 | Bug fix (View pull request) Added description to ssl nodes in package level manifest.yml file to including links to documentation. |
9.0.0 8.13.0 |
| 1.15.0 | Enhancement (View pull request) Add support for parsing RFC5424 syslog messages |
9.0.0 8.13.0 |
| 1.14.0 | Enhancement (View pull request) Update grok lines for discrepancies seen in the wild, and remove newlines to fix sporadic weird errors |
9.0.0 8.13.0 |
| 1.13.1 | Bug fix (View pull request) Updated SSL description to be uniform and to include links to documentation. |
9.0.0 8.13.0 |
| 1.13.0 | Enhancement (View pull request) Add support for Kibana 9.0.0. |
9.0.0 8.13.0 |
| 1.12.4 | Enhancement (View pull request) Handle additional parsing cases for HTTPREQUEST and TCPCONN_TIMEDOUT |
8.13.0 |
| 1.12.3 | Enhancement (View pull request) Handle additional parsing case for UDPFLOWSTAT |
8.13.0 |
| 1.12.2 | Bug fix (View pull request) Update links to getting started docs |
8.13.0 |
| 1.12.1 | Bug fix (View pull request) Ensure time zone setting is applied properly |
8.13.0 |
| 1.12.0 | Enhancement (View pull request) Support parsing additional sslvpn log messages |
8.13.0 |
| 1.11.0 | Bug fix (View pull request) Improve timestamp parsing |
8.13.0 |
| 1.10.0 | Enhancement (View pull request) Parse additional sslvpn fields |
8.13.0 |
| 1.9.0 | Enhancement (View pull request) Make the date/time parsing format configurable. |
8.13.0 |
| 1.8.1 | Bug fix (View pull request) Improve handling of SSLVPN Message. |
8.13.0 |
| 1.8.0 | Enhancement (View pull request) Allow @custom pipeline access to event.original without setting preserve_original_event. |
8.13.0 |
| 1.7.3 | Bug fix (View pull request) New native_timestamp format added for the citrix_adc log messages |
8.13.0 |
| 1.7.2 | Bug fix (View pull request) Parse timezone when present in sslvpn_and_aaatm_feature pipeline |
8.13.0 |
| 1.7.1 | Bug fix (View pull request) Timezone field made optional for the citrix_adc log messages |
8.13.0 |
| 1.7.0 | Enhancement (View pull request) ECS version updated to 8.11.0. Removed import_mappings. Update the kibana constraint to ^8.13.0. Modified the field definitions to remove ECS fields made redundant by the ecs@mappings component template. |
8.13.0 |
| 1.6.0 | Enhancement (View pull request) Add global filter on data_stream.dataset to improve performance. |
8.12.0 |
| 1.5.1 | Enhancement (View pull request) Update description with log collection. |
8.12.0 |
| 1.5.0 | Enhancement (View pull request) Add support of citrix_waf connector and enhance the syslog message. |
8.12.0 |
| 1.4.0 | Enhancement (View pull request) Enable secrets for sensitive fields. For more details, refer https://www.elastic.co/guide/en/fleet/current/agent-policy.html#agent-policy-secret-values |
8.12.0 |
| 1.3.1 | Bug fix (View pull request) Disable secrets for older stack versions due to errors. |
8.7.1 |
| 1.3.0 | Enhancement (View pull request) Enable 'secret' for the sensitive fields, supported from 8.12. |
8.7.1 |
| 1.2.0 | Enhancement (View pull request) Limit request tracer log count to five. |
8.7.1 |
| 1.1.0 | Enhancement (View pull request) Update the package format_version to 3.0.0. |
8.7.1 |
| 1.0.1 | Bug fix (View pull request) Add null check and ignore_missing check to the rename processor |
8.7.1 |
| 1.0.0 | Enhancement (View pull request) Make Citrix ADC GA. |
8.7.1 |
| 0.7.1 | Bug fix (View pull request) Resolve host.ip field conflict. |
8.7.1 |
| 0.7.0 | Enhancement (View pull request) Rename ownership from obs-service-integrations to obs-infraobs-integrations |
8.7.1 |
| 0.6.0 | Enhancement (View pull request) Add a new flag to enable request tracing |
8.7.1 |
| 0.5.2 | Bug fix (View pull request) Fix all mapping of type float to double |
8.4.0 |
| 0.5.1 | Enhancement (View pull request) Added categories and/or subcategories. |
8.4.0 |
| 0.5.0 | Enhancement (View pull request) Citrix ADC integration package with "vpn" data stream. |
8.4.0 |
| 0.4.0 | Enhancement (View pull request) Citrix ADC integration package with "system" data stream. |
8.4.0 |
| 0.3.0 | Enhancement (View pull request) Citrix ADC integration package with "lbvserver" data stream. |
8.4.0 |
| 0.2.0 | Enhancement (View pull request) Citrix ADC integration package with "service" data stream. |
8.4.0 |
| 0.1.0 | Enhancement (View pull request) Citrix ADC integration package with "interface" data stream. |
8.4.0 |