GCP BigQuery OpenTelemetry Assets
Elastic Cloud Serverless projects are autoscaled environments, fully managed by Elastic and available on Elastic Cloud. Availability This functionality is in technical preview and is ready for evaluation. Use with caution in production; it is not recommended for mission-critical workloads. Elastic will work to fix any issues, but features in technical preview are not subject to the support SLA of official GA features. Specific Support terms apply. Elastic Cloud Serverless projects are autoscaled environments, fully managed by Elastic and available on Elastic Cloud. Availability This functionality is in technical preview and is ready for evaluation. Use with caution in production; it is not recommended for mission-critical workloads. Elastic will work to fix any issues, but features in technical preview are not subject to the support SLA of official GA features. Specific Support terms apply. The Elastic Stack includes Elastic's core products such as Elasticsearch, Kibana, Logstash, and Beats. Availability We plan to add this functionality in a future Elastic Stack update. Subject to changes. Unless stated otherwise on the page, this functionality is available when your Elastic Stack is deployed on Elastic Cloud Hosted, Elastic Cloud Enterprise, Elastic Cloud on Kubernetes, and self-managed environments. This documentation corresponds to the latest patch available for each minor version. If you're not using the latest patch, check the release notes for changes.
Serverless Observability
Preview
Preview
Serverless Security
Preview
Preview
Stack
Planned
Planned
| Version | 0.1.0 Availability Preview This functionality is in technical preview and is ready for evaluation. Use with caution in production; it is not recommended for mission-critical workloads. Elastic will work to fix any issues, but features in technical preview are not subject to the support SLA of official GA features. Specific Support terms apply. (View all) |
| Subscription level What's this? |
Basic |
| Developed by What's this? |
Elastic |
| Minimum Kibana version(s) | 9.6.0 |
To use pre-release integrations, go to the Integrations page in Kibana, scroll down, and toggle on the Display beta integrations option.
This package contains Kibana assets for monitoring BigQuery with Google Cloud Monitoring metrics collected by the OpenTelemetry Collector.
The package is content only. It does not configure data collection. Use the Google Cloud Monitoring (OpenTelemetry) input package (googlecloudmonitor_input_otel) to collect BigQuery metrics into Elasticsearch.
You need Elasticsearch for storing and searching your data and Kibana for visualizing and managing it. You can use our hosted Elasticsearch Service on Elastic Cloud, which is recommended, or self-manage the Elastic Stack on your own hardware.
Install the Google Cloud Monitoring OpenTelemetry Input package (googlecloudmonitor_input_otel) and configure it to collect BigQuery Cloud Monitoring metrics (for example, bigquery.googleapis.com/query/count). This content package provides assets that visualize data collected by that input.
When configuring the input package, set the dataset name to gcp.bigquery.otel so that data is written to the metrics-gcp.bigquery.otel-default data stream, which these dashboards query.
| Dashboard | Description |
|---|---|
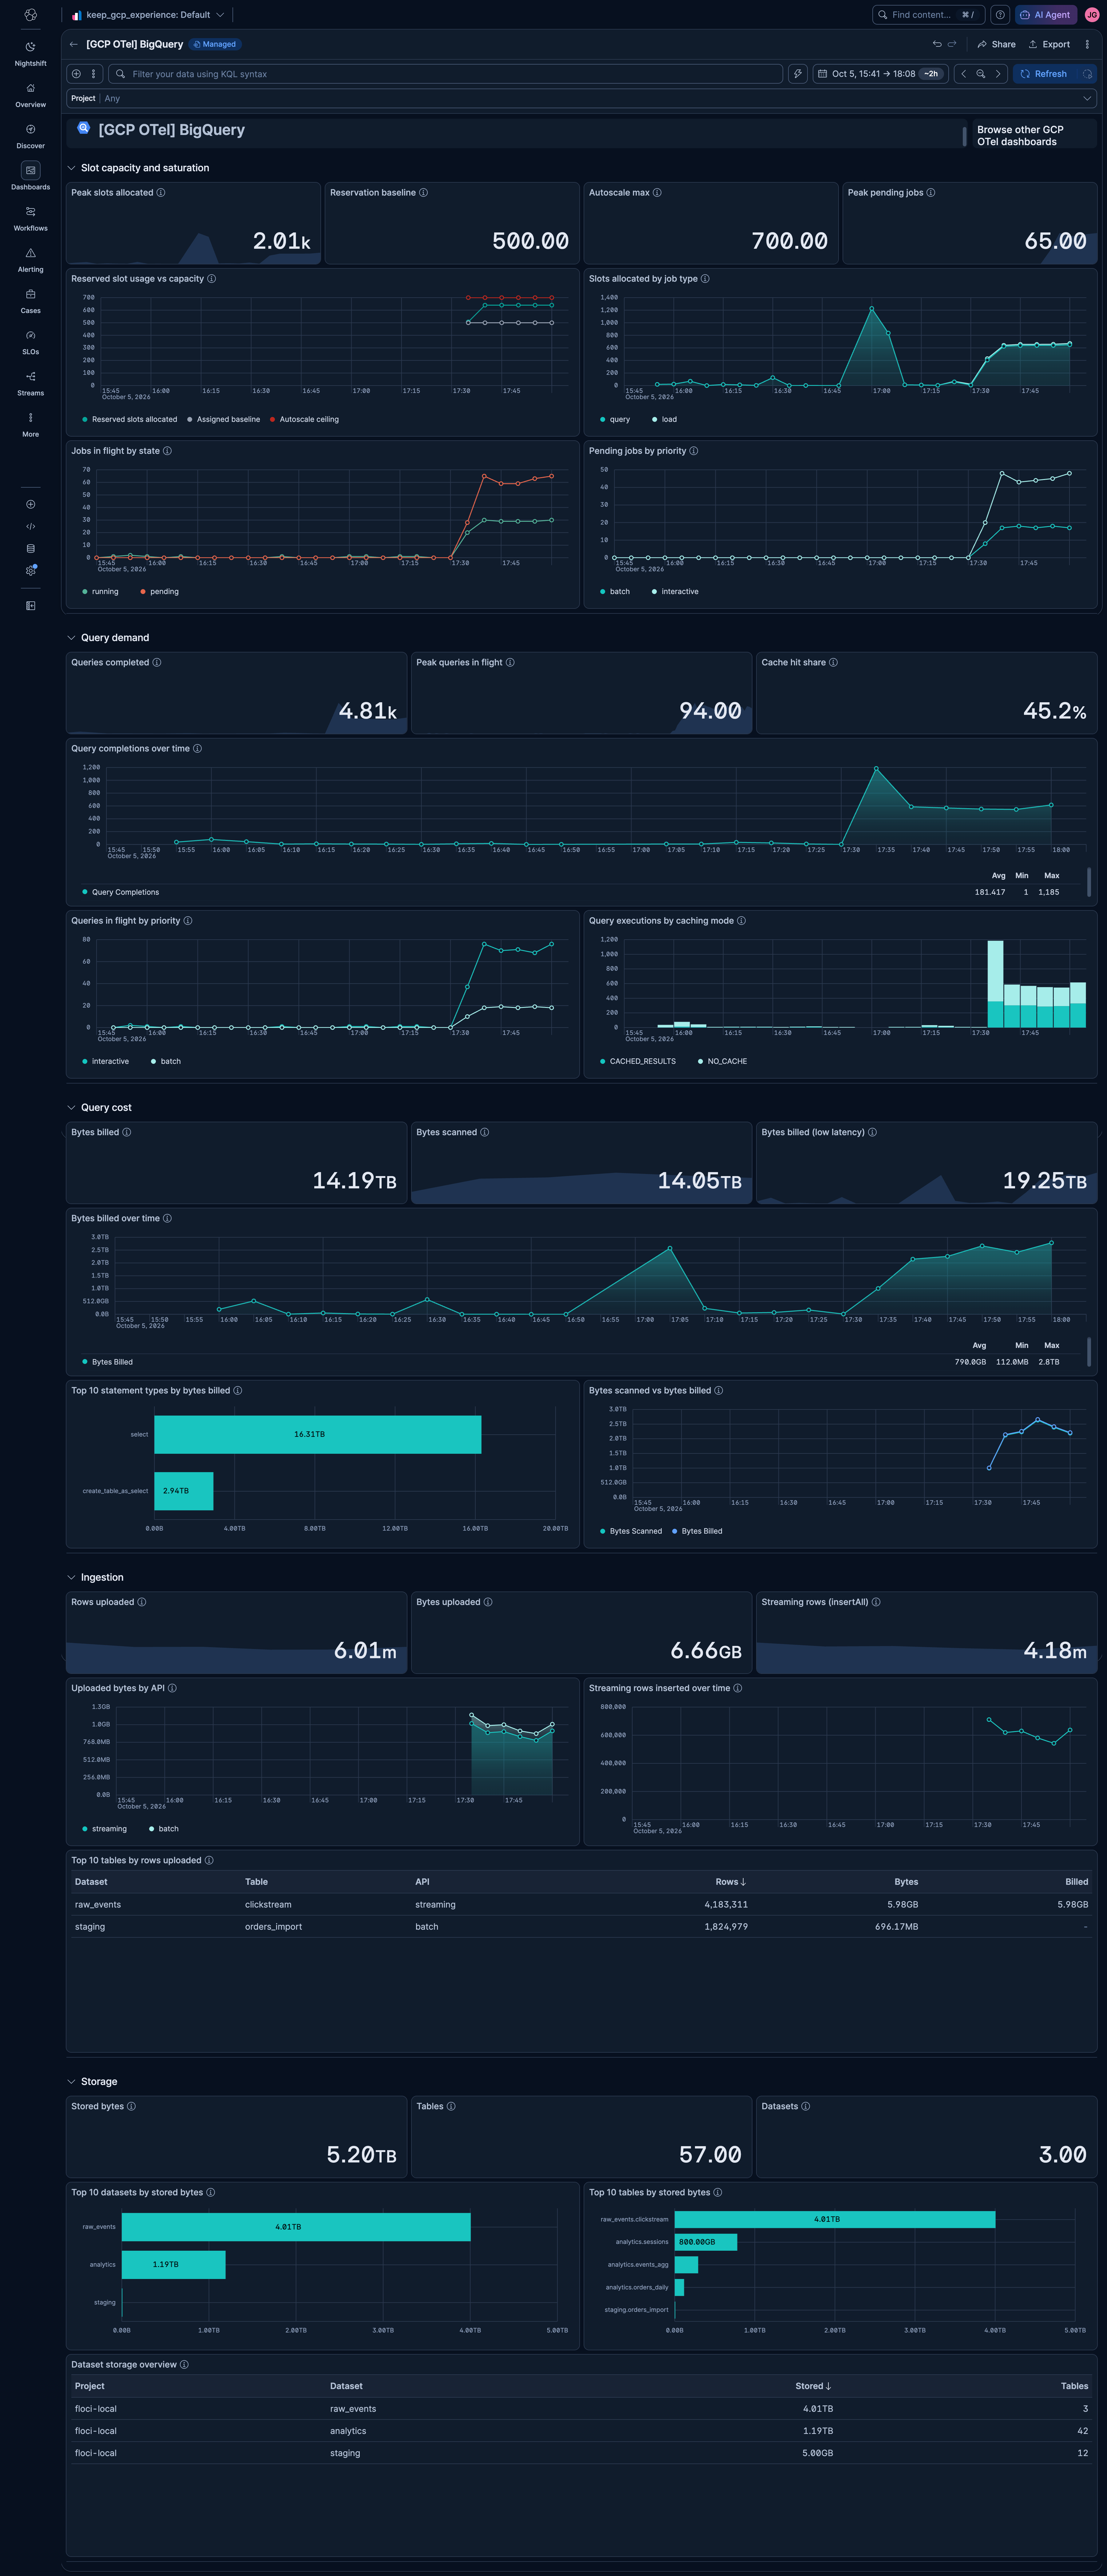
| [GCP OTel] BigQuery | Workload health across BigQuery projects. Covers slot capacity and saturation, query demand, query cost, ingestion, and storage. |
This integration includes one or more Kibana dashboards that visualizes the data collected by the integration. The screenshots below illustrate how the ingested data is displayed.
Changelog
| Version | Details | Minimum Kibana version |
|---|---|---|
| 0.1.0 | Enhancement (View pull request) Initial draft of the GCP BigQuery OpenTelemetry Assets package. |
9.6.0 |