AWS Lambda Metrics OpenTelemetry Assets
Elastic Cloud Serverless projects are autoscaled environments, fully managed by Elastic and available on Elastic Cloud. Availability This functionality is in technical preview and is ready for evaluation. Use with caution in production; it is not recommended for mission-critical workloads. Elastic will work to fix any issues, but features in technical preview are not subject to the support SLA of official GA features. Specific Support terms apply. Elastic Cloud Serverless projects are autoscaled environments, fully managed by Elastic and available on Elastic Cloud. Availability This functionality is in technical preview and is ready for evaluation. Use with caution in production; it is not recommended for mission-critical workloads. Elastic will work to fix any issues, but features in technical preview are not subject to the support SLA of official GA features. Specific Support terms apply. The Elastic Stack includes Elastic's core products such as Elasticsearch, Kibana, Logstash, and Beats. Availability This functionality is in technical preview and is ready for evaluation. Use with caution in production; it is not recommended for mission-critical workloads. Elastic will work to fix any issues, but features in technical preview are not subject to the support SLA of official GA features. Specific Support terms apply. Unless stated otherwise on the page, this functionality is available when your Elastic Stack is deployed on Elastic Cloud Hosted, Elastic Cloud Enterprise, Elastic Cloud on Kubernetes, and self-managed environments. This documentation corresponds to the latest patch available for each minor version. If you're not using the latest patch, check the release notes for changes.
Serverless Observability
Preview
Preview
Serverless Security
Preview
Preview
Stack
Preview
9.5+
Preview since 9.5
| Version | 0.12.0 Availability Preview This functionality is in technical preview and is ready for evaluation. Use with caution in production; it is not recommended for mission-critical workloads. Elastic will work to fix any issues, but features in technical preview are not subject to the support SLA of official GA features. Specific Support terms apply. (View all) |
| Subscription level What's this? |
Basic |
| Developed by What's this? |
Elastic |
| Minimum Kibana version(s) | 9.5.0 |
To use pre-release integrations, go to the Integrations page in Kibana, scroll down, and toggle on the Display beta integrations option.
This package contains Kibana assets for monitoring Lambda functions with AWS CloudWatch metrics collected by the OpenTelemetry Collector.
The package is content only. It provides a curated metrics dashboard, but it does not configure data collection. Use the AWS CloudWatch OpenTelemetry Input Package (aws_cloudwatch_input_otel) to configure the OpenTelemetry Collector CloudWatch receiver and collect the required AWS service metrics into Elasticsearch.
- CloudWatch metrics collected by the OpenTelemetry Collector AWS CloudWatch receiver.
- Documents indexed into the
metrics-aws.lambda.otel-*data stream. - The relevant AWS dimensions for this service, such as resource name, region, and service-specific identifiers.
Requires Kibana ^9.5.0.
This package includes one pre-built Kibana dashboard:
| Name | Description |
|---|---|
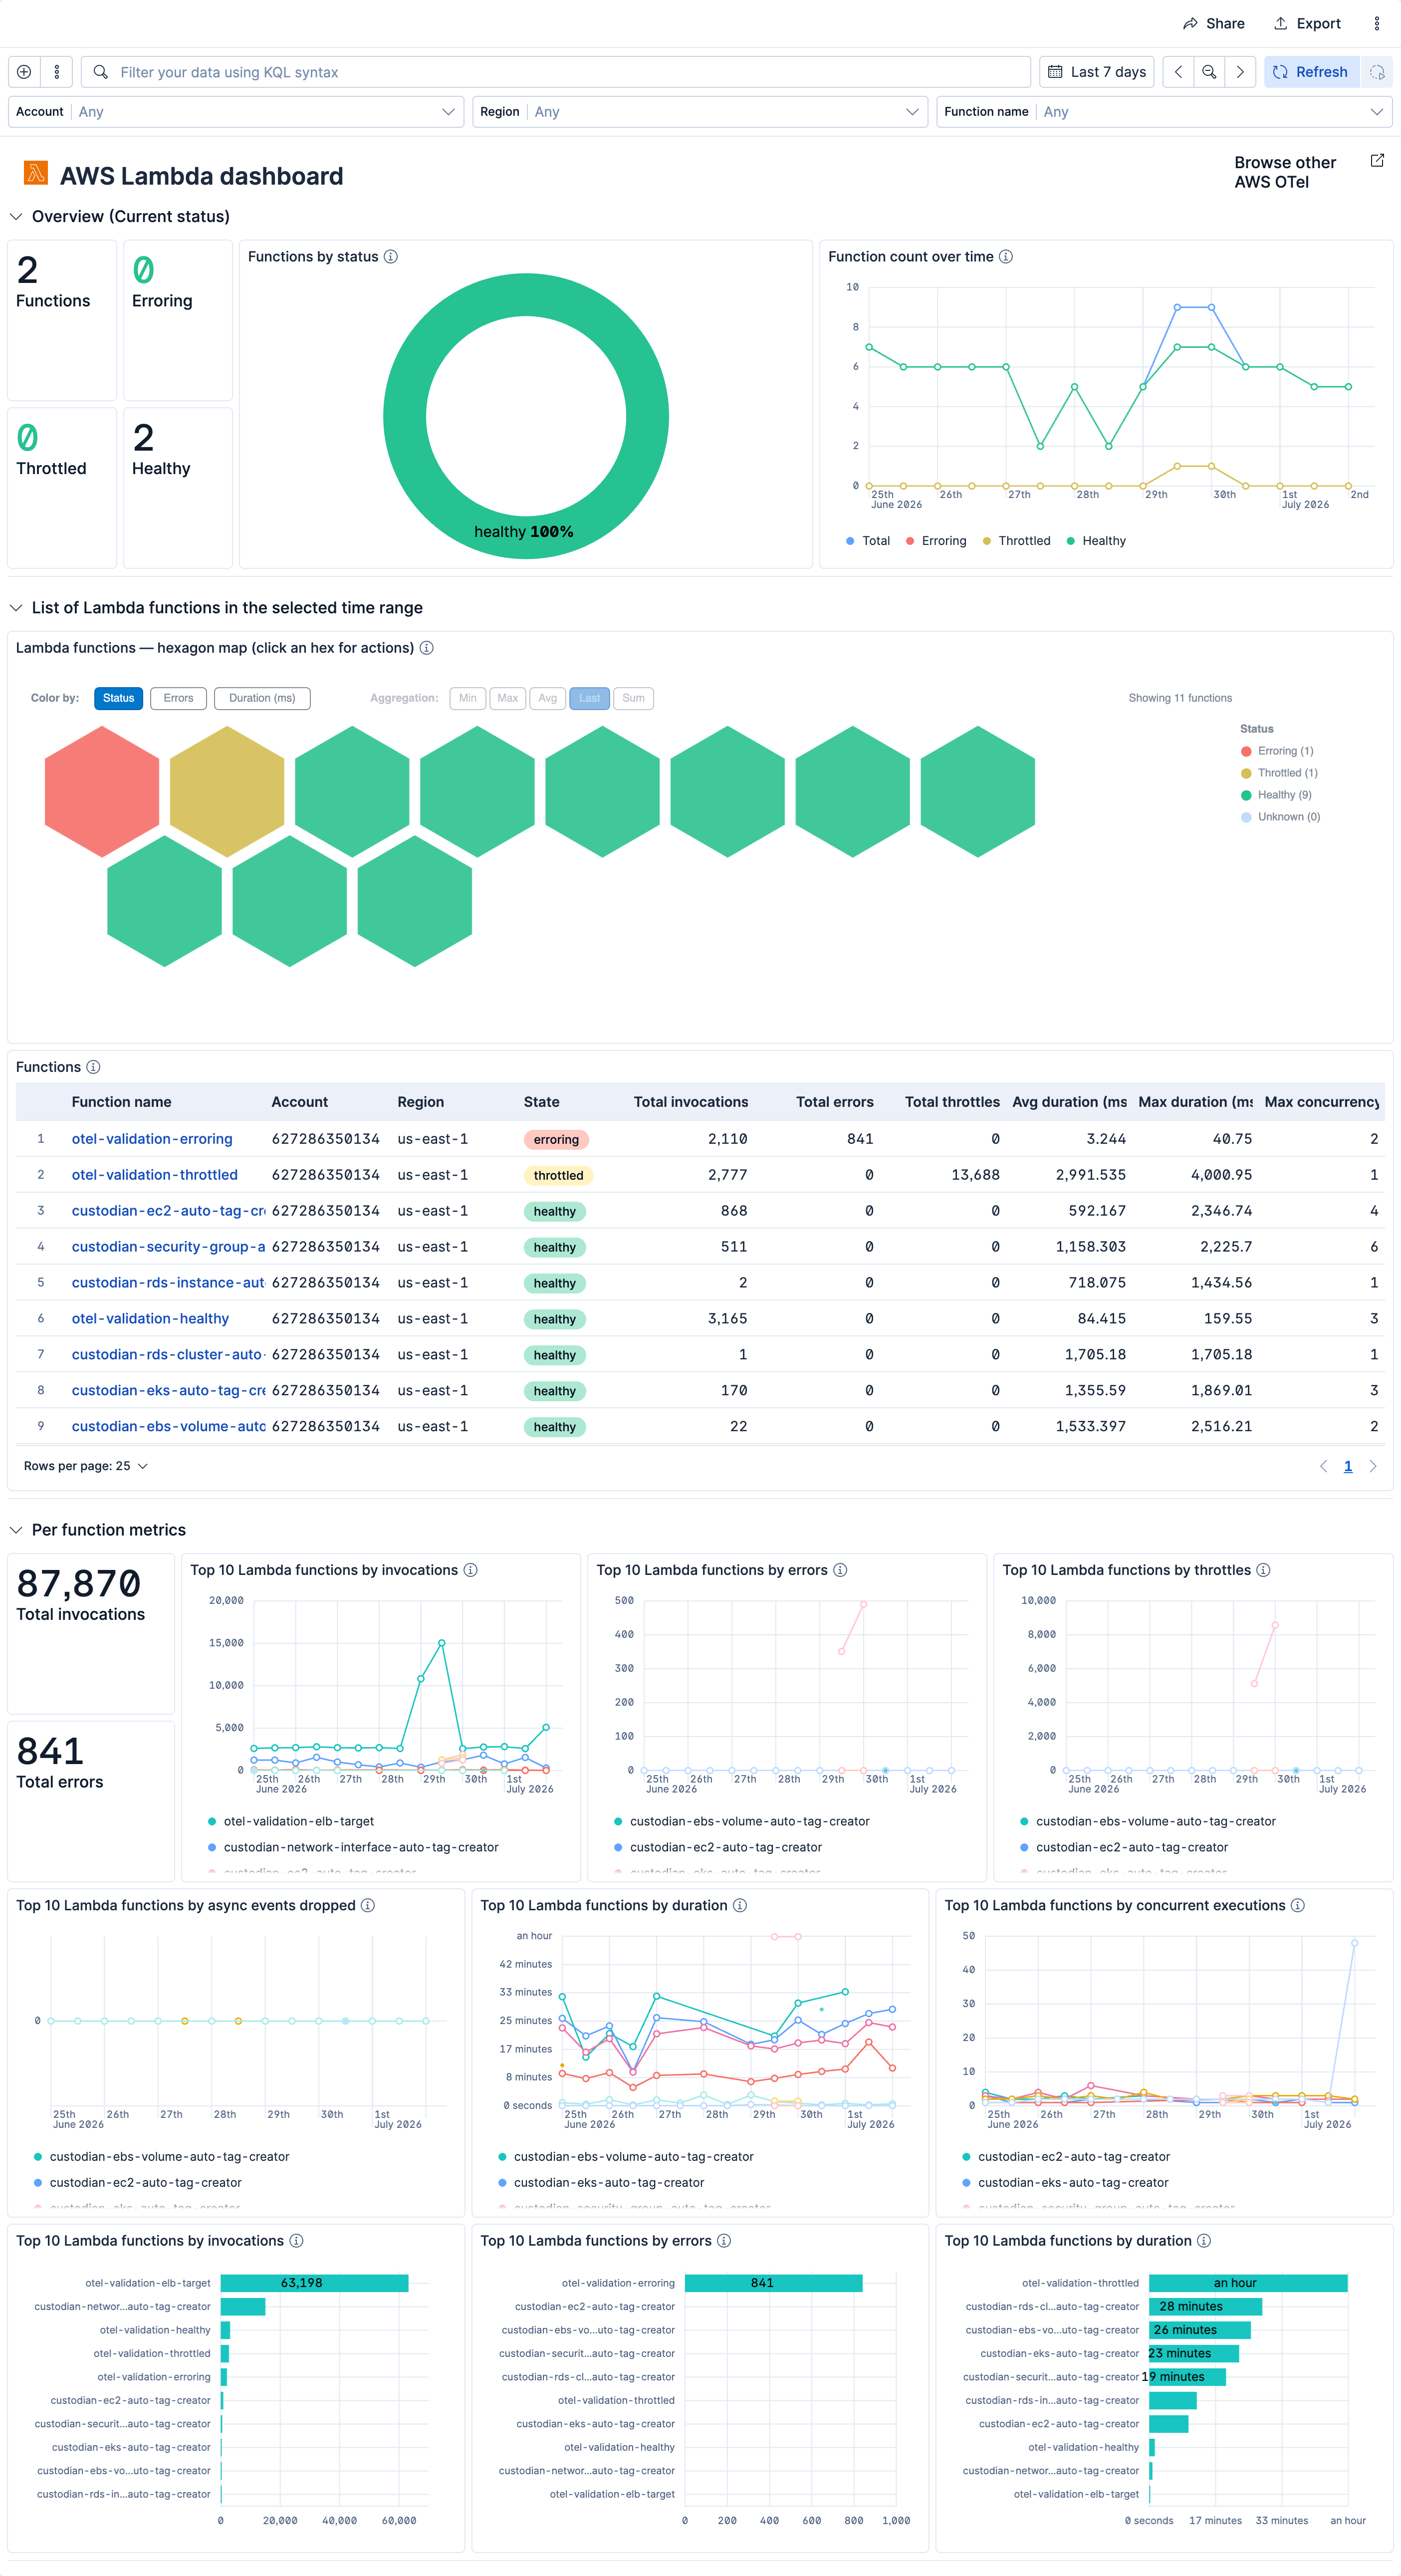
| [AWS Lambda OTel] Metrics | AWS Lambda dashboard for CloudWatch metrics collected by the OpenTelemetry Collector. |
Alert rule templates provide pre-defined configurations for creating alert rules in Kibana.
For more information, refer to the Elastic documentation.
Alert rule templates require Elastic Stack version 9.2.0 or later.
The following alert rule templates are available:
View the alert rule templates
| Name | Description |
|---|---|
| [AWS Lambda OTel] Dead letter errors | Alerts when Lambda fails to write events to the configured dead-letter queue, meaning failed events may be lost. |
| [AWS Lambda OTel] Destination delivery failures | Alerts when Lambda fails to deliver events to configured on-success or on-failure destinations. |
| [AWS Lambda OTel] High async event age | Alerts when async-invoked Lambda functions show high AsyncEventAge, indicating events are aging in the internal queue. |
| [AWS Lambda OTel] High concurrent executions | Alerts when peak concurrent executions approach capacity limits, predicting imminent throttling. |
| [AWS Lambda OTel] High average duration | Alerts when average Lambda invocation duration exceeds a configurable threshold over a 15-minute window. |
| [AWS Lambda OTel] High tail duration | Alerts when peak (Maximum) Lambda invocation duration exceeds a configurable threshold, indicating slow handler execution or downstream latency. |
| [AWS Lambda OTel] High error rate | Alerts when a Lambda function exceeds a configurable error rate (Errors / Invocations) over a 15-minute window. Evaluates the top 10 functions by error rate. |
| [AWS Lambda OTel] High iterator age | Alerts when stream-based Lambda consumers show high IteratorAge, indicating the function is falling behind the record arrival rate. |
| [AWS Lambda OTel] High throttle rate | Alerts when a Lambda function exceeds a configurable throttle rate (Throttles / (Invocations + Throttles)) over a 15-minute window. |
SLO templates provide pre-defined configurations for creating SLOs in Kibana.
For more information, refer to the Elastic documentation.
SLO templates require Elastic Stack version 9.4.0 or later.
The following SLO templates are available:
View the SLO templates
| Name | Description |
|---|---|
| [AWS Lambda OTel] Average duration 99.5% rolling 30 days | Tracks per-function execution latency from CloudWatch Duration (Average statistic). Each 1-minute window is good when average duration stays below 3000 ms; 99.5% of windows must be good over a rolling 30-day period. Sustained duration regressions degrade user-facing response times and increase Lambda billing. |
| [AWS Lambda OTel] Invocation success rate 99.5% rolling 30 days | Tracks per-function invocation reliability from CloudWatch Errors and Invocations (Sum statistics). Each 1-minute window is good when the error rate is below 0.5%; 99.5% of windows must be good over a rolling 30-day period. Rising error rates indicate function code failures that directly break synchronous and asynchronous workloads. |
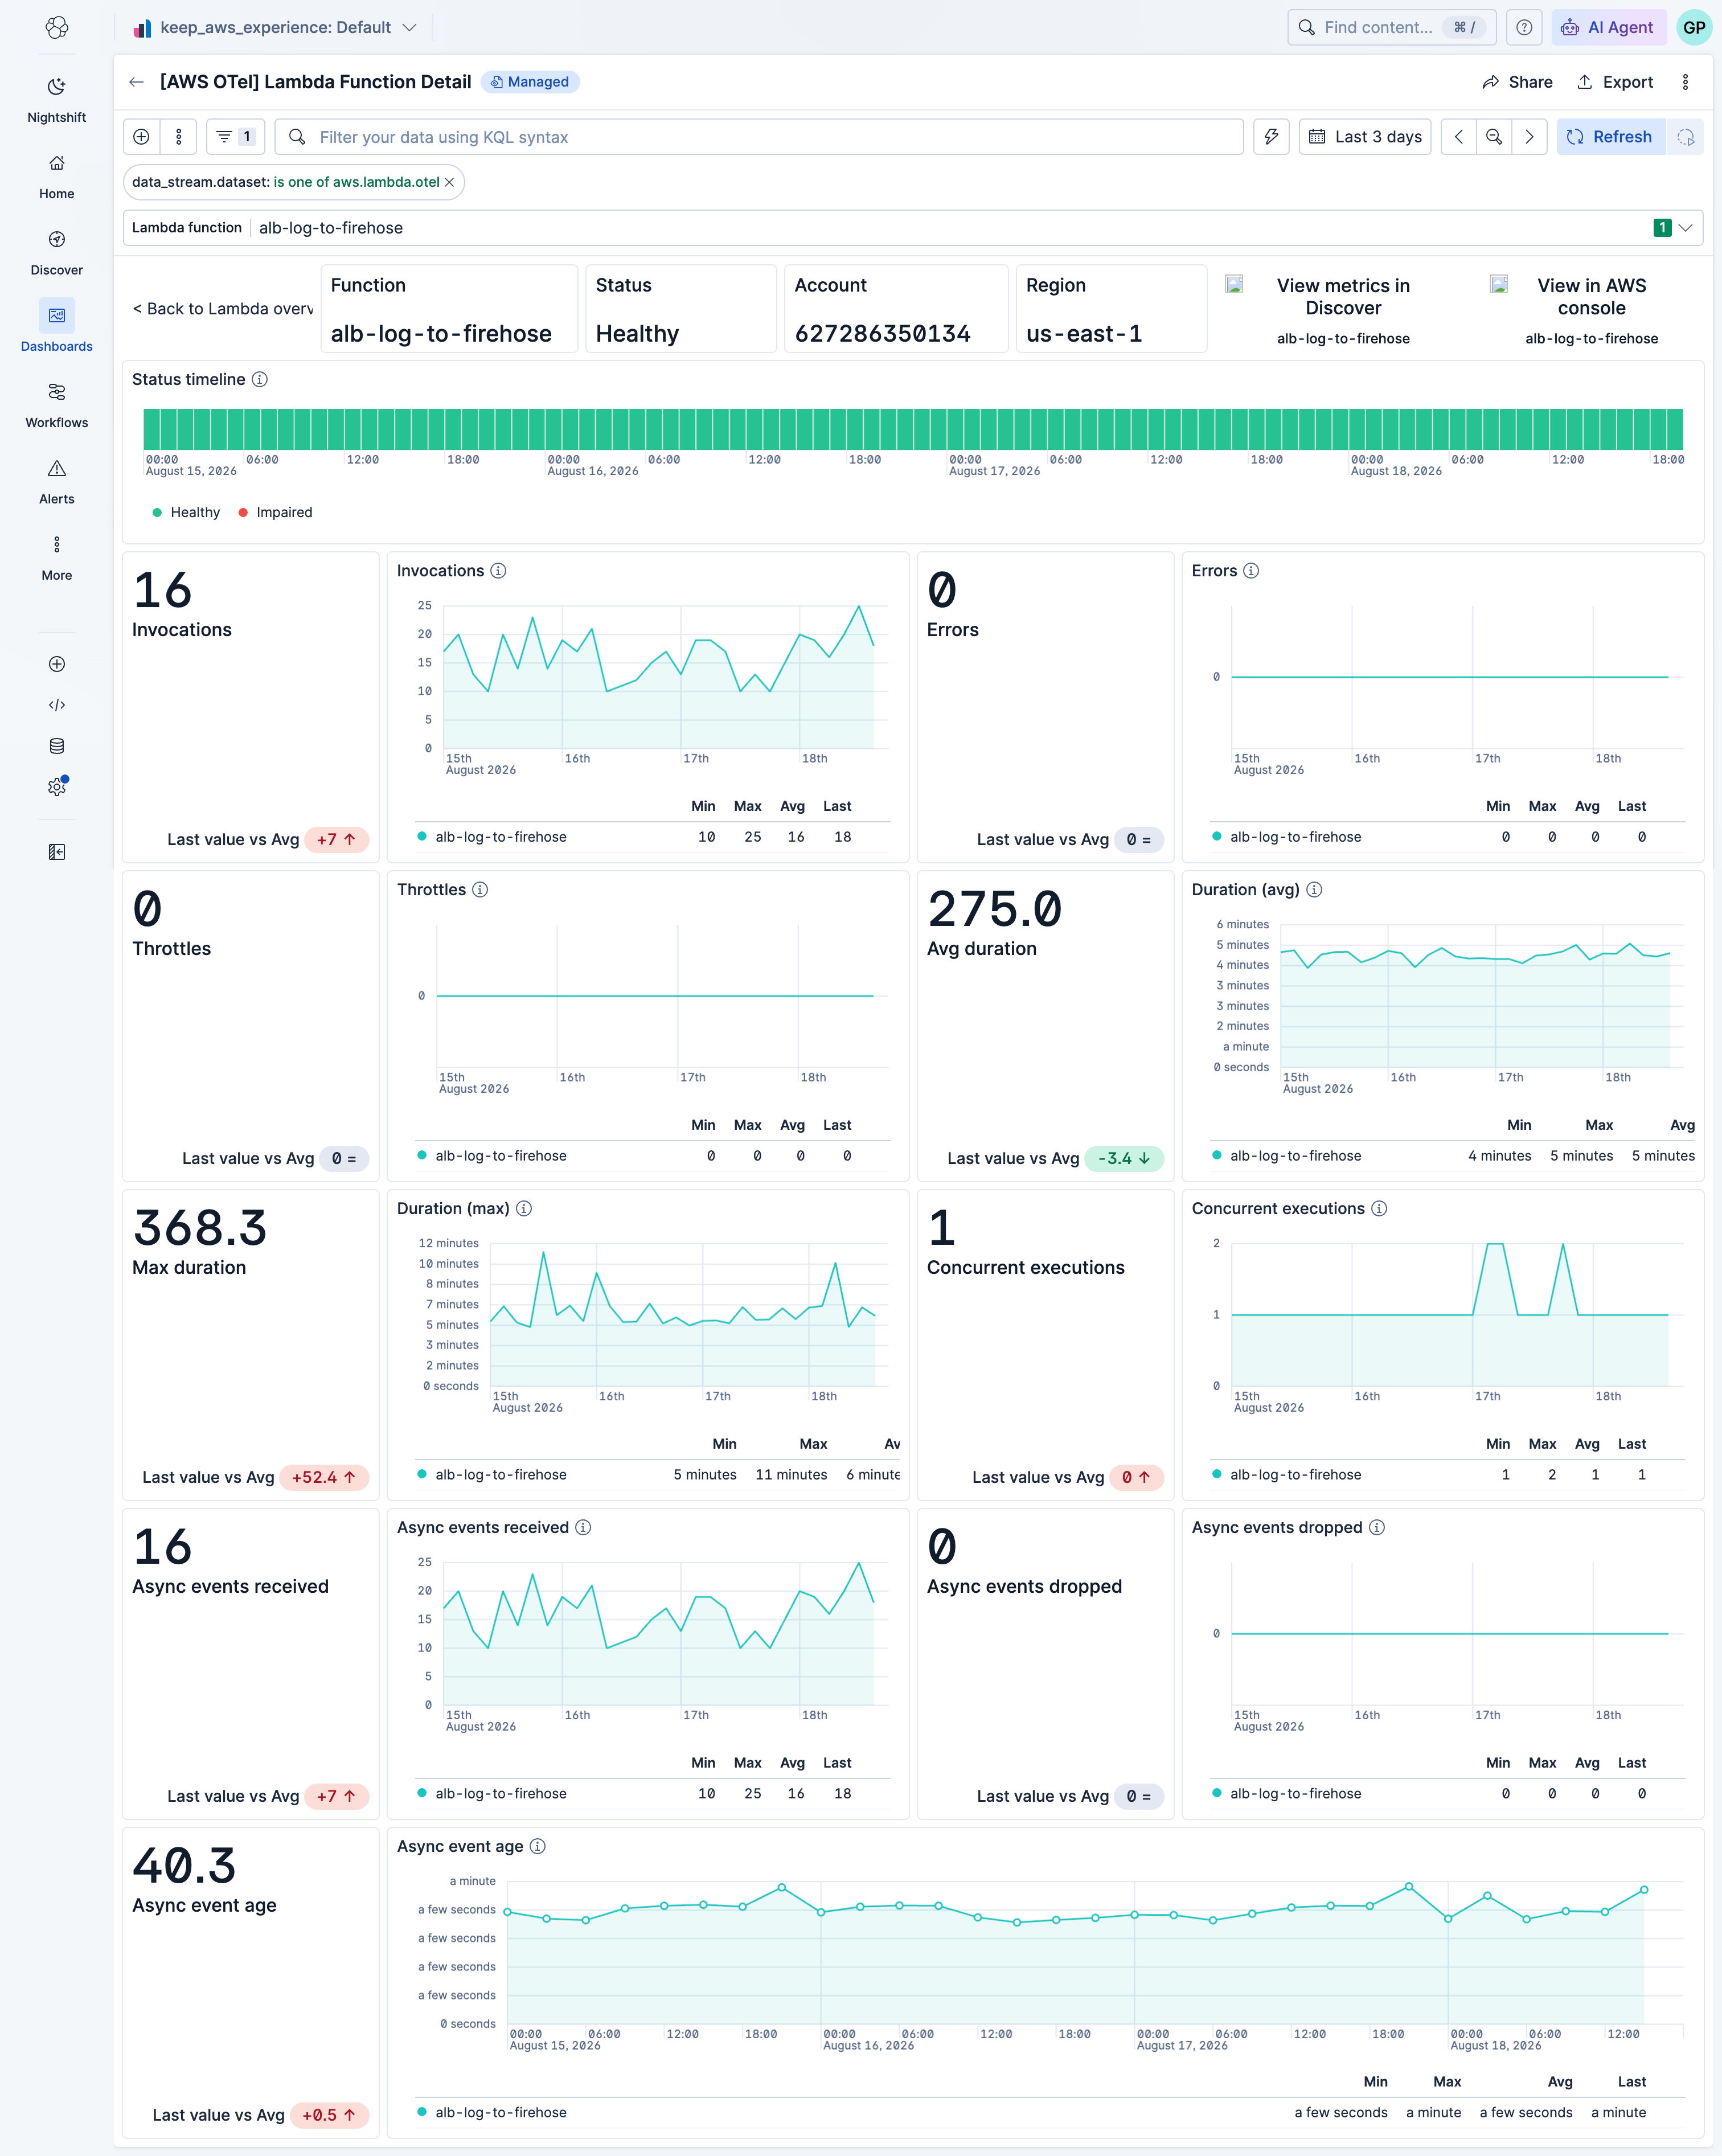
This integration includes one or more Kibana dashboards that visualizes the data collected by the integration. The screenshots below illustrate how the ingested data is displayed.
Changelog
| Version | Details | Minimum Kibana version |
|---|---|---|
| 0.12.0 | Bug fix (View pull request) Replace the deprecated popout icon with external so dashboard navigation cards render correctly. |
9.5.0 |
| 0.11.0 | Enhancement (View pull request) Add Lambda function detail dashboard with drilldowns from the overview dashboard. |
9.5.0 |
| 0.10.0 | Enhancement (View pull request) Add ML anomaly detection modules for Lambda function performance (duration, concurrency) and errors/throttles. Enhancement (View pull request) Add ml_module to the Kibana asset tags. |
9.5.0 |
| 0.9.0 | Enhancement (View pull request) Add tags to Kibana assets |
9.5.0 |
| 0.8.1 | Enhancement (View pull request) Rename the dashboard to "[AWS Lambda OTel] Metrics". |
9.5.0 |
| 0.8.0 | Enhancement (View pull request) Remove the idle card and merge idle into "Unknown" across Lambda dashboard panels. |
9.5.0 |
| 0.7.0 | Enhancement (View pull request) Improve ESQL queries in dashboards |
9.5.0 |
| 0.6.0 | Enhancement (View pull request) Add _dev/build/docs/README.md |
9.5.0 |
| 0.5.0 | Enhancement (View pull request) Improve dashboard queries and visualizations |
9.5.0 |
| 0.4.0 | Enhancement (View pull request) Update aggregation function and remove division by zero in SLO metric filter. |
9.5.0 |
| 0.3.0 | Enhancement (View pull request) Add alert rules and SLOs to README |
9.5.0 |
| 0.2.1 | Enhancement (View pull request) Standardize the package title and description to the AWS <service> <signal> OpenTelemetry Assets naming convention. |
9.5.0 |
| 0.2.0 | Enhancement (View pull request) Create new SLO and Alert assets |
9.5.0 |
| 0.1.0 | Enhancement (View pull request) Initial AWS Lambda OpenTelemetry metrics dashboard package |
9.5.0 |