Elasticsearch
The Elastic Stack includes Elastic's core products such as Elasticsearch, Kibana, Logstash, and Beats. Availability This functionality is generally available and ready for production usage. Unless stated otherwise on the page, this functionality is available when your Elastic Stack is deployed on Elastic Cloud Hosted, Elastic Cloud Enterprise, Elastic Cloud on Kubernetes, and self-managed environments. This documentation corresponds to the latest patch available for each minor version. If you're not using the latest patch, check the release notes for changes.
Stack
9.0+
Generally available since 9.0
| Version | 1.23.3 (View all) |
| Subscription level What's this? |
Basic |
| Ingestion method(s) | API, File |
| Minimum Kibana version(s) | 9.0.0 8.11.2 |
The elasticsearch package collects metrics and logs of Elasticsearch.
The elasticsearch package can monitor Elasticsearch 8.5.0 and later.
Configure the var.paths setting to point to JSON logs.
Exported fields
| Field | Description | Type |
|---|---|---|
| @timestamp | Event timestamp. | date |
| data_stream.dataset | Data stream dataset. | constant_keyword |
| data_stream.namespace | Data stream namespace. | constant_keyword |
| data_stream.type | Data stream type. | constant_keyword |
| ecs.version | ECS version this event conforms to. ecs.version is a required field and must exist in all events. When querying across multiple indices -- which may conform to slightly different ECS versions -- this field lets integrations adjust to the schema version of the events. |
keyword |
| elasticsearch.audit.action | The name of the action that was executed | keyword |
| elasticsearch.audit.authentication.type | keyword | |
| elasticsearch.audit.component | keyword | |
| elasticsearch.audit.event_type | The type of event that occurred: anonymous_access_denied, authentication_failed, access_denied, access_granted, connection_granted, connection_denied, tampered_request, run_as_granted, run_as_denied | keyword |
| elasticsearch.audit.indices | Indices accessed by action | keyword |
| elasticsearch.audit.invalidate.apikeys.owned_by_authenticated_user | boolean | |
| elasticsearch.audit.layer | The layer from which this event originated: rest, transport or ip_filter | keyword |
| elasticsearch.audit.message | text | |
| elasticsearch.audit.opaque_id | keyword | |
| elasticsearch.audit.origin.type | Where the request originated: rest (request originated from a REST API request), transport (request was received on the transport channel), local_node (the local node issued the request) | keyword |
| elasticsearch.audit.realm | The authentication realm the authentication was validated against | keyword |
| elasticsearch.audit.request.id | Unique ID of request | keyword |
| elasticsearch.audit.request.name | The type of request that was executed | keyword |
| elasticsearch.audit.url.params | REST URI parameters | keyword |
| elasticsearch.audit.user.realm | The user's authentication realm, if authenticated | keyword |
| elasticsearch.audit.user.roles | Roles to which the principal belongs | keyword |
| elasticsearch.audit.user.run_as.name | keyword | |
| elasticsearch.audit.user.run_as.realm | keyword | |
| elasticsearch.cluster.name | Name of the cluster | keyword |
| elasticsearch.cluster.uuid | UUID of the cluster | keyword |
| elasticsearch.component | Elasticsearch component from where the log event originated | keyword |
| elasticsearch.index.id | Index id | keyword |
| elasticsearch.index.name | Index name | keyword |
| elasticsearch.node.id | ID of the node | keyword |
| elasticsearch.node.name | Name of the node | keyword |
| elasticsearch.shard.id | Id of the shard | keyword |
| event.created | event.created contains the date/time when the event was first read by an agent, or by your pipeline. This field is distinct from @timestamp in that @timestamp typically contain the time extracted from the original event. In most situations, these two timestamps will be slightly different. The difference can be used to calculate the delay between your source generating an event, and the time when your agent first processed it. This can be used to monitor your agent's or pipeline's ability to keep up with your event source. In case the two timestamps are identical, @timestamp should be used. | date |
| event.ingested | Timestamp when an event arrived in the central data store. This is different from @timestamp, which is when the event originally occurred. It's also different from event.created, which is meant to capture the first time an agent saw the event. In normal conditions, assuming no tampering, the timestamps should chronologically look like this: @timestamp < event.created < event.ingested. |
date |
| event.module | Event module | constant_keyword |
| http | Fields related to HTTP activity. Use the url field set to store the url of the request. |
group |
| http.request.body.content | The full HTTP request body. | wildcard |
| http.request.body.content.text | Multi-field of http.request.body.content. |
match_only_text |
| http.request.id | A unique identifier for each HTTP request to correlate logs between clients and servers in transactions. The id may be contained in a non-standard HTTP header, such as X-Request-ID or X-Correlation-ID. |
keyword |
| http.request.method | HTTP request method. The value should retain its casing from the original event. For example, GET, get, and GeT are all considered valid values for this field. |
keyword |
| input.type | keyword | |
| log.file.path | Full path to the log file this event came from, including the file name. It should include the drive letter, when appropriate. If the event wasn't read from a log file, do not populate this field. | keyword |
| log.level | Original log level of the log event. If the source of the event provides a log level or textual severity, this is the one that goes in log.level. If your source doesn't specify one, you may put your event transport's severity here (e.g. Syslog severity). Some examples are warn, err, i, informational. |
keyword |
| log.offset | long | |
| message | For log events the message field contains the log message, optimized for viewing in a log viewer. For structured logs without an original message field, other fields can be concatenated to form a human-readable summary of the event. If multiple messages exist, they can be combined into one message. | match_only_text |
| related.user | keyword | |
| service.type | The type of the service data is collected from. The type can be used to group and correlate logs and metrics from one service type. Example: If logs or metrics are collected from Elasticsearch, service.type would be elasticsearch. |
keyword |
| source | Source fields capture details about the sender of a network exchange/packet. These fields are populated from a network event, packet, or other event containing details of a network transaction. Source fields are usually populated in conjunction with destination fields. The source and destination fields are considered the baseline and should always be filled if an event contains source and destination details from a network transaction. If the event also contains identification of the client and server roles, then the client and server fields should also be populated. | group |
| source.address | Some event source addresses are defined ambiguously. The event will sometimes list an IP, a domain or a unix socket. You should always store the raw address in the .address field. Then it should be duplicated to .ip or .domain, depending on which one it is. |
keyword |
| source.ip | IP address of the source (IPv4 or IPv6). | ip |
| source.port | Port of the source. | long |
| trace.id | Unique identifier of the trace. A trace groups multiple events like transactions that belong together. For example, a user request handled by multiple inter-connected services. | keyword |
| url | URL fields provide support for complete or partial URLs, and supports the breaking down into scheme, domain, path, and so on. | group |
| url.original | Unmodified original url as seen in the event source. Note that in network monitoring, the observed URL may be a full URL, whereas in access logs, the URL is often just represented as a path. This field is meant to represent the URL as it was observed, complete or not. | wildcard |
| url.original.text | Multi-field of url.original. |
match_only_text |
| user | The user fields describe information about the user that is relevant to the event. Fields can have one entry or multiple entries. If a user has more than one id, provide an array that includes all of them. | group |
| user.name | Short name or login of the user. | keyword |
| user.name.text | Multi-field of user.name. |
match_only_text |
Exported fields
| Field | Description | Type |
|---|---|---|
| @timestamp | Event timestamp. | date |
| data_stream.dataset | Data stream dataset. | constant_keyword |
| data_stream.namespace | Data stream namespace. | constant_keyword |
| data_stream.type | Data stream type. | constant_keyword |
| ecs.version | ECS version this event conforms to. ecs.version is a required field and must exist in all events. When querying across multiple indices -- which may conform to slightly different ECS versions -- this field lets integrations adjust to the schema version of the events. |
keyword |
| elasticsearch.cluster.name | Name of the cluster | keyword |
| elasticsearch.cluster.uuid | UUID of the cluster | keyword |
| elasticsearch.component | Elasticsearch component from where the log event originated | keyword |
| elasticsearch.elastic_product_origin | keyword | |
| elasticsearch.event.category | keyword | |
| elasticsearch.http.request.x_opaque_id | keyword | |
| elasticsearch.index.id | Index id | keyword |
| elasticsearch.index.name | Index name | keyword |
| elasticsearch.node.id | ID of the node | keyword |
| elasticsearch.node.name | Name of the node | keyword |
| elasticsearch.shard.id | Id of the shard | keyword |
| event.category | This is one of four ECS Categorization Fields, and indicates the second level in the ECS category hierarchy. event.category represents the "big buckets" of ECS categories. For example, filtering on event.category:process yields all events relating to process activity. This field is closely related to event.type, which is used as a subcategory. This field is an array. This will allow proper categorization of some events that fall in multiple categories. |
keyword |
| event.created | event.created contains the date/time when the event was first read by an agent, or by your pipeline. This field is distinct from @timestamp in that @timestamp typically contain the time extracted from the original event. In most situations, these two timestamps will be slightly different. The difference can be used to calculate the delay between your source generating an event, and the time when your agent first processed it. This can be used to monitor your agent's or pipeline's ability to keep up with your event source. In case the two timestamps are identical, @timestamp should be used. | date |
| event.ingested | Timestamp when an event arrived in the central data store. This is different from @timestamp, which is when the event originally occurred. It's also different from event.created, which is meant to capture the first time an agent saw the event. In normal conditions, assuming no tampering, the timestamps should chronologically look like this: @timestamp < event.created < event.ingested. |
date |
| event.kind | This is one of four ECS Categorization Fields, and indicates the highest level in the ECS category hierarchy. event.kind gives high-level information about what type of information the event contains, without being specific to the contents of the event. For example, values of this field distinguish alert events from metric events. The value of this field can be used to inform how these kinds of events should be handled. They may warrant different retention, different access control, it may also help understand whether the data coming in at a regular interval or not. |
keyword |
| event.module | Event module | constant_keyword |
| event.original | Raw text message of entire event. Used to demonstrate log integrity or where the full log message (before splitting it up in multiple parts) may be required, e.g. for reindex. This field is not indexed and doc_values are disabled. It cannot be searched, but it can be retrieved from _source. If users wish to override this and index this field, please see Field data types in the Elasticsearch Reference. |
keyword |
| event.type | This is one of four ECS Categorization Fields, and indicates the third level in the ECS category hierarchy. event.type represents a categorization "sub-bucket" that, when used along with the event.category field values, enables filtering events down to a level appropriate for single visualization. This field is an array. This will allow proper categorization of some events that fall in multiple event types. |
keyword |
| host.ip | Host ip addresses. | ip |
| input.type | keyword | |
| log.file.path | Full path to the log file this event came from, including the file name. It should include the drive letter, when appropriate. If the event wasn't read from a log file, do not populate this field. | keyword |
| log.level | Original log level of the log event. If the source of the event provides a log level or textual severity, this is the one that goes in log.level. If your source doesn't specify one, you may put your event transport's severity here (e.g. Syslog severity). Some examples are warn, err, i, informational. |
keyword |
| log.logger | The name of the logger inside an application. This is usually the name of the class which initialized the logger, or can be a custom name. | keyword |
| log.offset | long | |
| message | For log events the message field contains the log message, optimized for viewing in a log viewer. For structured logs without an original message field, other fields can be concatenated to form a human-readable summary of the event. If multiple messages exist, they can be combined into one message. | match_only_text |
| process.thread.name | Thread name. | keyword |
| service.name | Name of the service data is collected from. The name of the service is normally user given. This allows for distributed services that run on multiple hosts to correlate the related instances based on the name. In the case of Elasticsearch the service.name could contain the cluster name. For Beats the service.name is by default a copy of the service.type field if no name is specified. |
keyword |
| service.type | The type of the service data is collected from. The type can be used to group and correlate logs and metrics from one service type. Example: If logs or metrics are collected from Elasticsearch, service.type would be elasticsearch. |
keyword |
| trace.id | Unique identifier of the trace. A trace groups multiple events like transactions that belong together. For example, a user request handled by multiple inter-connected services. | keyword |
Exported fields
| Field | Description | Type |
|---|---|---|
| @timestamp | Event timestamp. | date |
| data_stream.dataset | Data stream dataset. | constant_keyword |
| data_stream.namespace | Data stream namespace. | constant_keyword |
| data_stream.type | Data stream type. | constant_keyword |
| ecs.version | ECS version this event conforms to. ecs.version is a required field and must exist in all events. When querying across multiple indices -- which may conform to slightly different ECS versions -- this field lets integrations adjust to the schema version of the events. |
keyword |
| elasticsearch.cluster.name | Name of the cluster | keyword |
| elasticsearch.cluster.uuid | UUID of the cluster | keyword |
| elasticsearch.component | Elasticsearch component from where the log event originated | keyword |
| elasticsearch.gc.heap.size_kb | Total heap size in kilobytes. | integer |
| elasticsearch.gc.heap.used_kb | Used heap in kilobytes. | integer |
| elasticsearch.gc.jvm_runtime_sec | The time from JVM start up in seconds, as a floating point number. | float |
| elasticsearch.gc.old_gen.size_kb | Total size of old generation in kilobytes. | integer |
| elasticsearch.gc.old_gen.used_kb | Old generation occupancy in kilobytes. | integer |
| elasticsearch.gc.phase.class_unload_time_sec | Time spent unloading unused classes in seconds. | float |
| elasticsearch.gc.phase.cpu_time.real_sec | Total elapsed CPU time spent to complete the collection from start to finish. | float |
| elasticsearch.gc.phase.cpu_time.sys_sec | CPU time spent inside the kernel. | float |
| elasticsearch.gc.phase.cpu_time.user_sec | CPU time spent outside the kernel. | float |
| elasticsearch.gc.phase.duration_sec | Collection phase duration according to the Java virtual machine. | float |
| elasticsearch.gc.phase.name | Name of the GC collection phase. | keyword |
| elasticsearch.gc.phase.parallel_rescan_time_sec | Time spent in seconds marking live objects while application is stopped. | float |
| elasticsearch.gc.phase.scrub_string_table_time_sec | Pause time in seconds cleaning up string tables. | float |
| elasticsearch.gc.phase.scrub_symbol_table_time_sec | Pause time in seconds cleaning up symbol tables. | float |
| elasticsearch.gc.phase.weak_refs_processing_time_sec | Time spent processing weak references in seconds. | float |
| elasticsearch.gc.stopping_threads_time_sec | Time took to stop threads seconds. | float |
| elasticsearch.gc.tags | GC logging tags. | keyword |
| elasticsearch.gc.threads_total_stop_time_sec | Garbage collection threads total stop time seconds. | float |
| elasticsearch.gc.young_gen.size_kb | Total size of young generation in kilobytes. | integer |
| elasticsearch.gc.young_gen.used_kb | Young generation occupancy in kilobytes. | integer |
| elasticsearch.index.id | Index id | keyword |
| elasticsearch.index.name | Index name | keyword |
| elasticsearch.node.id | ID of the node | keyword |
| elasticsearch.node.name | Name of the node | keyword |
| elasticsearch.shard.id | Id of the shard | keyword |
| event.category | This is one of four ECS Categorization Fields, and indicates the second level in the ECS category hierarchy. event.category represents the "big buckets" of ECS categories. For example, filtering on event.category:process yields all events relating to process activity. This field is closely related to event.type, which is used as a subcategory. This field is an array. This will allow proper categorization of some events that fall in multiple categories. |
keyword |
| event.created | event.created contains the date/time when the event was first read by an agent, or by your pipeline. This field is distinct from @timestamp in that @timestamp typically contain the time extracted from the original event. In most situations, these two timestamps will be slightly different. The difference can be used to calculate the delay between your source generating an event, and the time when your agent first processed it. This can be used to monitor your agent's or pipeline's ability to keep up with your event source. In case the two timestamps are identical, @timestamp should be used. | date |
| event.ingested | Timestamp when an event arrived in the central data store. This is different from @timestamp, which is when the event originally occurred. It's also different from event.created, which is meant to capture the first time an agent saw the event. In normal conditions, assuming no tampering, the timestamps should chronologically look like this: @timestamp < event.created < event.ingested. |
date |
| event.kind | This is one of four ECS Categorization Fields, and indicates the highest level in the ECS category hierarchy. event.kind gives high-level information about what type of information the event contains, without being specific to the contents of the event. For example, values of this field distinguish alert events from metric events. The value of this field can be used to inform how these kinds of events should be handled. They may warrant different retention, different access control, it may also help understand whether the data coming in at a regular interval or not. |
keyword |
| event.module | Event module | constant_keyword |
| event.original | Raw text message of entire event. Used to demonstrate log integrity or where the full log message (before splitting it up in multiple parts) may be required, e.g. for reindex. This field is not indexed and doc_values are disabled. It cannot be searched, but it can be retrieved from _source. If users wish to override this and index this field, please see Field data types in the Elasticsearch Reference. |
keyword |
| event.type | This is one of four ECS Categorization Fields, and indicates the third level in the ECS category hierarchy. event.type represents a categorization "sub-bucket" that, when used along with the event.category field values, enables filtering events down to a level appropriate for single visualization. This field is an array. This will allow proper categorization of some events that fall in multiple event types. |
keyword |
| host.ip | Host ip addresses. | ip |
| input.type | keyword | |
| log.file.path | Full path to the log file this event came from, including the file name. It should include the drive letter, when appropriate. If the event wasn't read from a log file, do not populate this field. | keyword |
| log.level | Original log level of the log event. If the source of the event provides a log level or textual severity, this is the one that goes in log.level. If your source doesn't specify one, you may put your event transport's severity here (e.g. Syslog severity). Some examples are warn, err, i, informational. |
keyword |
| log.offset | long | |
| message | For log events the message field contains the log message, optimized for viewing in a log viewer. For structured logs without an original message field, other fields can be concatenated to form a human-readable summary of the event. If multiple messages exist, they can be combined into one message. | match_only_text |
| process.pid | Process id. | long |
| service.type | The type of the service data is collected from. The type can be used to group and correlate logs and metrics from one service type. Example: If logs or metrics are collected from Elasticsearch, service.type would be elasticsearch. |
keyword |
Exported fields
| Field | Description | Type |
|---|---|---|
| @timestamp | Event timestamp. | date |
| data_stream.dataset | Data stream dataset. | constant_keyword |
| data_stream.namespace | Data stream namespace. | constant_keyword |
| data_stream.type | Data stream type. | constant_keyword |
| ecs.version | ECS version this event conforms to. ecs.version is a required field and must exist in all events. When querying across multiple indices -- which may conform to slightly different ECS versions -- this field lets integrations adjust to the schema version of the events. |
keyword |
| elasticsearch.cluster.name | Name of the cluster | keyword |
| elasticsearch.cluster.uuid | UUID of the cluster | keyword |
| elasticsearch.component | Elasticsearch component from where the log event originated | keyword |
| elasticsearch.index.id | Index id | keyword |
| elasticsearch.index.name | Index name | keyword |
| elasticsearch.node.id | ID of the node | keyword |
| elasticsearch.node.name | Name of the node | keyword |
| elasticsearch.server.gc.collection_duration.ms | Time spent in GC, in milliseconds | float |
| elasticsearch.server.gc.observation_duration.ms | Total time over which collection was observed, in milliseconds | float |
| elasticsearch.server.gc.overhead_seq | Sequence number | long |
| elasticsearch.server.gc.young.one | long | |
| elasticsearch.server.gc.young.two | long | |
| elasticsearch.server.stacktrace | keyword | |
| elasticsearch.server.tags | keyword | |
| elasticsearch.server.trace.id | keyword | |
| elasticsearch.shard.id | Id of the shard | keyword |
| event.category | This is one of four ECS Categorization Fields, and indicates the second level in the ECS category hierarchy. event.category represents the "big buckets" of ECS categories. For example, filtering on event.category:process yields all events relating to process activity. This field is closely related to event.type, which is used as a subcategory. This field is an array. This will allow proper categorization of some events that fall in multiple categories. |
keyword |
| event.created | event.created contains the date/time when the event was first read by an agent, or by your pipeline. This field is distinct from @timestamp in that @timestamp typically contain the time extracted from the original event. In most situations, these two timestamps will be slightly different. The difference can be used to calculate the delay between your source generating an event, and the time when your agent first processed it. This can be used to monitor your agent's or pipeline's ability to keep up with your event source. In case the two timestamps are identical, @timestamp should be used. | date |
| event.ingested | Timestamp when an event arrived in the central data store. This is different from @timestamp, which is when the event originally occurred. It's also different from event.created, which is meant to capture the first time an agent saw the event. In normal conditions, assuming no tampering, the timestamps should chronologically look like this: @timestamp < event.created < event.ingested. |
date |
| event.kind | This is one of four ECS Categorization Fields, and indicates the highest level in the ECS category hierarchy. event.kind gives high-level information about what type of information the event contains, without being specific to the contents of the event. For example, values of this field distinguish alert events from metric events. The value of this field can be used to inform how these kinds of events should be handled. They may warrant different retention, different access control, it may also help understand whether the data coming in at a regular interval or not. |
keyword |
| event.module | Event module | constant_keyword |
| event.original | Raw text message of entire event. Used to demonstrate log integrity or where the full log message (before splitting it up in multiple parts) may be required, e.g. for reindex. This field is not indexed and doc_values are disabled. It cannot be searched, but it can be retrieved from _source. If users wish to override this and index this field, please see Field data types in the Elasticsearch Reference. |
keyword |
| event.type | This is one of four ECS Categorization Fields, and indicates the third level in the ECS category hierarchy. event.type represents a categorization "sub-bucket" that, when used along with the event.category field values, enables filtering events down to a level appropriate for single visualization. This field is an array. This will allow proper categorization of some events that fall in multiple event types. |
keyword |
| host.ip | Host ip addresses. | ip |
| input.type | keyword | |
| log.file.path | Full path to the log file this event came from, including the file name. It should include the drive letter, when appropriate. If the event wasn't read from a log file, do not populate this field. | keyword |
| log.level | Original log level of the log event. If the source of the event provides a log level or textual severity, this is the one that goes in log.level. If your source doesn't specify one, you may put your event transport's severity here (e.g. Syslog severity). Some examples are warn, err, i, informational. |
keyword |
| log.logger | The name of the logger inside an application. This is usually the name of the class which initialized the logger, or can be a custom name. | keyword |
| log.offset | long | |
| message | For log events the message field contains the log message, optimized for viewing in a log viewer. For structured logs without an original message field, other fields can be concatenated to form a human-readable summary of the event. If multiple messages exist, they can be combined into one message. | match_only_text |
| process.thread.name | Thread name. | keyword |
| server.name | keyword | |
| server.type | keyword | |
| service.name | Name of the service data is collected from. The name of the service is normally user given. This allows for distributed services that run on multiple hosts to correlate the related instances based on the name. In the case of Elasticsearch the service.name could contain the cluster name. For Beats the service.name is by default a copy of the service.type field if no name is specified. |
keyword |
| service.type | The type of the service data is collected from. The type can be used to group and correlate logs and metrics from one service type. Example: If logs or metrics are collected from Elasticsearch, service.type would be elasticsearch. |
keyword |
| trace.id | Unique identifier of the trace. A trace groups multiple events like transactions that belong together. For example, a user request handled by multiple inter-connected services. | keyword |
Exported fields
| Field | Description | Type |
|---|---|---|
| @timestamp | Event timestamp. | date |
| data_stream.dataset | Data stream dataset. | constant_keyword |
| data_stream.namespace | Data stream namespace. | constant_keyword |
| data_stream.type | Data stream type. | constant_keyword |
| ecs.version | ECS version this event conforms to. ecs.version is a required field and must exist in all events. When querying across multiple indices -- which may conform to slightly different ECS versions -- this field lets integrations adjust to the schema version of the events. |
keyword |
| elasticsearch.cluster.name | Name of the cluster | keyword |
| elasticsearch.cluster.uuid | UUID of the cluster | keyword |
| elasticsearch.component | Elasticsearch component from where the log event originated | keyword |
| elasticsearch.index.id | Index id | keyword |
| elasticsearch.index.name | Index name | keyword |
| elasticsearch.node.id | ID of the node | keyword |
| elasticsearch.node.name | Name of the node | keyword |
| elasticsearch.shard.id | Id of the shard | keyword |
| elasticsearch.slowlog.extra_source | Extra source information | keyword |
| elasticsearch.slowlog.id | Id | keyword |
| elasticsearch.slowlog.logger | Logger name | keyword |
| elasticsearch.slowlog.routing | Routing | keyword |
| elasticsearch.slowlog.search_type | Search type | keyword |
| elasticsearch.slowlog.source | Source of document that was indexed | keyword |
| elasticsearch.slowlog.source_query | Slow query | keyword |
| elasticsearch.slowlog.stats | Stats groups | keyword |
| elasticsearch.slowlog.took | Time it took to execute the query | keyword |
| elasticsearch.slowlog.total_hits | Total hits | keyword |
| elasticsearch.slowlog.total_shards | Total queried shards | long |
| elasticsearch.slowlog.type | Type | keyword |
| elasticsearch.slowlog.types | Types | keyword |
| event.category | This is one of four ECS Categorization Fields, and indicates the second level in the ECS category hierarchy. event.category represents the "big buckets" of ECS categories. For example, filtering on event.category:process yields all events relating to process activity. This field is closely related to event.type, which is used as a subcategory. This field is an array. This will allow proper categorization of some events that fall in multiple categories. |
keyword |
| event.created | event.created contains the date/time when the event was first read by an agent, or by your pipeline. This field is distinct from @timestamp in that @timestamp typically contain the time extracted from the original event. In most situations, these two timestamps will be slightly different. The difference can be used to calculate the delay between your source generating an event, and the time when your agent first processed it. This can be used to monitor your agent's or pipeline's ability to keep up with your event source. In case the two timestamps are identical, @timestamp should be used. | date |
| event.ingested | Timestamp when an event arrived in the central data store. This is different from @timestamp, which is when the event originally occurred. It's also different from event.created, which is meant to capture the first time an agent saw the event. In normal conditions, assuming no tampering, the timestamps should chronologically look like this: @timestamp < event.created < event.ingested. |
date |
| event.kind | This is one of four ECS Categorization Fields, and indicates the highest level in the ECS category hierarchy. event.kind gives high-level information about what type of information the event contains, without being specific to the contents of the event. For example, values of this field distinguish alert events from metric events. The value of this field can be used to inform how these kinds of events should be handled. They may warrant different retention, different access control, it may also help understand whether the data coming in at a regular interval or not. |
keyword |
| event.module | Event module | constant_keyword |
| event.original | Raw text message of entire event. Used to demonstrate log integrity or where the full log message (before splitting it up in multiple parts) may be required, e.g. for reindex. This field is not indexed and doc_values are disabled. It cannot be searched, but it can be retrieved from _source. If users wish to override this and index this field, please see Field data types in the Elasticsearch Reference. |
keyword |
| event.type | This is one of four ECS Categorization Fields, and indicates the third level in the ECS category hierarchy. event.type represents a categorization "sub-bucket" that, when used along with the event.category field values, enables filtering events down to a level appropriate for single visualization. This field is an array. This will allow proper categorization of some events that fall in multiple event types. |
keyword |
| input.type | keyword | |
| log.file.path | Full path to the log file this event came from, including the file name. It should include the drive letter, when appropriate. If the event wasn't read from a log file, do not populate this field. | keyword |
| log.level | Original log level of the log event. If the source of the event provides a log level or textual severity, this is the one that goes in log.level. If your source doesn't specify one, you may put your event transport's severity here (e.g. Syslog severity). Some examples are warn, err, i, informational. |
keyword |
| log.logger | The name of the logger inside an application. This is usually the name of the class which initialized the logger, or can be a custom name. | keyword |
| log.offset | long | |
| message | For log events the message field contains the log message, optimized for viewing in a log viewer. For structured logs without an original message field, other fields can be concatenated to form a human-readable summary of the event. If multiple messages exist, they can be combined into one message. | match_only_text |
| process.thread.name | Thread name. | keyword |
| service.name | Name of the service data is collected from. The name of the service is normally user given. This allows for distributed services that run on multiple hosts to correlate the related instances based on the name. In the case of Elasticsearch the service.name could contain the cluster name. For Beats the service.name is by default a copy of the service.type field if no name is specified. |
keyword |
| service.type | The type of the service data is collected from. The type can be used to group and correlate logs and metrics from one service type. Example: If logs or metrics are collected from Elasticsearch, service.type would be elasticsearch. |
keyword |
| trace.id | Unique identifier of the trace. A trace groups multiple events like transactions that belong together. For example, a user request handled by multiple inter-connected services. | keyword |
Collects query logs emitted by Elasticsearch 9.4+.
Exported fields
| Field | Description | Type |
|---|---|---|
| @timestamp | Event timestamp. | date |
| auth.type | Authentication type for the query request | keyword |
| data_stream.dataset | Data stream dataset. | constant_keyword |
| data_stream.namespace | Data stream namespace. | constant_keyword |
| data_stream.type | Data stream type. | constant_keyword |
| ecs.version | ECS version this event conforms to. ecs.version is a required field and must exist in all events. When querying across multiple indices -- which may conform to slightly different ECS versions -- this field lets integrations adjust to the schema version of the events. |
keyword |
| elasticsearch.cluster.name | Name of the cluster | keyword |
| elasticsearch.cluster.uuid | UUID of the cluster | keyword |
| elasticsearch.component | Elasticsearch component from where the log event originated | keyword |
| elasticsearch.index.id | Index id | keyword |
| elasticsearch.index.name | Index name | keyword |
| elasticsearch.node.id | ID of the node | keyword |
| elasticsearch.node.name | Name of the node | keyword |
| elasticsearch.parent.node.id | Parent node id, present together with parent task id | keyword |
| elasticsearch.parent.task.id | Parent task id when the task has a parent | keyword |
| elasticsearch.querylog.clusters.failed | Failed cluster count when present in the cluster map | long |
| elasticsearch.querylog.clusters.partial | Partial cluster count when present in the cluster map | long |
| elasticsearch.querylog.clusters.remote_count | Number of remote clusters or distinct remote aliases | long |
| elasticsearch.querylog.clusters.remotes | Remote cluster aliases when remotes exist (DSL/ES|QL/EQL) | keyword |
| elasticsearch.querylog.clusters.running | Running cluster count when present in the cluster map | long |
| elasticsearch.querylog.clusters.skipped | Skipped cluster count when present in the cluster map | long |
| elasticsearch.querylog.clusters.successful | Successful cluster count when present in the cluster map | long |
| elasticsearch.querylog.clusters.total | Total cluster entries in the map (DSL and ES|QL only; not EQL) | long |
| elasticsearch.querylog.dsl.total_count | Total hits from TotalHits (DSL only, SearchLogProducer) | long |
| elasticsearch.querylog.dsl.total_count_partial | True when total hit relation is not EQUAL_TO | boolean |
| elasticsearch.querylog.esql.profile.analysis.took | ES|QL profile analysis phase duration in nanoseconds | long |
| elasticsearch.querylog.esql.profile.dependency_resolution.took | ES|QL profile dependency resolution phase duration in nanoseconds | long |
| elasticsearch.querylog.esql.profile.parsing.took | ES|QL profile parsing phase duration in nanoseconds | long |
| elasticsearch.querylog.esql.profile.planning.took | ES|QL profile planning phase duration in nanoseconds | long |
| elasticsearch.querylog.esql.profile.preanalysis.took | ES|QL profile preanalysis phase duration in nanoseconds | long |
| elasticsearch.querylog.esql.profile.query.took | ES|QL profile query phase duration in nanoseconds | long |
| elasticsearch.querylog.has_aggregations | True if the search response has aggregations (DSL) | boolean |
| elasticsearch.querylog.indices | Indices involved (DSL, ES|QL when response present, EQL). Not emitted by SqlLogProducer. | keyword |
| elasticsearch.querylog.is_remote | True when SearchRequest#getLocalClusterAlias() is set (DSL remote-cluster request) | boolean |
| elasticsearch.querylog.is_system | True if all resolved indices match the system-index predicate (QueryLogger); omitted when SQL has no indices | boolean |
| elasticsearch.querylog.query | Query text (DSL JSON, ES|QL, SQL, or EQL) | keyword |
| elasticsearch.querylog.result_count | Number of rows or hits returned (clamped to int where applicable) | long |
| elasticsearch.querylog.shards.failed | Failed shards (only emitted if count > 0) | long |
| elasticsearch.querylog.shards.skipped | Skipped shards (only emitted if count > 0) | long |
| elasticsearch.querylog.shards.successful | Successful shard count when shardInfo() is present | long |
| elasticsearch.querylog.timed_out | True when the request timed out (e.g. DSL SearchResponse, EQL timeout) | boolean |
| elasticsearch.querylog.took | Duration in nanoseconds | long |
| elasticsearch.querylog.took_millis | Duration in milliseconds | long |
| elasticsearch.querylog.type | Query kind: dsl, esql, sql, or eql | keyword |
| elasticsearch.shard.id | Id of the shard | keyword |
| elasticsearch.task.id | Task id for the query task | keyword |
| error.message | Error message. | match_only_text |
| error.type | The type of the error, for example the class name of the exception. | keyword |
| event.category | This is one of four ECS Categorization Fields, and indicates the second level in the ECS category hierarchy. event.category represents the "big buckets" of ECS categories. For example, filtering on event.category:process yields all events relating to process activity. This field is closely related to event.type, which is used as a subcategory. This field is an array. This will allow proper categorization of some events that fall in multiple categories. |
keyword |
| event.created | event.created contains the date/time when the event was first read by an agent, or by your pipeline. This field is distinct from @timestamp in that @timestamp typically contain the time extracted from the original event. In most situations, these two timestamps will be slightly different. The difference can be used to calculate the delay between your source generating an event, and the time when your agent first processed it. This can be used to monitor your agent's or pipeline's ability to keep up with your event source. In case the two timestamps are identical, @timestamp should be used. | date |
| event.duration | Duration of the event in nanoseconds. If event.start and event.end are known this value should be the difference between the end and start time. | long |
| event.ingested | Timestamp when an event arrived in the central data store. This is different from @timestamp, which is when the event originally occurred. It's also different from event.created, which is meant to capture the first time an agent saw the event. In normal conditions, assuming no tampering, the timestamps should chronologically look like this: @timestamp < event.created < event.ingested. |
date |
| event.kind | This is one of four ECS Categorization Fields, and indicates the highest level in the ECS category hierarchy. event.kind gives high-level information about what type of information the event contains, without being specific to the contents of the event. For example, values of this field distinguish alert events from metric events. The value of this field can be used to inform how these kinds of events should be handled. They may warrant different retention, different access control, it may also help understand whether the data coming in at a regular interval or not. |
keyword |
| event.module | Event module | constant_keyword |
| event.original | Raw text message of entire event. Used to demonstrate log integrity or where the full log message (before splitting it up in multiple parts) may be required, e.g. for reindex. This field is not indexed and doc_values are disabled. It cannot be searched, but it can be retrieved from _source. If users wish to override this and index this field, please see Field data types in the Elasticsearch Reference. |
keyword |
| event.outcome | This is one of four ECS Categorization Fields, and indicates the lowest level in the ECS category hierarchy. event.outcome simply denotes whether the event represents a success or a failure from the perspective of the entity that produced the event. Note that when a single transaction is described in multiple events, each event may populate different values of event.outcome, according to their perspective. Also note that in the case of a compound event (a single event that contains multiple logical events), this field should be populated with the value that best captures the overall success or failure from the perspective of the event producer. Further note that not all events will have an associated outcome. For example, this field is generally not populated for metric events, events with event.type:info, or any events for which an outcome does not make logical sense. |
keyword |
| event.type | This is one of four ECS Categorization Fields, and indicates the third level in the ECS category hierarchy. event.type represents a categorization "sub-bucket" that, when used along with the event.category field values, enables filtering events down to a level appropriate for single visualization. This field is an array. This will allow proper categorization of some events that fall in multiple event types. |
keyword |
| host.ip | Host ip addresses. | ip |
| http.request.headers.x_opaque_id | X-Opaque-Id header from the HTTP request when present | keyword |
| input.type | keyword | |
| log.file.path | Full path to the log file this event came from, including the file name. It should include the drive letter, when appropriate. If the event wasn't read from a log file, do not populate this field. | keyword |
| log.level | Original log level of the log event. If the source of the event provides a log level or textual severity, this is the one that goes in log.level. If your source doesn't specify one, you may put your event transport's severity here (e.g. Syslog severity). Some examples are warn, err, i, informational. |
keyword |
| log.logger | The name of the logger inside an application. This is usually the name of the class which initialized the logger, or can be a custom name. | keyword |
| log.offset | long | |
| message | For log events the message field contains the log message, optimized for viewing in a log viewer. For structured logs without an original message field, other fields can be concatenated to form a human-readable summary of the event. If multiple messages exist, they can be combined into one message. | match_only_text |
| process.thread.name | Thread name. | keyword |
| service.name | Name of the service data is collected from. The name of the service is normally user given. This allows for distributed services that run on multiple hosts to correlate the related instances based on the name. In the case of Elasticsearch the service.name could contain the cluster name. For Beats the service.name is by default a copy of the service.type field if no name is specified. |
keyword |
| service.type | The type of the service data is collected from. The type can be used to group and correlate logs and metrics from one service type. Example: If logs or metrics are collected from Elasticsearch, service.type would be elasticsearch. |
keyword |
| trace.id | Unique identifier of the trace. A trace groups multiple events like transactions that belong together. For example, a user request handled by multiple inter-connected services. | keyword |
| user.name | Short name or login of the user. | keyword |
| user.name.text | Multi-field of user.name. |
match_only_text |
| user.realm | User authentication realm when present in query logs | keyword |
The elasticsearch package can be used to collect logs and metrics shown in our Stack Monitoring
UI in Kibana.
Like other package, elasticsearch metrics collection accepts a hosts configuration setting.
This setting can contain a list of entries. The related scope setting determines how each entry in
the hosts list is interpreted by the module.
- If
scopeis set tonode(default), each entry in thehostslist indicates a distinct node in an Elasticsearch cluster. - If
scopeis set tocluster, each entry in thehostslist indicates a single endpoint for a distinct Elasticsearch cluster (for example, a load-balancing proxy fronting the cluster).
CCR It uses the Cross-Cluster Replication Stats API endpoint to fetch metrics about cross-cluster replication from the Elasticsearch clusters that are participating in cross-cluster replication.
If the Elasticsearch cluster does not have cross-cluster replication enabled, this package will not collect metrics. A DEBUG log message about this will be emitted in the log.
Exported fields
| Field | Description | Type | Metric Type |
|---|---|---|---|
| @timestamp | Date/time when the event originated. This is the date/time extracted from the event, typically representing when the event was generated by the source. If the event source has no original timestamp, this value is typically populated by the first time the event was received by the pipeline. Required field for all events. | date | |
| agent.id | Unique identifier of this agent (if one exists). Example: For Beats this would be beat.id. | keyword | |
| ccr_auto_follow_stats.follower.failed_read_requests | alias | ||
| ccr_auto_follow_stats.number_of_failed_follow_indices | alias | ||
| ccr_auto_follow_stats.number_of_failed_remote_cluster_state_requests | alias | ||
| ccr_auto_follow_stats.number_of_successful_follow_indices | alias | ||
| ccr_stats.bytes_read | alias | ||
| ccr_stats.failed_read_requests | alias | ||
| ccr_stats.failed_write_requests | alias | ||
| ccr_stats.follower_aliases_version | alias | ||
| ccr_stats.follower_global_checkpoint | alias | ||
| ccr_stats.follower_index | alias | ||
| ccr_stats.follower_mapping_version | alias | ||
| ccr_stats.follower_max_seq_no | alias | ||
| ccr_stats.follower_settings_version | alias | ||
| ccr_stats.last_requested_seq_no | alias | ||
| ccr_stats.leader_global_checkpoint | alias | ||
| ccr_stats.leader_index | alias | ||
| ccr_stats.leader_max_seq_no | alias | ||
| ccr_stats.operations_read | alias | ||
| ccr_stats.operations_written | alias | ||
| ccr_stats.outstanding_read_requests | alias | ||
| ccr_stats.outstanding_write_requests | alias | ||
| ccr_stats.remote_cluster | alias | ||
| ccr_stats.shard_id | alias | ||
| ccr_stats.successful_read_requests | alias | ||
| ccr_stats.successful_write_requests | alias | ||
| ccr_stats.total_read_remote_exec_time_millis | alias | ||
| ccr_stats.total_read_time_millis | alias | ||
| ccr_stats.total_write_time_millis | alias | ||
| ccr_stats.write_buffer_operation_count | alias | ||
| ccr_stats.write_buffer_size_in_bytes | alias | ||
| cluster_uuid | alias | ||
| data_stream.dataset | Data stream dataset. | constant_keyword | |
| data_stream.namespace | Data stream namespace. | constant_keyword | |
| data_stream.type | Data stream type. | constant_keyword | |
| ecs.version | ECS version this event conforms to. ecs.version is a required field and must exist in all events. When querying across multiple indices -- which may conform to slightly different ECS versions -- this field lets integrations adjust to the schema version of the events. |
keyword | |
| elasticsearch.ccr.auto_follow.failed.follow_indices.count | long | gauge | |
| elasticsearch.ccr.auto_follow.failed.remote_cluster_state_requests.count | long | gauge | |
| elasticsearch.ccr.auto_follow.success.follow_indices.count | long | gauge | |
| elasticsearch.ccr.bytes_read | long | gauge | |
| elasticsearch.ccr.follower.aliases_version | long | gauge | |
| elasticsearch.ccr.follower.global_checkpoint | Global checkpoint value on follower shard | long | gauge |
| elasticsearch.ccr.follower.index | Name of follower index | keyword | |
| elasticsearch.ccr.follower.mapping_version | long | gauge | |
| elasticsearch.ccr.follower.max_seq_no | Maximum sequence number of operation on the follower shard | long | gauge |
| elasticsearch.ccr.follower.operations.read.count | Current count of read operations. | long | gauge |
| elasticsearch.ccr.follower.operations_written | Total number of operations indexed (replicated) into the follower shard from the leader shard | long | counter |
| elasticsearch.ccr.follower.settings_version | long | gauge | |
| elasticsearch.ccr.follower.shard.number | Number of the shard within the index | long | |
| elasticsearch.ccr.follower.time_since_last_read.ms | Time, in ms, since the follower last fetched from the leader | long | gauge |
| elasticsearch.ccr.last_requested_seq_no | long | gauge | |
| elasticsearch.ccr.leader.global_checkpoint | long | gauge | |
| elasticsearch.ccr.leader.index | Name of leader index | keyword | |
| elasticsearch.ccr.leader.max_seq_no | Maximum sequence number of operation on the leader shard | long | gauge |
| elasticsearch.ccr.read_exceptions | nested | ||
| elasticsearch.ccr.read_exceptions.exception | object | ||
| elasticsearch.ccr.read_exceptions.exception.reason | text | ||
| elasticsearch.ccr.read_exceptions.exception.type | keyword | ||
| elasticsearch.ccr.read_exceptions.from_seq_no | long | gauge | |
| elasticsearch.ccr.read_exceptions.retries | integer | gauge | |
| elasticsearch.ccr.remote_cluster | keyword | ||
| elasticsearch.ccr.requests.failed.read.count | long | counter | |
| elasticsearch.ccr.requests.failed.write.count | long | counter | |
| elasticsearch.ccr.requests.outstanding.read.count | long | counter | |
| elasticsearch.ccr.requests.outstanding.write.count | long | counter | |
| elasticsearch.ccr.requests.successful.read.count | long | counter | |
| elasticsearch.ccr.requests.successful.write.count | long | counter | |
| elasticsearch.ccr.shard_id | integer | ||
| elasticsearch.ccr.total_time.read.ms | long | gauge | |
| elasticsearch.ccr.total_time.read.remote_exec.ms | long | gauge | |
| elasticsearch.ccr.total_time.write.ms | long | gauge | |
| elasticsearch.ccr.write_buffer.operation.count | long | gauge | |
| elasticsearch.ccr.write_buffer.size.bytes | long | gauge | |
| elasticsearch.cluster.id | Elasticsearch cluster id. | keyword | |
| elasticsearch.cluster.name | Elasticsearch cluster name. | keyword | |
| elasticsearch.cluster.state.id | Elasticsearch state id. | keyword | |
| elasticsearch.node.id | Node ID | keyword | |
| elasticsearch.node.master | Is the node the master node? | boolean | |
| elasticsearch.node.mlockall | Is mlockall enabled on the node? | boolean | |
| elasticsearch.node.name | Node name. | keyword | |
| error.message | Error message. | match_only_text | |
| event.dataset | Name of the dataset. If an event source publishes more than one type of log or events (e.g. access log, error log), the dataset is used to specify which one the event comes from. It's recommended but not required to start the dataset name with the module name, followed by a dot, then the dataset name. | keyword | |
| event.duration | Duration of the event in nanoseconds. If event.start and event.end are known this value should be the difference between the end and start time. | long | |
| event.module | Name of the module this data is coming from. If your monitoring agent supports the concept of modules or plugins to process events of a given source (e.g. Apache logs), event.module should contain the name of this module. |
keyword | |
| host.name | Name of the host. It can contain what hostname returns on Unix systems, the fully qualified domain name, or a name specified by the user. The sender decides which value to use. |
keyword | |
| service.address | Service address | keyword | |
| service.name | Name of the service data is collected from. The name of the service is normally user given. This allows for distributed services that run on multiple hosts to correlate the related instances based on the name. In the case of Elasticsearch the service.name could contain the cluster name. For Beats the service.name is by default a copy of the service.type field if no name is specified. |
keyword | |
| service.type | The type of the service data is collected from. The type can be used to group and correlate logs and metrics from one service type. Example: If logs or metrics are collected from Elasticsearch, service.type would be elasticsearch. |
keyword | |
| source_node.name | alias | ||
| source_node.uuid | alias | ||
| timestamp | alias |
cluster_stats interrogates the
Cluster Stats API endpoint
to fetch information about the Elasticsearch cluster.
Example
{
    "@timestamp": "2022-10-11T14:40:29.703Z",
    "agent": {
        "ephemeral_id": "ca2952fa-aafc-49ad-9612-07b4ced53652",
        "id": "79e48fe3-2ecd-4021-aed5-6e7e69d47606",
        "name": "docker-fleet-agent",
        "type": "metricbeat",
        "version": "8.5.0"
    },
    "data_stream": {
        "dataset": "elasticsearch.stack_monitoring.cluster_stats",
        "namespace": "ep",
        "type": "metrics"
    },
    "ecs": {
        "version": "8.0.0"
    },
    "elastic_agent": {
        "id": "79e48fe3-2ecd-4021-aed5-6e7e69d47606",
        "snapshot": true,
        "version": "8.5.0"
    },
    "elasticsearch": {
        "cluster": {
            "id": "H4rX2Qc4Tquh3MHuVuzdeQ",
            "name": "elasticsearch",
            "stats": {
                "indices": {
                    "docs": {
                        "total": 18
                    },
                    "fielddata": {
                        "memory": {
                            "bytes": 0
                        }
                    },
                    "shards": {
                        "count": 12,
                        "primaries": 12
                    },
                    "store": {
                        "size": {
                            "bytes": 95749
                        }
                    },
                    "total": 10
                },
                "license": {
                    "cluster_needs_tls": true,
                    "expiry_date": "2022-11-10T14:40:10.162Z",
                    "expiry_date_in_millis": 1668091210162,
                    "issue_date": "2022-10-11T14:40:10.162Z",
                    "issue_date_in_millis": 1665499210162,
                    "issued_to": "elasticsearch",
                    "issuer": "elasticsearch",
                    "max_nodes": 1000,
                    "start_date_in_millis": -1,
                    "status": "active",
                    "type": "trial",
                    "uid": "cbabb3e0-7294-4784-8ccb-118a2076d940"
                },
                "nodes": {
                    "count": 1,
                    "fs": {
                        "available": {
                            "bytes": 160894537728
                        },
                        "total": {
                            "bytes": 194136477696
                        }
                    },
                    "jvm": {
                        "max_uptime": {
                            "ms": 34416
                        },
                        "memory": {
                            "heap": {
                                "max": {
                                    "bytes": 1073741824
                                },
                                "used": {
                                    "bytes": 477367808
                                }
                            }
                        }
                    },
                    "master": 1,
                    "versions": [
                        "8.5.0"
                    ]
                },
                "stack": {
                    "xpack": {
                        "ccr": {
                            "available": true,
                            "enabled": true
                        }
                    }
                },
                "state": {
                    "master_node": "Unf_fjGESWun1vbtRzJK9w",
                    "nodes": {
                        "Unf_fjGESWun1vbtRzJK9w": {
                            "attributes": {
                                "ml.allocated_processors": "7",
                                "ml.allocated_processors_double": "7.0",
                                "ml.machine_memory": "12544004096",
                                "ml.max_jvm_size": "1073741824",
                                "xpack.installed": "true"
                            },
                            "ephemeral_id": "HUlmpnU2S0ilRSHZ_F1tTg",
                            "external_id": "b978cf9a6a3c",
                            "name": "b978cf9a6a3c",
                            "roles": [
                                "data",
                                "data_cold",
                                "data_content",
                                "data_frozen",
                                "data_hot",
                                "data_warm",
                                "ingest",
                                "master",
                                "ml",
                                "remote_cluster_client",
                                "transform"
                            ],
                            "transport_address": "127.0.0.1:9300"
                        }
                    },
                    "nodes_hash": 460682572,
                    "state_uuid": "d3z5ixwbTbeUf08VWE9Vcw"
                },
                "status": "yellow"
            }
        },
        "version": 60
    },
    "event": {
        "agent_id_status": "verified",
        "dataset": "elasticsearch.stack_monitoring.cluster_stats",
        "duration": 447033584,
        "ingested": "2022-10-11T14:40:31Z",
        "module": "elasticsearch"
    },
    "host": {
        "architecture": "x86_64",
        "containerized": false,
        "hostname": "docker-fleet-agent",
        "id": "b6bc6723e51b43959ce07f0c3105c72d",
        "ip": [
            "192.168.0.7"
        ],
        "mac": [
            "02-42-C0-A8-00-07"
        ],
        "name": "docker-fleet-agent",
        "os": {
            "codename": "focal",
            "family": "debian",
            "kernel": "5.10.124-linuxkit",
            "name": "Ubuntu",
            "platform": "ubuntu",
            "type": "linux",
            "version": "20.04.5 LTS (Focal Fossa)"
        }
    },
    "metricset": {
        "name": "cluster_stats",
        "period": 10000
    },
    "service": {
        "address": "http://elastic-package-service-elasticsearch-1:9200",
        "type": "elasticsearch"
    }
}
Exported fields
| Field | Description | Type | Metric Type |
|---|---|---|---|
| @timestamp | Date/time when the event originated. This is the date/time extracted from the event, typically representing when the event was generated by the source. If the event source has no original timestamp, this value is typically populated by the first time the event was received by the pipeline. Required field for all events. | date | |
| agent.id | Unique identifier of this agent (if one exists). Example: For Beats this would be beat.id. | keyword | |
| cluster_settings.cluster.metadata.display_name | keyword | ||
| cluster_state.master_node | alias | ||
| cluster_state.nodes_hash | alias | ||
| cluster_state.state_uuid | alias | ||
| cluster_state.status | alias | ||
| cluster_state.version | alias | ||
| cluster_stats.indices.count | alias | ||
| cluster_stats.indices.shards.total | alias | ||
| cluster_stats.nodes.count.total | alias | ||
| cluster_stats.nodes.jvm.max_uptime_in_millis | alias | ||
| cluster_stats.nodes.jvm.mem.heap_max_in_bytes | alias | ||
| cluster_stats.nodes.jvm.mem.heap_used_in_bytes | alias | ||
| cluster_uuid | alias | ||
| data_stream.dataset | Data stream dataset. | constant_keyword | |
| data_stream.namespace | Data stream namespace. | constant_keyword | |
| data_stream.type | Data stream type. | constant_keyword | |
| ecs.version | ECS version this event conforms to. ecs.version is a required field and must exist in all events. When querying across multiple indices -- which may conform to slightly different ECS versions -- this field lets integrations adjust to the schema version of the events. |
keyword | |
| elasticsearch.cluster.id | Elasticsearch cluster id. | keyword | |
| elasticsearch.cluster.name | Elasticsearch cluster name. | keyword | |
| elasticsearch.cluster.state.id | Elasticsearch state id. | keyword | |
| elasticsearch.cluster.stats.indices.docs.total | Total number of indices in cluster. | long | gauge |
| elasticsearch.cluster.stats.indices.fielddata.memory.bytes | Memory used for fielddata. | long | gauge |
| elasticsearch.cluster.stats.indices.shards.count | Total number of shards in cluster. | long | gauge |
| elasticsearch.cluster.stats.indices.shards.primaries | Total number of primary shards in cluster. | long | gauge |
| elasticsearch.cluster.stats.indices.store.size.bytes | long | gauge | |
| elasticsearch.cluster.stats.indices.store.total_data_set_size.bytes | long | gauge | |
| elasticsearch.cluster.stats.indices.total | long | gauge | |
| elasticsearch.cluster.stats.license.cluster_needs_tls | boolean | ||
| elasticsearch.cluster.stats.license.expiry_date | date | ||
| elasticsearch.cluster.stats.license.expiry_date_in_millis | long | ||
| elasticsearch.cluster.stats.license.issue_date | date | ||
| elasticsearch.cluster.stats.license.issue_date_in_millis | long | ||
| elasticsearch.cluster.stats.license.issued_to | keyword | ||
| elasticsearch.cluster.stats.license.issuer | keyword | ||
| elasticsearch.cluster.stats.license.max_nodes | long | ||
| elasticsearch.cluster.stats.license.start_date_in_millis | long | ||
| elasticsearch.cluster.stats.license.status | keyword | ||
| elasticsearch.cluster.stats.license.type | keyword | ||
| elasticsearch.cluster.stats.license.uid | keyword | ||
| elasticsearch.cluster.stats.nodes.count | Total number of nodes in cluster. | long | gauge |
| elasticsearch.cluster.stats.nodes.data | long | gauge | |
| elasticsearch.cluster.stats.nodes.fs.available.bytes | long | gauge | |
| elasticsearch.cluster.stats.nodes.fs.total.bytes | long | gauge | |
| elasticsearch.cluster.stats.nodes.jvm.max_uptime.ms | long | gauge | |
| elasticsearch.cluster.stats.nodes.jvm.memory.heap.max.bytes | long | gauge | |
| elasticsearch.cluster.stats.nodes.jvm.memory.heap.used.bytes | long | gauge | |
| elasticsearch.cluster.stats.nodes.master | Number of master-eligible nodes in cluster. | long | gauge |
| elasticsearch.cluster.stats.nodes.stats.data | Number of data nodes in cluster. | long | gauge |
| elasticsearch.cluster.stats.nodes.versions | text | ||
| elasticsearch.cluster.stats.stack.apm.found | boolean | ||
| elasticsearch.cluster.stats.stack.xpack.ccr.available | boolean | ||
| elasticsearch.cluster.stats.stack.xpack.ccr.enabled | boolean | ||
| elasticsearch.cluster.stats.state.master_node | keyword | ||
| elasticsearch.cluster.stats.state.nodes | flattened | ||
| elasticsearch.cluster.stats.state.nodes_hash | keyword | ||
| elasticsearch.cluster.stats.state.state_uuid | keyword | ||
| elasticsearch.cluster.stats.state.version | keyword | ||
| elasticsearch.cluster.stats.status | Cluster status (green, yellow, red). | keyword | |
| elasticsearch.cluster.stats.version | keyword | ||
| elasticsearch.node.id | Node ID | keyword | |
| elasticsearch.node.master | Is the node the master node? | boolean | |
| elasticsearch.node.mlockall | Is mlockall enabled on the node? | boolean | |
| elasticsearch.node.name | Node name. | keyword | |
| elasticsearch.version | keyword | ||
| error.message | Error message. | match_only_text | |
| event.dataset | Name of the dataset. If an event source publishes more than one type of log or events (e.g. access log, error log), the dataset is used to specify which one the event comes from. It's recommended but not required to start the dataset name with the module name, followed by a dot, then the dataset name. | keyword | |
| event.duration | Duration of the event in nanoseconds. If event.start and event.end are known this value should be the difference between the end and start time. | long | |
| event.module | Name of the module this data is coming from. If your monitoring agent supports the concept of modules or plugins to process events of a given source (e.g. Apache logs), event.module should contain the name of this module. |
keyword | |
| host.name | Name of the host. It can contain what hostname returns on Unix systems, the fully qualified domain name, or a name specified by the user. The sender decides which value to use. |
keyword | |
| license.status | alias | ||
| license.type | alias | ||
| service.address | Service address | keyword | |
| service.name | Name of the service data is collected from. The name of the service is normally user given. This allows for distributed services that run on multiple hosts to correlate the related instances based on the name. In the case of Elasticsearch the service.name could contain the cluster name. For Beats the service.name is by default a copy of the service.type field if no name is specified. |
keyword | |
| service.type | The type of the service data is collected from. The type can be used to group and correlate logs and metrics from one service type. Example: If logs or metrics are collected from Elasticsearch, service.type would be elasticsearch. |
keyword | |
| source_node.name | alias | ||
| source_node.uuid | alias | ||
| stack_stats.apm.found | alias | ||
| stack_stats.xpack.ccr.available | alias | ||
| stack_stats.xpack.ccr.enabled | alias | ||
| timestamp | alias |
Enrch interrogates the Enrich Stats API endpoint to fetch information about Enrich coordinator nodesin the Elasticsearch cluster that are participating in ingest-time enrichment.
Example
{
    "agent": {
        "hostname": "docker-fleet-agent",
        "name": "docker-fleet-agent",
        "id": "60e15e27-7080-4c28-9900-5a087c2ff74c",
        "type": "metricbeat",
        "ephemeral_id": "2b6da727-313f-41fc-84af-3cd928f265c1",
        "version": "7.14.0"
    },
    "elastic_agent": {
        "id": "60e15e27-7080-4c28-9900-5a087c2ff74c",
        "version": "7.14.0",
        "snapshot": true
    },
    "@timestamp": "2021-07-30T14:47:15.376Z",
    "elasticsearch": {
        "node": {
            "id": "6XuAxHXaRbeX6LUrxIfAxg"
        },
        "cluster": {
            "name": "docker-cluster",
            "id": "bvF4SoDLQU-sdM3YY8JI8Q"
        },
        "enrich": {
            "executed_searches": {
                "total": 0
            },
            "remote_requests": {
                "current": 0,
                "total": 0
            },
            "queue": {
                "size": 0
            }
        }
    },
    "ecs": {
        "version": "1.10.0"
    },
    "service": {
        "address": "http://elasticsearch:9200",
        "name": "elasticsearch",
        "type": "elasticsearch"
    },
    "data_stream": {
        "namespace": "default",
        "type": "metrics",
        "dataset": "elasticsearch.stack_monitoring.enrich"
    },
    "host": {
        "hostname": "docker-fleet-agent",
        "os": {
            "kernel": "5.11.10-arch1-1",
            "codename": "Core",
            "name": "CentOS Linux",
            "type": "linux",
            "family": "redhat",
            "version": "7 (Core)",
            "platform": "centos"
        },
        "containerized": true,
        "ip": [
            "172.18.0.7"
        ],
        "name": "docker-fleet-agent",
        "id": "8979eb4aa312c3dccea3823dd92f92f5",
        "mac": [
            "02:42:ac:12:00:07"
        ],
        "architecture": "x86_64"
    },
    "metricset": {
        "period": 10000,
        "name": "enrich"
    },
    "event": {
        "duration": 2804362,
        "agent_id_status": "verified",
        "ingested": "2021-07-30T14:47:16.373180707Z",
        "module": "elasticsearch",
        "dataset": "elasticsearch.stack_monitoring.enrich"
    }
}
Exported fields
| Field | Description | Type | Metric Type |
|---|---|---|---|
| @timestamp | Date/time when the event originated. This is the date/time extracted from the event, typically representing when the event was generated by the source. If the event source has no original timestamp, this value is typically populated by the first time the event was received by the pipeline. Required field for all events. | date | |
| agent.id | Unique identifier of this agent (if one exists). Example: For Beats this would be beat.id. | keyword | |
| cluster_uuid | alias | ||
| data_stream.dataset | Data stream dataset. | constant_keyword | |
| data_stream.namespace | Data stream namespace. | constant_keyword | |
| data_stream.type | Data stream type. | constant_keyword | |
| ecs.version | ECS version this event conforms to. ecs.version is a required field and must exist in all events. When querying across multiple indices -- which may conform to slightly different ECS versions -- this field lets integrations adjust to the schema version of the events. |
keyword | |
| elasticsearch.cluster.id | Elasticsearch cluster id. | keyword | |
| elasticsearch.cluster.name | Elasticsearch cluster name. | keyword | |
| elasticsearch.cluster.state.id | Elasticsearch state id. | keyword | |
| elasticsearch.enrich.executed_searches.total | Number of search requests that enrich processors have executed since node startup. | long | counter |
| elasticsearch.enrich.executing_policy.name | keyword | ||
| elasticsearch.enrich.executing_policy.task.action | keyword | ||
| elasticsearch.enrich.executing_policy.task.cancellable | boolean | ||
| elasticsearch.enrich.executing_policy.task.id | long | ||
| elasticsearch.enrich.executing_policy.task.parent_task_id | keyword | ||
| elasticsearch.enrich.executing_policy.task.task | keyword | ||
| elasticsearch.enrich.executing_policy.task.time.running.nano | long | counter | |
| elasticsearch.enrich.executing_policy.task.time.start.ms | long | ||
| elasticsearch.enrich.queue.size | Number of search requests in the queue. | long | gauge |
| elasticsearch.enrich.remote_requests.current | Current number of outstanding remote requests. | long | gauge |
| elasticsearch.enrich.remote_requests.total | Number of outstanding remote requests executed since node startup. | long | counter |
| elasticsearch.node.id | Node ID | keyword | |
| elasticsearch.node.master | Is the node the master node? | boolean | |
| elasticsearch.node.mlockall | Is mlockall enabled on the node? | boolean | |
| elasticsearch.node.name | Node name. | keyword | |
| error.message | Error message. | match_only_text | |
| event.dataset | Name of the dataset. If an event source publishes more than one type of log or events (e.g. access log, error log), the dataset is used to specify which one the event comes from. It's recommended but not required to start the dataset name with the module name, followed by a dot, then the dataset name. | keyword | |
| event.duration | Duration of the event in nanoseconds. If event.start and event.end are known this value should be the difference between the end and start time. | long | |
| event.module | Name of the module this data is coming from. If your monitoring agent supports the concept of modules or plugins to process events of a given source (e.g. Apache logs), event.module should contain the name of this module. |
keyword | |
| host.name | Name of the host. It can contain what hostname returns on Unix systems, the fully qualified domain name, or a name specified by the user. The sender decides which value to use. |
keyword | |
| service.address | Service address | keyword | |
| service.name | Name of the service data is collected from. The name of the service is normally user given. This allows for distributed services that run on multiple hosts to correlate the related instances based on the name. In the case of Elasticsearch the service.name could contain the cluster name. For Beats the service.name is by default a copy of the service.type field if no name is specified. |
keyword | |
| service.type | The type of the service data is collected from. The type can be used to group and correlate logs and metrics from one service type. Example: If logs or metrics are collected from Elasticsearch, service.type would be elasticsearch. |
keyword | |
| source_node.name | alias | ||
| source_node.uuid | alias | ||
| timestamp | alias |
Example
{
    "@timestamp": "2022-10-11T11:51:32.135Z",
    "agent": {
        "ephemeral_id": "7047b7d7-b0f6-412b-a884-19c38671acf5",
        "id": "79e48fe3-2ecd-4021-aed5-6e7e69d47606",
        "name": "docker-fleet-agent",
        "type": "metricbeat",
        "version": "8.5.0"
    },
    "data_stream": {
        "dataset": "elasticsearch.stack_monitoring.index",
        "namespace": "ep",
        "type": "metrics"
    },
    "ecs": {
        "version": "8.0.0"
    },
    "elastic_agent": {
        "id": "79e48fe3-2ecd-4021-aed5-6e7e69d47606",
        "snapshot": true,
        "version": "8.5.0"
    },
    "elasticsearch": {
        "cluster": {
            "id": "H507Ao7tR5-NU8YnTjSYAQ",
            "name": "elasticsearch"
        },
        "index": {
            "hidden": true,
            "name": ".ml-state-000001",
            "tier_preference": "data_content",
            "creation_date": 1731657995821,
            "mode": "time_series",
            "codec": "default",
            "version": "8503000",
            "primaries": {
                "docs": {
                    "count": 0
                },
                "indexing": {
                    "index_time_in_millis": 0,
                    "index_total": 0,
                    "throttle_time_in_millis": 0
                },
                "merges": {
                    "total_size_in_bytes": 0
                },
                "refresh": {
                    "total_time_in_millis": 0
                },
                "segments": {
                    "count": 0
                },
                "store": {
                    "size_in_bytes": 225
                }
            },
            "shards": {
                "primaries": 1,
                "total": 1
            },
            "status": "green",
            "total": {
                "bulk": {
                    "avg_size_in_bytes": 0,
                    "avg_time_in_millis": 0,
                    "total_operations": 0,
                    "total_size_in_bytes": 0,
                    "total_time_in_millis": 0
                },
                "docs": {
                    "count": 0
                },
                "fielddata": {
                    "memory_size_in_bytes": 0
                },
                "indexing": {
                    "index_time_in_millis": 0,
                    "index_total": 0,
                    "throttle_time_in_millis": 0
                },
                "merges": {
                    "total_size_in_bytes": 0
                },
                "refresh": {
                    "total_time_in_millis": 0
                },
                "search": {
                    "query_time_in_millis": 0,
                    "query_total": 0
                },
                "segments": {
                    "count": 0,
                    "doc_values_memory_in_bytes": 0,
                    "fixed_bit_set_memory_in_bytes": 0,
                    "index_writer_memory_in_bytes": 0,
                    "memory_in_bytes": 0,
                    "norms_memory_in_bytes": 0,
                    "points_memory_in_bytes": 0,
                    "stored_fields_memory_in_bytes": 0,
                    "term_vectors_memory_in_bytes": 0,
                    "terms_memory_in_bytes": 0,
                    "version_map_memory_in_bytes": 0
                },
                "store": {
                    "size_in_bytes": 225
                }
            },
            "uuid": "rQEw7aohRUqpIz3fuZj6JQ"
        }
    },
    "event": {
        "agent_id_status": "verified",
        "dataset": "elasticsearch.stack_monitoring.index",
        "duration": 143033459,
        "ingested": "2022-10-11T11:51:33Z",
        "module": "elasticsearch"
    },
    "host": {
        "architecture": "x86_64",
        "containerized": false,
        "hostname": "docker-fleet-agent",
        "id": "b6bc6723e51b43959ce07f0c3105c72d",
        "ip": [
            "192.168.0.7"
        ],
        "mac": [
            "02-42-C0-A8-00-07"
        ],
        "name": "docker-fleet-agent",
        "os": {
            "codename": "focal",
            "family": "debian",
            "kernel": "5.10.124-linuxkit",
            "name": "Ubuntu",
            "platform": "ubuntu",
            "type": "linux",
            "version": "20.04.5 LTS (Focal Fossa)"
        }
    },
    "metricset": {
        "name": "index",
        "period": 10000
    },
    "service": {
        "address": "http://elastic-package-service-elasticsearch-1:9200",
        "type": "elasticsearch"
    }
}
Exported fields
| Field | Description | Type | Metric Type |
|---|---|---|---|
| @timestamp | Date/time when the event originated. This is the date/time extracted from the event, typically representing when the event was generated by the source. If the event source has no original timestamp, this value is typically populated by the first time the event was received by the pipeline. Required field for all events. | date | |
| agent.id | Unique identifier of this agent (if one exists). Example: For Beats this would be beat.id. | keyword | |
| cluster_uuid | alias | ||
| data_stream.dataset | Data stream dataset. | constant_keyword | |
| data_stream.namespace | Data stream namespace. | constant_keyword | |
| data_stream.type | Data stream type. | constant_keyword | |
| ecs.version | ECS version this event conforms to. ecs.version is a required field and must exist in all events. When querying across multiple indices -- which may conform to slightly different ECS versions -- this field lets integrations adjust to the schema version of the events. |
keyword | |
| elasticsearch.cluster.id | Elasticsearch cluster id. | keyword | |
| elasticsearch.cluster.name | Elasticsearch cluster name. | keyword | |
| elasticsearch.cluster.state.id | Elasticsearch state id. | keyword | |
| elasticsearch.index.codec | keyword | ||
| elasticsearch.index.creation_date | date | ||
| elasticsearch.index.hidden | boolean | ||
| elasticsearch.index.mode | keyword | ||
| elasticsearch.index.name | Index name. | keyword | |
| elasticsearch.index.primaries.docs.count | long | gauge | |
| elasticsearch.index.primaries.docs.deleted | long | gauge | |
| elasticsearch.index.primaries.indexing.index_time_in_millis | long | counter | |
| elasticsearch.index.primaries.indexing.index_total | long | counter | |
| elasticsearch.index.primaries.indexing.throttle_time_in_millis | long | counter | |
| elasticsearch.index.primaries.merges.total_size_in_bytes | long | gauge | |
| elasticsearch.index.primaries.query_cache.hit_count | long | counter | |
| elasticsearch.index.primaries.query_cache.memory_size_in_bytes | long | gauge | |
| elasticsearch.index.primaries.query_cache.miss_count | long | counter | |
| elasticsearch.index.primaries.refresh.external_total_time_in_millis | long | counter | |
| elasticsearch.index.primaries.refresh.total_time_in_millis | long | counter | |
| elasticsearch.index.primaries.request_cache.evictions | long | counter | |
| elasticsearch.index.primaries.request_cache.hit_count | long | counter | |
| elasticsearch.index.primaries.request_cache.memory_size_in_bytes | long | gauge | |
| elasticsearch.index.primaries.request_cache.miss_count | long | counter | |
| elasticsearch.index.primaries.search.query_time_in_millis | long | counter | |
| elasticsearch.index.primaries.search.query_total | long | counter | |
| elasticsearch.index.primaries.segments.count | long | gauge | |
| elasticsearch.index.primaries.segments.doc_values_memory_in_bytes | long | gauge | |
| elasticsearch.index.primaries.segments.fixed_bit_set_memory_in_bytes | long | gauge | |
| elasticsearch.index.primaries.segments.index_writer_memory_in_bytes | long | gauge | |
| elasticsearch.index.primaries.segments.memory_in_bytes | long | gauge | |
| elasticsearch.index.primaries.segments.norms_memory_in_bytes | long | gauge | |
| elasticsearch.index.primaries.segments.points_memory_in_bytes | long | gauge | |
| elasticsearch.index.primaries.segments.stored_fields_memory_in_bytes | long | gauge | |
| elasticsearch.index.primaries.segments.term_vectors_memory_in_bytes | long | gauge | |
| elasticsearch.index.primaries.segments.terms_memory_in_bytes | long | gauge | |
| elasticsearch.index.primaries.segments.version_map_memory_in_bytes | long | gauge | |
| elasticsearch.index.primaries.store.size_in_bytes | long | gauge | |
| elasticsearch.index.primaries.store.total_data_set_size_in_bytes | long | gauge | |
| elasticsearch.index.shards.primaries | long | ||
| elasticsearch.index.shards.total | long | ||
| elasticsearch.index.status | keyword | ||
| elasticsearch.index.tier_preference | keyword | ||
| elasticsearch.index.total.bulk.avg_size_in_bytes | long | gauge | |
| elasticsearch.index.total.bulk.avg_time_in_millis | long | gauge | |
| elasticsearch.index.total.bulk.total_operations | long | counter | |
| elasticsearch.index.total.bulk.total_size_in_bytes | long | gauge | |
| elasticsearch.index.total.bulk.total_time_in_millis | long | counter | |
| elasticsearch.index.total.docs.count | Total number of documents in the index. | long | gauge |
| elasticsearch.index.total.docs.deleted | Total number of deleted documents in the index. | long | gauge |
| elasticsearch.index.total.fielddata.evictions | long | counter | |
| elasticsearch.index.total.fielddata.memory_size_in_bytes | long | gauge | |
| elasticsearch.index.total.indexing.index_time_in_millis | long | counter | |
| elasticsearch.index.total.indexing.index_total | long | counter | |
| elasticsearch.index.total.indexing.throttle_time_in_millis | long | counter | |
| elasticsearch.index.total.merges.total_size_in_bytes | long | gauge | |
| elasticsearch.index.total.query_cache.evictions | long | counter | |
| elasticsearch.index.total.query_cache.hit_count | long | counter | |
| elasticsearch.index.total.query_cache.memory_size_in_bytes | long | gauge | |
| elasticsearch.index.total.query_cache.miss_count | long | counter | |
| elasticsearch.index.total.refresh.external_total_time_in_millis | long | counter | |
| elasticsearch.index.total.refresh.total_time_in_millis | long | counter | |
| elasticsearch.index.total.request_cache.evictions | long | counter | |
| elasticsearch.index.total.request_cache.hit_count | long | counter | |
| elasticsearch.index.total.request_cache.memory_size_in_bytes | long | gauge | |
| elasticsearch.index.total.request_cache.miss_count | long | counter | |
| elasticsearch.index.total.search.query_time_in_millis | long | counter | |
| elasticsearch.index.total.search.query_total | long | counter | |
| elasticsearch.index.total.segments.count | Total number of index segments. | long | gauge |
| elasticsearch.index.total.segments.doc_values_memory_in_bytes | long | gauge | |
| elasticsearch.index.total.segments.fixed_bit_set_memory_in_bytes | long | gauge | |
| elasticsearch.index.total.segments.index_writer_memory_in_bytes | long | gauge | |
| elasticsearch.index.total.segments.memory.bytes | Total number of memory used by the segments in bytes. | long | gauge |
| elasticsearch.index.total.segments.memory_in_bytes | Total number of memory used by the segments in bytes. | long | gauge |
| elasticsearch.index.total.segments.norms_memory_in_bytes | long | gauge | |
| elasticsearch.index.total.segments.points_memory_in_bytes | long | gauge | |
| elasticsearch.index.total.segments.stored_fields_memory_in_bytes | long | gauge | |
| elasticsearch.index.total.segments.term_vectors_memory_in_bytes | long | gauge | |
| elasticsearch.index.total.segments.terms_memory_in_bytes | long | gauge | |
| elasticsearch.index.total.segments.version_map_memory_in_bytes | long | gauge | |
| elasticsearch.index.total.store.size.bytes | long | gauge | |
| elasticsearch.index.total.store.size_in_bytes | Total size of the index in bytes. | long | gauge |
| elasticsearch.index.uuid | keyword | ||
| elasticsearch.index.version | keyword | ||
| elasticsearch.node.id | Node ID | keyword | |
| elasticsearch.node.master | Is the node the master node? | boolean | |
| elasticsearch.node.mlockall | Is mlockall enabled on the node? | boolean | |
| elasticsearch.node.name | Node name. | keyword | |
| error.message | Error message. | match_only_text | |
| event.dataset | Name of the dataset. If an event source publishes more than one type of log or events (e.g. access log, error log), the dataset is used to specify which one the event comes from. It's recommended but not required to start the dataset name with the module name, followed by a dot, then the dataset name. | keyword | |
| event.duration | Duration of the event in nanoseconds. If event.start and event.end are known this value should be the difference between the end and start time. | long | |
| event.module | Name of the module this data is coming from. If your monitoring agent supports the concept of modules or plugins to process events of a given source (e.g. Apache logs), event.module should contain the name of this module. |
keyword | |
| host.name | Name of the host. It can contain what hostname returns on Unix systems, the fully qualified domain name, or a name specified by the user. The sender decides which value to use. |
keyword | |
| index_recovery.shards.start_time_in_millis | alias | ||
| index_recovery.shards.stop_time_in_millis | alias | ||
| index_stats.index | alias | ||
| index_stats.primaries.docs.count | alias | ||
| index_stats.primaries.indexing.index_time_in_millis | alias | ||
| index_stats.primaries.indexing.index_total | alias | ||
| index_stats.primaries.indexing.throttle_time_in_millis | alias | ||
| index_stats.primaries.merges.total_size_in_bytes | alias | ||
| index_stats.primaries.refresh.total_time_in_millis | alias | ||
| index_stats.primaries.segments.count | alias | ||
| index_stats.primaries.store.size_in_bytes | alias | ||
| index_stats.total.fielddata.memory_size_in_bytes | alias | ||
| index_stats.total.indexing.index_time_in_millis | alias | ||
| index_stats.total.indexing.index_total | alias | ||
| index_stats.total.indexing.throttle_time_in_millis | alias | ||
| index_stats.total.merges.total_size_in_bytes | alias | ||
| index_stats.total.query_cache.memory_size_in_bytes | alias | ||
| index_stats.total.refresh.total_time_in_millis | alias | ||
| index_stats.total.request_cache.memory_size_in_bytes | alias | ||
| index_stats.total.search.query_time_in_millis | alias | ||
| index_stats.total.search.query_total | alias | ||
| index_stats.total.segments.count | alias | ||
| index_stats.total.segments.doc_values_memory_in_bytes | alias | ||
| index_stats.total.segments.fixed_bit_set_memory_in_bytes | alias | ||
| index_stats.total.segments.index_writer_memory_in_bytes | alias | ||
| index_stats.total.segments.memory_in_bytes | alias | ||
| index_stats.total.segments.norms_memory_in_bytes | alias | ||
| index_stats.total.segments.points_memory_in_bytes | alias | ||
| index_stats.total.segments.stored_fields_memory_in_bytes | alias | ||
| index_stats.total.segments.term_vectors_memory_in_bytes | alias | ||
| index_stats.total.segments.terms_memory_in_bytes | alias | ||
| index_stats.total.segments.version_map_memory_in_bytes | alias | ||
| index_stats.total.store.size_in_bytes | alias | ||
| indices_stats._all.primaries.indexing.index_time_in_millis | alias | ||
| indices_stats._all.primaries.indexing.index_total | alias | ||
| indices_stats._all.total.indexing.index_total | alias | ||
| indices_stats._all.total.search.query_time_in_millis | alias | ||
| indices_stats._all.total.search.query_total | alias | ||
| service.address | Service address | keyword | |
| service.name | Name of the service data is collected from. The name of the service is normally user given. This allows for distributed services that run on multiple hosts to correlate the related instances based on the name. In the case of Elasticsearch the service.name could contain the cluster name. For Beats the service.name is by default a copy of the service.type field if no name is specified. |
keyword | |
| service.type | The type of the service data is collected from. The type can be used to group and correlate logs and metrics from one service type. Example: If logs or metrics are collected from Elasticsearch, service.type would be elasticsearch. |
keyword | |
| source_node.name | alias | ||
| source_node.uuid | alias | ||
| timestamp | alias |
By default only data about indices which are under active recovery are fetched.
To gather data about all indices set active_only: false.
Example
{
    "@timestamp": "2022-10-11T11:52:45.280Z",
    "agent": {
        "ephemeral_id": "7047b7d7-b0f6-412b-a884-19c38671acf5",
        "id": "79e48fe3-2ecd-4021-aed5-6e7e69d47606",
        "name": "docker-fleet-agent",
        "type": "metricbeat",
        "version": "8.5.0"
    },
    "data_stream": {
        "dataset": "elasticsearch.stack_monitoring.index_recovery",
        "namespace": "ep",
        "type": "metrics"
    },
    "ecs": {
        "version": "8.0.0"
    },
    "elastic_agent": {
        "id": "79e48fe3-2ecd-4021-aed5-6e7e69d47606",
        "snapshot": true,
        "version": "8.5.0"
    },
    "elasticsearch": {
        "cluster": {
            "id": "5-S01HJrSLyI2D9Bfsqkxg",
            "name": "elasticsearch"
        },
        "index": {
            "name": "test_2",
            "recovery": {
                "id": 0,
                "index": {
                    "files": {
                        "percent": "0.0%",
                        "recovered": 0,
                        "reused": 0,
                        "total": 0
                    },
                    "size": {
                        "recovered_in_bytes": 0,
                        "reused_in_bytes": 0,
                        "total_in_bytes": 0
                    }
                },
                "name": "test_2",
                "primary": true,
                "source": {},
                "stage": "DONE",
                "start_time": {
                    "ms": 1665489151996
                },
                "stop_time": {
                    "ms": 1665489152026
                },
                "total_time": {
                    "ms": 30
                },
                "target": {
                    "host": "127.0.0.1",
                    "id": "lVVKbuXvSs2koSpkreME3w",
                    "name": "c82dbd707c75",
                    "transport_address": "127.0.0.1:9300"
                },
                "translog": {
                    "percent": "100.0%",
                    "total": 0,
                    "total_on_start": 0
                },
                "type": "EMPTY_STORE"
            }
        }
    },
    "event": {
        "agent_id_status": "verified",
        "dataset": "elasticsearch.stack_monitoring.index_recovery",
        "duration": 70728584,
        "ingested": "2022-10-11T11:52:46Z",
        "module": "elasticsearch"
    },
    "host": {
        "architecture": "x86_64",
        "containerized": false,
        "hostname": "docker-fleet-agent",
        "id": "b6bc6723e51b43959ce07f0c3105c72d",
        "ip": [
            "192.168.0.7"
        ],
        "mac": [
            "02-42-C0-A8-00-07"
        ],
        "name": "docker-fleet-agent",
        "os": {
            "codename": "focal",
            "family": "debian",
            "kernel": "5.10.124-linuxkit",
            "name": "Ubuntu",
            "platform": "ubuntu",
            "type": "linux",
            "version": "20.04.5 LTS (Focal Fossa)"
        }
    },
    "metricset": {
        "name": "index_recovery",
        "period": 10000
    },
    "service": {
        "address": "http://elastic-package-service-elasticsearch-1:9200",
        "name": "elasticsearch",
        "type": "elasticsearch"
    }
}
Exported fields
| Field | Description | Type | Metric Type |
|---|---|---|---|
| @timestamp | Date/time when the event originated. This is the date/time extracted from the event, typically representing when the event was generated by the source. If the event source has no original timestamp, this value is typically populated by the first time the event was received by the pipeline. Required field for all events. | date | |
| agent.id | Unique identifier of this agent (if one exists). Example: For Beats this would be beat.id. | keyword | |
| cluster_uuid | alias | ||
| data_stream.dataset | Data stream dataset. | constant_keyword | |
| data_stream.namespace | Data stream namespace. | constant_keyword | |
| data_stream.type | Data stream type. | constant_keyword | |
| ecs.version | ECS version this event conforms to. ecs.version is a required field and must exist in all events. When querying across multiple indices -- which may conform to slightly different ECS versions -- this field lets integrations adjust to the schema version of the events. |
keyword | |
| elasticsearch.cluster.id | Elasticsearch cluster id. | keyword | |
| elasticsearch.cluster.name | Elasticsearch cluster name. | keyword | |
| elasticsearch.cluster.state.id | Elasticsearch state id. | keyword | |
| elasticsearch.index.name | keyword | ||
| elasticsearch.index.recovery.id | Shard recovery id. | long | |
| elasticsearch.index.recovery.index.files.percent | keyword | ||
| elasticsearch.index.recovery.index.files.recovered | long | gauge | |
| elasticsearch.index.recovery.index.files.reused | long | gauge | |
| elasticsearch.index.recovery.index.files.total | long | gauge | |
| elasticsearch.index.recovery.index.size.recovered_in_bytes | long | gauge | |
| elasticsearch.index.recovery.index.size.reused_in_bytes | long | gauge | |
| elasticsearch.index.recovery.index.size.total_in_bytes | long | gauge | |
| elasticsearch.index.recovery.name | keyword | ||
| elasticsearch.index.recovery.primary | True if primary shard. | boolean | |
| elasticsearch.index.recovery.source.host | Source node host address (could be IP address or hostname). | keyword | |
| elasticsearch.index.recovery.source.id | Source node id. | keyword | |
| elasticsearch.index.recovery.source.name | Source node name. | keyword | |
| elasticsearch.index.recovery.source.transport_address | keyword | ||
| elasticsearch.index.recovery.stage | Recovery stage. | keyword | |
| elasticsearch.index.recovery.start_time.ms | long | gauge | |
| elasticsearch.index.recovery.stop_time.ms | long | gauge | |
| elasticsearch.index.recovery.target.host | Target node host address (could be IP address or hostname). | keyword | |
| elasticsearch.index.recovery.target.id | Target node id. | keyword | |
| elasticsearch.index.recovery.target.name | Target node name. | keyword | |
| elasticsearch.index.recovery.target.transport_address | keyword | ||
| elasticsearch.index.recovery.total_time.ms | long | gauge | |
| elasticsearch.index.recovery.translog.percent | keyword | ||
| elasticsearch.index.recovery.translog.total | long | gauge | |
| elasticsearch.index.recovery.translog.total_on_start | long | gauge | |
| elasticsearch.index.recovery.type | Shard recovery type. | keyword | |
| elasticsearch.index.recovery.verify_index.check_index_time.ms | long | gauge | |
| elasticsearch.index.recovery.verify_index.total_time.ms | long | gauge | |
| elasticsearch.node.id | Node ID | keyword | |
| elasticsearch.node.master | Is the node the master node? | boolean | |
| elasticsearch.node.mlockall | Is mlockall enabled on the node? | boolean | |
| elasticsearch.node.name | Node name. | keyword | |
| error.message | Error message. | match_only_text | |
| event.dataset | Name of the dataset. If an event source publishes more than one type of log or events (e.g. access log, error log), the dataset is used to specify which one the event comes from. It's recommended but not required to start the dataset name with the module name, followed by a dot, then the dataset name. | keyword | |
| event.duration | Duration of the event in nanoseconds. If event.start and event.end are known this value should be the difference between the end and start time. | long | |
| event.module | Name of the module this data is coming from. If your monitoring agent supports the concept of modules or plugins to process events of a given source (e.g. Apache logs), event.module should contain the name of this module. |
keyword | |
| host.name | Name of the host. It can contain what hostname returns on Unix systems, the fully qualified domain name, or a name specified by the user. The sender decides which value to use. |
keyword | |
| index_recovery.shards.start_time_in_millis | alias | ||
| index_recovery.shards.stop_time_in_millis | alias | ||
| index_recovery.shards.total_time_in_millis | alias | ||
| service.address | Service address | keyword | |
| service.name | Name of the service data is collected from. The name of the service is normally user given. This allows for distributed services that run on multiple hosts to correlate the related instances based on the name. In the case of Elasticsearch the service.name could contain the cluster name. For Beats the service.name is by default a copy of the service.type field if no name is specified. |
keyword | |
| service.type | The type of the service data is collected from. The type can be used to group and correlate logs and metrics from one service type. Example: If logs or metrics are collected from Elasticsearch, service.type would be elasticsearch. |
keyword | |
| source_node.name | alias | ||
| source_node.uuid | alias | ||
| timestamp | alias |
Example
{
    "@timestamp": "2022-10-11T11:54:00.424Z",
    "agent": {
        "ephemeral_id": "7047b7d7-b0f6-412b-a884-19c38671acf5",
        "id": "79e48fe3-2ecd-4021-aed5-6e7e69d47606",
        "name": "docker-fleet-agent",
        "type": "metricbeat",
        "version": "8.5.0"
    },
    "data_stream": {
        "dataset": "elasticsearch.stack_monitoring.index_summary",
        "namespace": "ep",
        "type": "metrics"
    },
    "ecs": {
        "version": "8.0.0"
    },
    "elastic_agent": {
        "id": "79e48fe3-2ecd-4021-aed5-6e7e69d47606",
        "snapshot": true,
        "version": "8.5.0"
    },
    "elasticsearch": {
        "cluster": {
            "id": "KE1I01h1Qci2TZwKI8uhPQ",
            "name": "elasticsearch"
        },
        "index": {
            "summary": {
                "primaries": {
                    "bulk": {
                        "operations": {
                            "count": 2
                        },
                        "size": {
                            "bytes": 30
                        },
                        "time": {
                            "avg": {
                                "bytes": 2
                            }
                        }
                    },
                    "docs": {
                        "count": 2,
                        "deleted": 0
                    },
                    "indexing": {
                        "index": {
                            "count": 2,
                            "time": {
                                "ms": 3
                            }
                        }
                    },
                    "search": {
                        "query": {
                            "count": 6,
                            "time": {
                                "ms": 2
                            }
                        }
                    },
                    "segments": {
                        "count": 2,
                        "memory": {
                            "bytes": 0
                        }
                    },
                    "store": {
                        "size": {
                            "bytes": 10059
                        }
                    }
                },
                "total": {
                    "bulk": {
                        "operations": {
                            "count": 2
                        },
                        "size": {
                            "bytes": 30
                        },
                        "time": {
                            "avg": {
                                "bytes": 2
                            }
                        }
                    },
                    "docs": {
                        "count": 2,
                        "deleted": 0
                    },
                    "indexing": {
                        "index": {
                            "count": 2,
                            "time": {
                                "ms": 3
                            }
                        }
                    },
                    "search": {
                        "query": {
                            "count": 6,
                            "time": {
                                "ms": 2
                            }
                        }
                    },
                    "segments": {
                        "count": 2,
                        "memory": {
                            "bytes": 0
                        }
                    },
                    "store": {
                        "size": {
                            "bytes": 10059
                        }
                    }
                }
            }
        }
    },
    "event": {
        "agent_id_status": "verified",
        "dataset": "elasticsearch.stack_monitoring.index_summary",
        "duration": 89177084,
        "ingested": "2022-10-11T11:54:01Z",
        "module": "elasticsearch"
    },
    "host": {
        "architecture": "x86_64",
        "containerized": false,
        "hostname": "docker-fleet-agent",
        "id": "b6bc6723e51b43959ce07f0c3105c72d",
        "ip": [
            "192.168.0.7"
        ],
        "mac": [
            "02-42-C0-A8-00-07"
        ],
        "name": "docker-fleet-agent",
        "os": {
            "codename": "focal",
            "family": "debian",
            "kernel": "5.10.124-linuxkit",
            "name": "Ubuntu",
            "platform": "ubuntu",
            "type": "linux",
            "version": "20.04.5 LTS (Focal Fossa)"
        }
    },
    "metricset": {
        "name": "index_summary",
        "period": 10000
    },
    "service": {
        "address": "http://elastic-package-service-elasticsearch-1:9200",
        "name": "elasticsearch",
        "type": "elasticsearch"
    }
}
Exported fields
| Field | Description | Type | Metric Type |
|---|---|---|---|
| @timestamp | Date/time when the event originated. This is the date/time extracted from the event, typically representing when the event was generated by the source. If the event source has no original timestamp, this value is typically populated by the first time the event was received by the pipeline. Required field for all events. | date | |
| agent.id | Unique identifier of this agent (if one exists). Example: For Beats this would be beat.id. | keyword | |
| cluster_uuid | alias | ||
| data_stream.dataset | Data stream dataset. | constant_keyword | |
| data_stream.namespace | Data stream namespace. | constant_keyword | |
| data_stream.type | Data stream type. | constant_keyword | |
| ecs.version | ECS version this event conforms to. ecs.version is a required field and must exist in all events. When querying across multiple indices -- which may conform to slightly different ECS versions -- this field lets integrations adjust to the schema version of the events. |
keyword | |
| elasticsearch.cluster.id | Elasticsearch cluster id. | keyword | |
| elasticsearch.cluster.name | Elasticsearch cluster name. | keyword | |
| elasticsearch.cluster.state.id | Elasticsearch state id. | keyword | |
| elasticsearch.index.summary.primaries.bulk.operations.count | long | gauge | |
| elasticsearch.index.summary.primaries.bulk.size.bytes | long | gauge | |
| elasticsearch.index.summary.primaries.bulk.time.avg.bytes | long | gauge | |
| elasticsearch.index.summary.primaries.bulk.time.avg.ms | long | gauge | |
| elasticsearch.index.summary.primaries.bulk.time.count.ms | long | counter | |
| elasticsearch.index.summary.primaries.docs.count | Total number of documents in the index. | long | gauge |
| elasticsearch.index.summary.primaries.docs.deleted | Total number of deleted documents in the index. | long | gauge |
| elasticsearch.index.summary.primaries.indexing.index.count | long | gauge | |
| elasticsearch.index.summary.primaries.indexing.index.time.ms | long | gauge | |
| elasticsearch.index.summary.primaries.search.query.count | long | counter | |
| elasticsearch.index.summary.primaries.search.query.time.ms | long | counter | |
| elasticsearch.index.summary.primaries.segments.count | Total number of index segments. | long | gauge |
| elasticsearch.index.summary.primaries.segments.memory.bytes | Total number of memory used by the segments in bytes. | long | gauge |
| elasticsearch.index.summary.primaries.store.size.bytes | Total size of the index in bytes. | long | gauge |
| elasticsearch.index.summary.primaries.store.total_data_set_size.bytes | Total size of the index in bytes including backing data for partially mounted indices. | long | gauge |
| elasticsearch.index.summary.total.bulk.operations.count | long | gauge | |
| elasticsearch.index.summary.total.bulk.size.bytes | long | gauge | |
| elasticsearch.index.summary.total.bulk.time.avg.bytes | long | gauge | |
| elasticsearch.index.summary.total.bulk.time.avg.ms | long | gauge | |
| elasticsearch.index.summary.total.docs.count | Total number of documents in the index. | long | gauge |
| elasticsearch.index.summary.total.docs.deleted | Total number of deleted documents in the index. | long | gauge |
| elasticsearch.index.summary.total.indexing.index.count | long | gauge | |
| elasticsearch.index.summary.total.indexing.index.time.ms | long | gauge | |
| elasticsearch.index.summary.total.indexing.is_throttled | boolean | ||
| elasticsearch.index.summary.total.indexing.throttle_time.ms | long | gauge | |
| elasticsearch.index.summary.total.search.query.count | long | counter | |
| elasticsearch.index.summary.total.search.query.time.ms | long | counter | |
| elasticsearch.index.summary.total.segments.count | Total number of index segments. | long | gauge |
| elasticsearch.index.summary.total.segments.memory.bytes | Total number of memory used by the segments in bytes. | long | gauge |
| elasticsearch.index.summary.total.store.size.bytes | Total size of the index in bytes. | long | gauge |
| elasticsearch.index.summary.total.store.total_data_set_size.bytes | Total size of the index in bytes including backing data for partially mounted indices. | long | gauge |
| elasticsearch.node.id | Node ID | keyword | |
| elasticsearch.node.master | Is the node the master node? | boolean | |
| elasticsearch.node.mlockall | Is mlockall enabled on the node? | boolean | |
| elasticsearch.node.name | Node name. | keyword | |
| error.message | Error message. | match_only_text | |
| event.dataset | Name of the dataset. If an event source publishes more than one type of log or events (e.g. access log, error log), the dataset is used to specify which one the event comes from. It's recommended but not required to start the dataset name with the module name, followed by a dot, then the dataset name. | keyword | |
| event.duration | Duration of the event in nanoseconds. If event.start and event.end are known this value should be the difference between the end and start time. | long | |
| event.module | Name of the module this data is coming from. If your monitoring agent supports the concept of modules or plugins to process events of a given source (e.g. Apache logs), event.module should contain the name of this module. |
keyword | |
| host.name | Name of the host. It can contain what hostname returns on Unix systems, the fully qualified domain name, or a name specified by the user. The sender decides which value to use. |
keyword | |
| indices_stats._all.primaries.indexing.index_time_in_millis | alias | ||
| indices_stats._all.primaries.indexing.index_total | alias | ||
| indices_stats._all.total.indexing.index_total | alias | ||
| indices_stats._all.total.search.query_time_in_millis | alias | ||
| indices_stats._all.total.search.query_total | alias | ||
| service.address | Service address | keyword | |
| service.name | Name of the service data is collected from. The name of the service is normally user given. This allows for distributed services that run on multiple hosts to correlate the related instances based on the name. In the case of Elasticsearch the service.name could contain the cluster name. For Beats the service.name is by default a copy of the service.type field if no name is specified. |
keyword | |
| service.type | The type of the service data is collected from. The type can be used to group and correlate logs and metrics from one service type. Example: If logs or metrics are collected from Elasticsearch, service.type would be elasticsearch. |
keyword | |
| source_node.name | alias | ||
| source_node.uuid | alias | ||
| timestamp | alias |
If you have Machine Learning jobs, this data stream will interrogate the Machine Learning Anomaly Detection API and requires Machine Learning to be enabled.
Example
{
    "@timestamp": "2022-10-11T11:55:13.602Z",
    "agent": {
        "ephemeral_id": "7047b7d7-b0f6-412b-a884-19c38671acf5",
        "id": "79e48fe3-2ecd-4021-aed5-6e7e69d47606",
        "name": "docker-fleet-agent",
        "type": "metricbeat",
        "version": "8.5.0"
    },
    "data_stream": {
        "dataset": "elasticsearch.stack_monitoring.ml_job",
        "namespace": "ep",
        "type": "metrics"
    },
    "ecs": {
        "version": "8.0.0"
    },
    "elastic_agent": {
        "id": "79e48fe3-2ecd-4021-aed5-6e7e69d47606",
        "snapshot": true,
        "version": "8.5.0"
    },
    "elasticsearch": {
        "cluster": {
            "id": "qRprxEWySBqONwPW_2ga6Q",
            "name": "elasticsearch"
        },
        "ml": {
            "job": {
                "data_counts": {
                    "invalid_date_count": 0,
                    "processed_record_count": 0
                },
                "forecasts_stats": {
                    "total": 0
                },
                "id": "test-job1",
                "model_size": {
                    "memory_status": "ok"
                },
                "state": "opened"
            }
        },
        "node": {
            "id": "2eRkSFTXSLie_seiHf4Y1A",
            "name": "efacd89a6e88"
        }
    },
    "event": {
        "agent_id_status": "verified",
        "dataset": "elasticsearch.stack_monitoring.ml_job",
        "duration": 93589542,
        "ingested": "2022-10-11T11:55:14Z",
        "module": "elasticsearch"
    },
    "host": {
        "architecture": "x86_64",
        "containerized": false,
        "hostname": "docker-fleet-agent",
        "id": "b6bc6723e51b43959ce07f0c3105c72d",
        "ip": [
            "192.168.0.7"
        ],
        "mac": [
            "02-42-C0-A8-00-07"
        ],
        "name": "docker-fleet-agent",
        "os": {
            "codename": "focal",
            "family": "debian",
            "kernel": "5.10.124-linuxkit",
            "name": "Ubuntu",
            "platform": "ubuntu",
            "type": "linux",
            "version": "20.04.5 LTS (Focal Fossa)"
        }
    },
    "metricset": {
        "name": "ml_job",
        "period": 10000
    },
    "service": {
        "address": "http://elastic-package-service-elasticsearch-1:9200",
        "name": "elasticsearch",
        "type": "elasticsearch"
    }
}
Exported fields
| Field | Description | Type | Metric Type |
|---|---|---|---|
| @timestamp | Date/time when the event originated. This is the date/time extracted from the event, typically representing when the event was generated by the source. If the event source has no original timestamp, this value is typically populated by the first time the event was received by the pipeline. Required field for all events. | date | |
| agent.id | Unique identifier of this agent (if one exists). Example: For Beats this would be beat.id. | keyword | |
| cluster_uuid | alias | ||
| data_stream.dataset | Data stream dataset. | constant_keyword | |
| data_stream.namespace | Data stream namespace. | constant_keyword | |
| data_stream.type | Data stream type. | constant_keyword | |
| ecs.version | ECS version this event conforms to. ecs.version is a required field and must exist in all events. When querying across multiple indices -- which may conform to slightly different ECS versions -- this field lets integrations adjust to the schema version of the events. |
keyword | |
| elasticsearch.cluster.id | Elasticsearch cluster id. | keyword | |
| elasticsearch.cluster.name | Elasticsearch cluster name. | keyword | |
| elasticsearch.cluster.state.id | Elasticsearch state id. | keyword | |
| elasticsearch.ml.job.data.invalid_date.count | The number of records with either a missing date field or a date that could not be parsed. | long | gauge |
| elasticsearch.ml.job.data_counts.invalid_date_count | long | gauge | |
| elasticsearch.ml.job.data_counts.processed_record_count | Processed data events. | long | gauge |
| elasticsearch.ml.job.forecasts_stats.total | long | gauge | |
| elasticsearch.ml.job.id | Unique ml job id. | keyword | |
| elasticsearch.ml.job.model_size.memory_status | keyword | ||
| elasticsearch.ml.job.state | Job state. | keyword | |
| elasticsearch.node.id | Node ID | keyword | |
| elasticsearch.node.master | Is the node the master node? | boolean | |
| elasticsearch.node.mlockall | Is mlockall enabled on the node? | boolean | |
| elasticsearch.node.name | Node name. | keyword | |
| error.message | Error message. | match_only_text | |
| event.dataset | Name of the dataset. If an event source publishes more than one type of log or events (e.g. access log, error log), the dataset is used to specify which one the event comes from. It's recommended but not required to start the dataset name with the module name, followed by a dot, then the dataset name. | keyword | |
| event.duration | Duration of the event in nanoseconds. If event.start and event.end are known this value should be the difference between the end and start time. | long | |
| event.module | Name of the module this data is coming from. If your monitoring agent supports the concept of modules or plugins to process events of a given source (e.g. Apache logs), event.module should contain the name of this module. |
keyword | |
| host.name | Name of the host. It can contain what hostname returns on Unix systems, the fully qualified domain name, or a name specified by the user. The sender decides which value to use. |
keyword | |
| job_stats.forecasts_stats.total | alias | ||
| job_stats.job_id | alias | ||
| service.address | Service address | keyword | |
| service.name | Name of the service data is collected from. The name of the service is normally user given. This allows for distributed services that run on multiple hosts to correlate the related instances based on the name. In the case of Elasticsearch the service.name could contain the cluster name. For Beats the service.name is by default a copy of the service.type field if no name is specified. |
keyword | |
| service.type | The type of the service data is collected from. The type can be used to group and correlate logs and metrics from one service type. Example: If logs or metrics are collected from Elasticsearch, service.type would be elasticsearch. |
keyword | |
| source_node.name | alias | ||
| source_node.uuid | alias | ||
| timestamp | alias |
node interrogates the
Cluster API endpoint of
Elasticsearch to get cluster nodes information. It only fetches the data from the _local node so it must
run on each Elasticsearch node.
Example
{
    "@timestamp": "2022-10-11T11:56:26.591Z",
    "agent": {
        "ephemeral_id": "7047b7d7-b0f6-412b-a884-19c38671acf5",
        "id": "79e48fe3-2ecd-4021-aed5-6e7e69d47606",
        "name": "docker-fleet-agent",
        "type": "metricbeat",
        "version": "8.5.0"
    },
    "data_stream": {
        "dataset": "elasticsearch.stack_monitoring.node",
        "namespace": "ep",
        "type": "metrics"
    },
    "ecs": {
        "version": "8.0.0"
    },
    "elastic_agent": {
        "id": "79e48fe3-2ecd-4021-aed5-6e7e69d47606",
        "snapshot": true,
        "version": "8.5.0"
    },
    "elasticsearch": {
        "cluster": {
            "id": "dww9JUOzQyS8iokOwczS9Q",
            "name": "elasticsearch"
        },
        "node": {
            "id": "8IzM7B10S7yuldzLETfv0w",
            "jvm": {
                "memory": {
                    "heap": {
                        "init": {
                            "bytes": 1073741824
                        },
                        "max": {
                            "bytes": 1073741824
                        }
                    },
                    "nonheap": {
                        "init": {
                            "bytes": 7667712
                        },
                        "max": {
                            "bytes": 0
                        }
                    }
                },
                "version": "18.0.2.1"
            },
            "name": "d07bc5926662",
            "process": {
                "mlockall": false
            },
            "version": "8.5.0"
        }
    },
    "event": {
        "agent_id_status": "verified",
        "dataset": "elasticsearch.stack_monitoring.node",
        "duration": 63219000,
        "ingested": "2022-10-11T11:56:27Z",
        "module": "elasticsearch"
    },
    "host": {
        "architecture": "x86_64",
        "containerized": false,
        "hostname": "docker-fleet-agent",
        "id": "b6bc6723e51b43959ce07f0c3105c72d",
        "ip": [
            "192.168.0.7"
        ],
        "mac": [
            "02-42-C0-A8-00-07"
        ],
        "name": "docker-fleet-agent",
        "os": {
            "codename": "focal",
            "family": "debian",
            "kernel": "5.10.124-linuxkit",
            "name": "Ubuntu",
            "platform": "ubuntu",
            "type": "linux",
            "version": "20.04.5 LTS (Focal Fossa)"
        }
    },
    "metricset": {
        "name": "node",
        "period": 10000
    },
    "service": {
        "address": "http://elastic-package-service-elasticsearch-1:9200",
        "name": "elasticsearch",
        "type": "elasticsearch"
    }
}
Exported fields
| Field | Description | Type | Metric Type |
|---|---|---|---|
| @timestamp | Date/time when the event originated. This is the date/time extracted from the event, typically representing when the event was generated by the source. If the event source has no original timestamp, this value is typically populated by the first time the event was received by the pipeline. Required field for all events. | date | |
| agent.id | Unique identifier of this agent (if one exists). Example: For Beats this would be beat.id. | keyword | |
| cluster_uuid | alias | ||
| data_stream.dataset | Data stream dataset. | constant_keyword | |
| data_stream.namespace | Data stream namespace. | constant_keyword | |
| data_stream.type | Data stream type. | constant_keyword | |
| ecs.version | ECS version this event conforms to. ecs.version is a required field and must exist in all events. When querying across multiple indices -- which may conform to slightly different ECS versions -- this field lets integrations adjust to the schema version of the events. |
keyword | |
| elasticsearch.cluster.id | Elasticsearch cluster id. | keyword | |
| elasticsearch.cluster.name | Elasticsearch cluster name. | keyword | |
| elasticsearch.cluster.state.id | Elasticsearch state id. | keyword | |
| elasticsearch.node.id | Node ID | keyword | |
| elasticsearch.node.jvm.memory.heap.init.bytes | Heap init used by the JVM in bytes. | long | gauge |
| elasticsearch.node.jvm.memory.heap.max.bytes | Heap max used by the JVM in bytes. | long | gauge |
| elasticsearch.node.jvm.memory.nonheap.init.bytes | Non-Heap init used by the JVM in bytes. | long | gauge |
| elasticsearch.node.jvm.memory.nonheap.max.bytes | Non-Heap max used by the JVM in bytes. | long | gauge |
| elasticsearch.node.jvm.version | JVM version. | keyword | |
| elasticsearch.node.master | Is the node the master node? | boolean | |
| elasticsearch.node.mlockall | Is mlockall enabled on the node? | boolean | |
| elasticsearch.node.name | Node name. | keyword | |
| elasticsearch.node.process.mlockall | If process locked in memory. | boolean | |
| elasticsearch.node.version | Node version. | keyword | |
| error.message | Error message. | match_only_text | |
| event.dataset | Name of the dataset. If an event source publishes more than one type of log or events (e.g. access log, error log), the dataset is used to specify which one the event comes from. It's recommended but not required to start the dataset name with the module name, followed by a dot, then the dataset name. | keyword | |
| event.duration | Duration of the event in nanoseconds. If event.start and event.end are known this value should be the difference between the end and start time. | long | |
| event.module | Name of the module this data is coming from. If your monitoring agent supports the concept of modules or plugins to process events of a given source (e.g. Apache logs), event.module should contain the name of this module. |
keyword | |
| host.name | Name of the host. It can contain what hostname returns on Unix systems, the fully qualified domain name, or a name specified by the user. The sender decides which value to use. |
keyword | |
| service.address | Service address | keyword | |
| service.name | Name of the service data is collected from. The name of the service is normally user given. This allows for distributed services that run on multiple hosts to correlate the related instances based on the name. In the case of Elasticsearch the service.name could contain the cluster name. For Beats the service.name is by default a copy of the service.type field if no name is specified. |
keyword | |
| service.type | The type of the service data is collected from. The type can be used to group and correlate logs and metrics from one service type. Example: If logs or metrics are collected from Elasticsearch, service.type would be elasticsearch. |
keyword | |
| source_node.name | alias | ||
| source_node.uuid | alias | ||
| timestamp | alias |
node_stats interrogates the
Cluster API endpoint of
Elasticsearch to get the cluster nodes statistics. The data received is only for the local node so the Agent has
to be run on each Elasticsearch node.
The indices stats are node-specific. That means for example the total number of docs reported by all nodes together is not the total number of documents in all indices as there can also be replicas.
Example
{
"@timestamp": "2023-03-31T16:04:42.359Z",
"agent": {
"ephemeral_id": "1a9923cc-6cfb-4e24-af90-4dadc280ce65",
"id": "91796116-33d0-4b72-a8dc-6f878fc9c156",
"name": "docker-fleet-agent",
"type": "metricbeat",
"version": "8.8.0"
},
"data_stream": {
"dataset": "elasticsearch.stack_monitoring.node_stats",
"namespace": "ep",
"type": "metrics"
},
"ecs": {
"version": "8.0.0"
},
"elastic_agent": {
"id": "91796116-33d0-4b72-a8dc-6f878fc9c156",
"snapshot": true,
"version": "8.8.0"
},
"elasticsearch": {
"cluster": {
"id": "Ipm1WsqqRB6oapcw_SS2Eg",
"name": "elasticsearch"
},
"node": {
"id": "gdgi4QNVQ_-dHq9HLnRlQA",
"master": true,
"mlockall": false,
"name": "04ab345e3ac8",
"roles": [
"data",
"data_cold",
"data_content",
"data_frozen",
"data_hot",
"data_warm",
"ingest",
"master",
"ml",
"remote_cluster_client",
"transform"
],
"stats": {
"fs": {
"io_stats": {},
"summary": {
"available": {
"bytes": 39146156032
},
"free": {
"bytes": 42362871808
},
"total": {
"bytes": 62671097856
}
},
"total": {
"available_in_bytes": 39146156032,
"total_in_bytes": 62671097856
}
},
"indexing_pressure": {
"memory": {
"current": {
"all": {
"bytes": 0
},
"combined_coordinating_and_primary": {
"bytes": 0
},
"coordinating": {
"bytes": 0
},
"primary": {
"bytes": 0
},
"replica": {
"bytes": 0
}
},
"limit_in_bytes": 107374182,
"total": {
"all": {
"bytes": 20484
},
"combined_coordinating_and_primary": {
"bytes": 20484
},
"coordinating": {
"bytes": 20484,
"rejections": 0
},
"primary": {
"bytes": 27900,
"rejections": 0
},
"replica": {
"bytes": 0,
"rejections": 0
}
}
}
},
"indices": {
"bulk": {
"avg_size": {
"bytes": 92
},
"avg_time": {
"ms": 0
},
"operations": {
"total": {
"count": 29
}
},
"total_size": {
"bytes": 10684
},
"total_time": {
"ms": 131
}
},
"docs": {
"count": 38,
"deleted": 1
},
"fielddata": {
"memory": {
"bytes": 0
}
},
"indexing": {
"index_time": {
"ms": 43
},
"index_total": {
"count": 67
},
"throttle_time": {
"ms": 0
}
},
"query_cache": {
"memory": {
"bytes": 0
}
},
"request_cache": {
"memory": {
"bytes": 0
}
},
"search": {
"query_time": {
"ms": 18
},
"query_total": {
"count": 40
}
},
"segments": {
"count": 20,
"doc_values": {
"memory": {
"bytes": 0
}
},
"fixed_bit_set": {
"memory": {
"bytes": 144
}
},
"index_writer": {
"memory": {
"bytes": 124320
}
},
"memory": {
"bytes": 0
},
"norms": {
"memory": {
"bytes": 0
}
},
"points": {
"memory": {
"bytes": 0
}
},
"stored_fields": {
"memory": {
"bytes": 0
}
},
"term_vectors": {
"memory": {
"bytes": 0
}
},
"terms": {
"memory": {
"bytes": 0
}
},
"version_map": {
"memory": {
"bytes": 0
}
}
},
"store": {
"size": {
"bytes": 138577
}
}
},
"ingest": {
"total": {
"count": 40,
"current": 0,
"failed": 0,
"time_in_millis": 4
}
},
"jvm": {
"gc": {
"collectors": {
"old": {
"collection": {
"count": 0,
"ms": 0
}
},
"young": {
"collection": {
"count": 9,
"ms": 84
}
}
}
},
"mem": {
"heap": {
"max": {
"bytes": 1073741824
},
"used": {
"bytes": 198002688,
"pct": 18
}
}
}
},
"os": {
"cgroup": {
"cpu": {
"cfs": {
"quota": {
"us": -1
}
},
"stat": {
"elapsed_periods": {
"count": 0
},
"time_throttled": {
"ns": 0
},
"times_throttled": {
"count": 0
}
}
},
"cpuacct": {
"usage": {
"ns": 32594735
}
},
"memory": {
"control_group": "/",
"limit": {
"bytes": "max"
},
"usage": {
"bytes": "1505935360"
}
}
},
"cpu": {
"load_avg": {
"1m": 1.13
}
}
},
"process": {
"cpu": {
"pct": 1
}
},
"thread_pool": {
"force_merge": {
"queue": {
"count": 0
},
"rejected": {
"count": 0
}
},
"get": {
"queue": {
"count": 0
},
"rejected": {
"count": 0
}
},
"search": {
"queue": {
"count": 0
},
"rejected": {
"count": 0
}
},
"write": {
"queue": {
"count": 0
},
"rejected": {
"count": 0
}
}
}
}
}
},
"event": {
"agent_id_status": "verified",
"dataset": "elasticsearch.stack_monitoring.node_stats",
"duration": 135773209,
"ingested": "2023-03-31T16:04:43Z",
"module": "elasticsearch"
},
"host": {
"architecture": "x86_64",
"containerized": false,
"hostname": "docker-fleet-agent",
"id": "2b5a4ccc72da470e945cff8960ca6475",
"ip": [
"172.31.0.4"
],
"mac": [
"02-42-AC-1F-00-04"
],
"name": "docker-fleet-agent",
"os": {
"codename": "focal",
"family": "debian",
"kernel": "5.15.49-linuxkit",
"name": "Ubuntu",
"platform": "ubuntu",
"type": "linux",
"version": "20.04.5 LTS (Focal Fossa)"
}
},
"metricset": {
"name": "node_stats",
"period": 10000
},
"service": {
"address": "http://elastic-package-service_elasticsearch_1:9200",
"name": "elasticsearch",
"type": "elasticsearch"
}
}
Exported fields
| Field | Description | Type | Metric Type |
|---|---|---|---|
| @timestamp | Date/time when the event originated. This is the date/time extracted from the event, typically representing when the event was generated by the source. If the event source has no original timestamp, this value is typically populated by the first time the event was received by the pipeline. Required field for all events. | date | |
| agent.id | Unique identifier of this agent (if one exists). Example: For Beats this would be beat.id. | keyword | |
| cluster_uuid | alias | ||
| data_stream.dataset | Data stream dataset. | constant_keyword | |
| data_stream.namespace | Data stream namespace. | constant_keyword | |
| data_stream.type | Data stream type. | constant_keyword | |
| ecs.version | ECS version this event conforms to. ecs.version is a required field and must exist in all events. When querying across multiple indices -- which may conform to slightly different ECS versions -- this field lets integrations adjust to the schema version of the events. |
keyword | |
| elasticsearch.cluster.id | Elasticsearch cluster id. | keyword | |
| elasticsearch.cluster.name | Elasticsearch cluster name. | keyword | |
| elasticsearch.cluster.state.id | Elasticsearch state id. | keyword | |
| elasticsearch.node.id | Node ID | keyword | |
| elasticsearch.node.master | Is the node the master node? | boolean | |
| elasticsearch.node.mlockall | Is mlockall enabled on the node? | boolean | |
| elasticsearch.node.name | Node name. | keyword | |
| elasticsearch.node.roles | Node roles | keyword | |
| elasticsearch.node.stats.fs.io_stats.total.operations.count | long | counter | |
| elasticsearch.node.stats.fs.io_stats.total.read.operations.count | long | counter | |
| elasticsearch.node.stats.fs.io_stats.total.write.operations.count | long | counter | |
| elasticsearch.node.stats.fs.summary.available.bytes | long | gauge | |
| elasticsearch.node.stats.fs.summary.free.bytes | long | gauge | |
| elasticsearch.node.stats.fs.summary.total.bytes | long | gauge | |
| elasticsearch.node.stats.fs.total.available_in_bytes | long | gauge | |
| elasticsearch.node.stats.fs.total.total_in_bytes | long | gauge | |
| elasticsearch.node.stats.indexing_pressure.memory.current.all.bytes | long | gauge | |
| elasticsearch.node.stats.indexing_pressure.memory.current.combined_coordinating_and_primary.bytes | long | gauge | |
| elasticsearch.node.stats.indexing_pressure.memory.current.coordinating.bytes | long | gauge | |
| elasticsearch.node.stats.indexing_pressure.memory.current.primary.bytes | long | gauge | |
| elasticsearch.node.stats.indexing_pressure.memory.current.replica.bytes | long | gauge | |
| elasticsearch.node.stats.indexing_pressure.memory.limit_in_bytes | long | gauge | |
| elasticsearch.node.stats.indexing_pressure.memory.total.all.bytes | long | counter | |
| elasticsearch.node.stats.indexing_pressure.memory.total.combined_coordinating_and_primary.bytes | long | counter | |
| elasticsearch.node.stats.indexing_pressure.memory.total.coordinating.bytes | long | counter | |
| elasticsearch.node.stats.indexing_pressure.memory.total.coordinating.rejections | long | counter | |
| elasticsearch.node.stats.indexing_pressure.memory.total.primary.bytes | long | counter | |
| elasticsearch.node.stats.indexing_pressure.memory.total.primary.rejections | long | counter | |
| elasticsearch.node.stats.indexing_pressure.memory.total.replica.bytes | long | counter | |
| elasticsearch.node.stats.indexing_pressure.memory.total.replica.rejections | long | counter | |
| elasticsearch.node.stats.indices.bulk.avg_size.bytes | long | gauge | |
| elasticsearch.node.stats.indices.bulk.avg_time.ms | long | gauge | |
| elasticsearch.node.stats.indices.bulk.operations.total.count | long | counter | |
| elasticsearch.node.stats.indices.bulk.total_size.bytes | long | counter | |
| elasticsearch.node.stats.indices.bulk.total_time.ms | long | counter | |
| elasticsearch.node.stats.indices.docs.count | Total number of existing documents. | long | gauge |
| elasticsearch.node.stats.indices.docs.deleted | Total number of deleted documents. | long | gauge |
| elasticsearch.node.stats.indices.fielddata.memory.bytes | long | gauge | |
| elasticsearch.node.stats.indices.indexing.index_time.ms | long | gauge | |
| elasticsearch.node.stats.indices.indexing.index_total.count | long | counter | |
| elasticsearch.node.stats.indices.indexing.throttle_time.ms | long | gauge | |
| elasticsearch.node.stats.indices.query_cache.memory.bytes | long | gauge | |
| elasticsearch.node.stats.indices.request_cache.memory.bytes | long | gauge | |
| elasticsearch.node.stats.indices.search.query_time.ms | long | counter | |
| elasticsearch.node.stats.indices.search.query_total.count | long | counter | |
| elasticsearch.node.stats.indices.segments.count | Total number of segments. | long | gauge |
| elasticsearch.node.stats.indices.segments.doc_values.memory.bytes | long | gauge | |
| elasticsearch.node.stats.indices.segments.fixed_bit_set.memory.bytes | long | gauge | |
| elasticsearch.node.stats.indices.segments.index_writer.memory.bytes | long | gauge | |
| elasticsearch.node.stats.indices.segments.memory.bytes | Total size of segments in bytes. | long | gauge |
| elasticsearch.node.stats.indices.segments.norms.memory.bytes | long | gauge | |
| elasticsearch.node.stats.indices.segments.points.memory.bytes | long | gauge | |
| elasticsearch.node.stats.indices.segments.stored_fields.memory.bytes | long | gauge | |
| elasticsearch.node.stats.indices.segments.term_vectors.memory.bytes | long | gauge | |
| elasticsearch.node.stats.indices.segments.terms.memory.bytes | long | gauge | |
| elasticsearch.node.stats.indices.segments.version_map.memory.bytes | long | gauge | |
| elasticsearch.node.stats.indices.shard_stats.total_count | long | ||
| elasticsearch.node.stats.indices.store.size.bytes | Total size of the store in bytes. | long | gauge |
| elasticsearch.node.stats.indices.store.total_data_set_size.bytes | Total size of shards in bytes assigned to this node including backing data for partially mounted indices. | long | gauge |
| elasticsearch.node.stats.ingest.total.count | long | counter | |
| elasticsearch.node.stats.ingest.total.current | long | gauge | |
| elasticsearch.node.stats.ingest.total.failed | long | counter | |
| elasticsearch.node.stats.ingest.total.time_in_millis | long | counter | |
| elasticsearch.node.stats.jvm.gc.collectors.old.collection.count | long | counter | |
| elasticsearch.node.stats.jvm.gc.collectors.old.collection.ms | long | counter | |
| elasticsearch.node.stats.jvm.gc.collectors.young.collection.count | long | counter | |
| elasticsearch.node.stats.jvm.gc.collectors.young.collection.ms | long | counter | |
| elasticsearch.node.stats.jvm.mem.heap.max.bytes | long | gauge | |
| elasticsearch.node.stats.jvm.mem.heap.used.bytes | long | gauge | |
| elasticsearch.node.stats.jvm.mem.heap.used.pct | double | gauge | |
| elasticsearch.node.stats.jvm.mem.pools.old.max.bytes | Max bytes. | long | gauge |
| elasticsearch.node.stats.jvm.mem.pools.old.peak.bytes | Peak bytes. | long | gauge |
| elasticsearch.node.stats.jvm.mem.pools.old.peak_max.bytes | Peak max bytes. | long | gauge |
| elasticsearch.node.stats.jvm.mem.pools.old.used.bytes | Used bytes. | long | gauge |
| elasticsearch.node.stats.jvm.mem.pools.survivor.max.bytes | Max bytes. | long | gauge |
| elasticsearch.node.stats.jvm.mem.pools.survivor.peak.bytes | Peak bytes. | long | gauge |
| elasticsearch.node.stats.jvm.mem.pools.survivor.peak_max.bytes | Peak max bytes. | long | gauge |
| elasticsearch.node.stats.jvm.mem.pools.survivor.used.bytes | Used bytes. | long | gauge |
| elasticsearch.node.stats.jvm.mem.pools.young.max.bytes | Max bytes. | long | gauge |
| elasticsearch.node.stats.jvm.mem.pools.young.peak.bytes | Peak bytes. | long | gauge |
| elasticsearch.node.stats.jvm.mem.pools.young.peak_max.bytes | Peak max bytes. | long | gauge |
| elasticsearch.node.stats.jvm.mem.pools.young.used.bytes | Used bytes. | long | gauge |
| elasticsearch.node.stats.os.cgroup.cpu.cfs.quota.us | long | gauge | |
| elasticsearch.node.stats.os.cgroup.cpu.stat.elapsed_periods.count | long | counter | |
| elasticsearch.node.stats.os.cgroup.cpu.stat.time_throttled.ns | long | counter | |
| elasticsearch.node.stats.os.cgroup.cpu.stat.times_throttled.count | long | counter | |
| elasticsearch.node.stats.os.cgroup.cpuacct.usage.ns | long | counter | |
| elasticsearch.node.stats.os.cgroup.memory.control_group | keyword | ||
| elasticsearch.node.stats.os.cgroup.memory.limit.bytes | keyword | ||
| elasticsearch.node.stats.os.cgroup.memory.usage.bytes | keyword | ||
| elasticsearch.node.stats.os.cpu.load_avg.1m | half_float | gauge | |
| elasticsearch.node.stats.process.cpu.pct | double | gauge | |
| elasticsearch.node.stats.thread_pool.bulk.queue.count | long | gauge | |
| elasticsearch.node.stats.thread_pool.bulk.rejected.count | long | counter | |
| elasticsearch.node.stats.thread_pool.force_merge.queue.count | long | gauge | |
| elasticsearch.node.stats.thread_pool.force_merge.rejected.count | long | counter | |
| elasticsearch.node.stats.thread_pool.get.queue.count | long | gauge | |
| elasticsearch.node.stats.thread_pool.get.rejected.count | long | counter | |
| elasticsearch.node.stats.thread_pool.index.queue.count | long | gauge | |
| elasticsearch.node.stats.thread_pool.index.rejected.count | long | counter | |
| elasticsearch.node.stats.thread_pool.search.queue.count | long | gauge | |
| elasticsearch.node.stats.thread_pool.search.rejected.count | long | counter | |
| elasticsearch.node.stats.thread_pool.write.queue.count | long | gauge | |
| elasticsearch.node.stats.thread_pool.write.rejected.count | long | counter | |
| error.message | Error message. | match_only_text | |
| event.dataset | Name of the dataset. If an event source publishes more than one type of log or events (e.g. access log, error log), the dataset is used to specify which one the event comes from. It's recommended but not required to start the dataset name with the module name, followed by a dot, then the dataset name. | keyword | |
| event.duration | Duration of the event in nanoseconds. If event.start and event.end are known this value should be the difference between the end and start time. | long | |
| event.module | Name of the module this data is coming from. If your monitoring agent supports the concept of modules or plugins to process events of a given source (e.g. Apache logs), event.module should contain the name of this module. |
keyword | |
| host.name | Name of the host. It can contain what hostname returns on Unix systems, the fully qualified domain name, or a name specified by the user. The sender decides which value to use. |
keyword | |
| node_stats.fs.io_stats.total.operations | alias | ||
| node_stats.fs.io_stats.total.read_operations | alias | ||
| node_stats.fs.io_stats.total.write_operations | alias | ||
| node_stats.fs.summary.available.bytes | alias | ||
| node_stats.fs.summary.total.bytes | alias | ||
| node_stats.fs.total.available_in_bytes | alias | ||
| node_stats.fs.total.total_in_bytes | alias | ||
| node_stats.indices.docs.count | alias | ||
| node_stats.indices.fielddata.memory_size_in_bytes | alias | ||
| node_stats.indices.indexing.index_time_in_millis | alias | ||
| node_stats.indices.indexing.index_total | alias | ||
| node_stats.indices.indexing.throttle_time_in_millis | alias | ||
| node_stats.indices.query_cache.memory_size_in_bytes | alias | ||
| node_stats.indices.request_cache.memory_size_in_bytes | alias | ||
| node_stats.indices.search.query_time_in_millis | alias | ||
| node_stats.indices.search.query_total | alias | ||
| node_stats.indices.segments.count | alias | ||
| node_stats.indices.segments.doc_values_memory_in_bytes | alias | ||
| node_stats.indices.segments.fixed_bit_set_memory_in_bytes | alias | ||
| node_stats.indices.segments.index_writer_memory_in_bytes | alias | ||
| node_stats.indices.segments.memory_in_bytes | alias | ||
| node_stats.indices.segments.norms_memory_in_bytes | alias | ||
| node_stats.indices.segments.points_memory_in_bytes | alias | ||
| node_stats.indices.segments.stored_fields_memory_in_bytes | alias | ||
| node_stats.indices.segments.term_vectors_memory_in_bytes | alias | ||
| node_stats.indices.segments.terms_memory_in_bytes | alias | ||
| node_stats.indices.segments.version_map_memory_in_bytes | alias | ||
| node_stats.indices.store.size.bytes | alias | ||
| node_stats.indices.store.size_in_bytes | alias | ||
| node_stats.jvm.gc.collectors.old.collection_count | alias | ||
| node_stats.jvm.gc.collectors.old.collection_time_in_millis | alias | ||
| node_stats.jvm.gc.collectors.young.collection_count | alias | ||
| node_stats.jvm.gc.collectors.young.collection_time_in_millis | alias | ||
| node_stats.jvm.mem.heap_max_in_bytes | alias | ||
| node_stats.jvm.mem.heap_used_in_bytes | alias | ||
| node_stats.jvm.mem.heap_used_percent | alias | ||
| node_stats.node_id | alias | ||
| node_stats.os.cgroup.cpu.cfs_quota_micros | alias | ||
| node_stats.os.cgroup.cpu.stat.number_of_elapsed_periods | alias | ||
| node_stats.os.cgroup.cpu.stat.number_of_times_throttled | alias | ||
| node_stats.os.cgroup.cpu.stat.time_throttled_nanos | alias | ||
| node_stats.os.cgroup.cpuacct.usage_nanos | alias | ||
| node_stats.os.cgroup.memory.control_group | alias | ||
| node_stats.os.cgroup.memory.limit_in_bytes | alias | ||
| node_stats.os.cgroup.memory.usage_in_bytes | alias | ||
| node_stats.os.cpu.load_average.1m | alias | ||
| node_stats.process.cpu.percent | alias | ||
| node_stats.thread_pool.bulk.queue | alias | ||
| node_stats.thread_pool.bulk.rejected | alias | ||
| node_stats.thread_pool.get.queue | alias | ||
| node_stats.thread_pool.get.rejected | alias | ||
| node_stats.thread_pool.index.queue | alias | ||
| node_stats.thread_pool.index.rejected | alias | ||
| node_stats.thread_pool.search.queue | alias | ||
| node_stats.thread_pool.search.rejected | alias | ||
| node_stats.thread_pool.write.queue | alias | ||
| node_stats.thread_pool.write.rejected | alias | ||
| service.address | Service address | keyword | |
| service.name | Name of the service data is collected from. The name of the service is normally user given. This allows for distributed services that run on multiple hosts to correlate the related instances based on the name. In the case of Elasticsearch the service.name could contain the cluster name. For Beats the service.name is by default a copy of the service.type field if no name is specified. |
keyword | |
| service.type | The type of the service data is collected from. The type can be used to group and correlate logs and metrics from one service type. Example: If logs or metrics are collected from Elasticsearch, service.type would be elasticsearch. |
keyword | |
| source_node.name | alias | ||
| source_node.uuid | alias | ||
| timestamp | alias |
Example
{
    "agent": {
        "name": "docker-fleet-agent",
        "id": "f11de143-c31c-49a2-8756-83697dbabe0f",
        "ephemeral_id": "3469da57-3138-4702-abc6-8b95e081fc12",
        "type": "metricbeat",
        "version": "8.5.0"
    },
    "@timestamp": "2022-09-21T16:00:34.116Z",
    "elasticsearch": {
        "cluster": {
            "name": "elasticsearch",
            "id": "N9ZLPL5RQHS67eZBrujPYg"
        },
        "pending_tasks": {
            "time_in_queue.ms": 50,
            "source": "create-index [foo-bar-1663776034], cause [api]",
            "priority": "URGENT",
            "insert_order": 3272
        }
    },
    "ecs": {
        "version": "8.0.0"
    },
    "service": {
        "address": "https://elasticsearch:9200",
        "name": "elasticsearch",
        "type": "elasticsearch"
    },
    "data_stream": {
        "namespace": "default",
        "type": "metrics",
        "dataset": "elasticsearch.stack_monitoring.pending_tasks"
    },
    "elastic_agent": {
        "id": "f11de143-c31c-49a2-8756-83697dbabe0f",
        "version": "8.5.0",
        "snapshot": true
    },
    "host": {
        "hostname": "docker-fleet-agent",
        "os": {
            "kernel": "5.10.47-linuxkit",
            "codename": "focal",
            "name": "Ubuntu",
            "family": "debian",
            "type": "linux",
            "version": "20.04.5 LTS (Focal Fossa)",
            "platform": "ubuntu"
        },
        "containerized": true,
        "ip": [
            "172.28.0.7"
        ],
        "name": "docker-fleet-agent",
        "id": "f1eefc91053740c399ff6f1cd52c37bb",
        "mac": [
            "02-42-AC-1C-00-07"
        ],
        "architecture": "x86_64"
    },
    "metricset": {
        "period": 10000,
        "name": "pending_tasks"
    },
    "event": {
        "duration": 4546300,
        "agent_id_status": "verified",
        "ingested": "2022-09-21T16:00:35Z",
        "module": "elasticsearch",
        "dataset": "elasticsearch.stack_monitoring.pending_tasks"
    }
}
Exported fields
| Field | Description | Type |
|---|---|---|
| @timestamp | Date/time when the event originated. This is the date/time extracted from the event, typically representing when the event was generated by the source. If the event source has no original timestamp, this value is typically populated by the first time the event was received by the pipeline. Required field for all events. | date |
| cluster_uuid | alias | |
| data_stream.dataset | Data stream dataset. | constant_keyword |
| data_stream.namespace | Data stream namespace. | constant_keyword |
| data_stream.type | Data stream type. | constant_keyword |
| ecs.version | ECS version this event conforms to. ecs.version is a required field and must exist in all events. When querying across multiple indices -- which may conform to slightly different ECS versions -- this field lets integrations adjust to the schema version of the events. |
keyword |
| elasticsearch.cluster.id | Elasticsearch cluster id. | keyword |
| elasticsearch.cluster.name | Elasticsearch cluster name. | keyword |
| elasticsearch.cluster.state.id | Elasticsearch state id. | keyword |
| elasticsearch.node.id | Node ID | keyword |
| elasticsearch.node.master | Is the node the master node? | boolean |
| elasticsearch.node.mlockall | Is mlockall enabled on the node? | boolean |
| elasticsearch.node.name | Node name. | keyword |
| elasticsearch.pending_tasks.insert_order | Insert order | long |
| elasticsearch.pending_tasks.priority | Priority | keyword |
| elasticsearch.pending_tasks.source | Source. For example: put-mapping | keyword |
| elasticsearch.pending_tasks.time_in_queue.ms | Time in queue | long |
| error.message | Error message. | match_only_text |
| event.dataset | Name of the dataset. If an event source publishes more than one type of log or events (e.g. access log, error log), the dataset is used to specify which one the event comes from. It's recommended but not required to start the dataset name with the module name, followed by a dot, then the dataset name. | keyword |
| event.duration | Duration of the event in nanoseconds. If event.start and event.end are known this value should be the difference between the end and start time. | long |
| event.module | Name of the module this data is coming from. If your monitoring agent supports the concept of modules or plugins to process events of a given source (e.g. Apache logs), event.module should contain the name of this module. |
keyword |
| host.name | Name of the host. It can contain what hostname returns on Unix systems, the fully qualified domain name, or a name specified by the user. The sender decides which value to use. |
keyword |
| service.address | Service address | keyword |
| service.name | Name of the service data is collected from. The name of the service is normally user given. This allows for distributed services that run on multiple hosts to correlate the related instances based on the name. In the case of Elasticsearch the service.name could contain the cluster name. For Beats the service.name is by default a copy of the service.type field if no name is specified. |
keyword |
| service.type | The type of the service data is collected from. The type can be used to group and correlate logs and metrics from one service type. Example: If logs or metrics are collected from Elasticsearch, service.type would be elasticsearch. |
keyword |
| source_node.name | alias | |
| source_node.uuid | alias | |
| timestamp | alias |
security_stats interrogates the Security Stats API endpoint to fetch per-node security statistics. Currently this surfaces the Document Level Security (DLS) bitset cache metrics for each node, which are useful for understanding the memory footprint and cache efficiency of DLS enforcement.
This data stream requires Elasticsearch 9.2.0 or later. On earlier versions the Security Stats API is not available and no metrics will be collected.
Example
{
    "@timestamp": "2026-04-27T20:00:00.000Z",
    "agent": {
        "hostname": "docker-fleet-agent",
        "name": "docker-fleet-agent",
        "id": "60e15e27-7080-4c28-9900-5a087c2ff74c",
        "type": "metricbeat",
        "ephemeral_id": "2b6da727-313f-41fc-84af-3cd928f265c1",
        "version": "9.2.0"
    },
    "elastic_agent": {
        "id": "60e15e27-7080-4c28-9900-5a087c2ff74c",
        "version": "9.2.0",
        "snapshot": true
    },
    "elasticsearch": {
        "cluster": {
            "name": "docker-cluster",
            "id": "WocBBA0QRma0sGpdQ7vLfQ"
        },
        "node": {
            "id": "f5i3v9hMT_q__q6B9WOo5A",
            "name": "instance-0000000019",
            "roles": [
                "data_hot",
                "ingest"
            ],
            "version": "9.2.0"
        },
        "security": {
            "stats": {
                "dls": {
                    "cache": {
                        "entries": {
                            "count": 12
                        },
                        "memory": {
                            "bytes": 4096
                        },
                        "hits": {
                            "count": 8421,
                            "time": {
                                "ms": 51
                            }
                        },
                        "misses": {
                            "count": 137,
                            "time": {
                                "ms": 219
                            }
                        },
                        "evictions": {
                            "count": 4
                        }
                    }
                }
            }
        }
    },
    "ecs": {
        "version": "8.11.0"
    },
    "service": {
        "address": "http://elasticsearch:9200",
        "name": "elasticsearch",
        "type": "elasticsearch"
    },
    "data_stream": {
        "namespace": "default",
        "type": "metrics",
        "dataset": "elasticsearch.stack_monitoring.security_stats"
    },
    "host": {
        "hostname": "docker-fleet-agent",
        "os": {
            "kernel": "5.11.10-arch1-1",
            "codename": "Core",
            "name": "CentOS Linux",
            "type": "linux",
            "family": "redhat",
            "version": "7 (Core)",
            "platform": "centos"
        },
        "containerized": true,
        "ip": [
            "172.18.0.7"
        ],
        "name": "docker-fleet-agent",
        "id": "8979eb4aa312c3dccea3823dd92f92f5",
        "mac": [
            "02:42:ac:12:00:07"
        ],
        "architecture": "x86_64"
    },
    "metricset": {
        "period": 10000,
        "name": "security_stats"
    },
    "event": {
        "duration": 115000,
        "agent_id_status": "verified",
        "ingested": "2026-04-27T20:00:01.000Z",
        "module": "elasticsearch",
        "dataset": "elasticsearch.stack_monitoring.security_stats"
    }
}
Exported fields
| Field | Description | Type | Metric Type |
|---|---|---|---|
| @timestamp | Date/time when the event originated. This is the date/time extracted from the event, typically representing when the event was generated by the source. If the event source has no original timestamp, this value is typically populated by the first time the event was received by the pipeline. Required field for all events. | date | |
| agent.id | Unique identifier of this agent (if one exists). Example: For Beats this would be beat.id. | keyword | |
| cluster_uuid | alias | ||
| data_stream.dataset | Data stream dataset. | constant_keyword | |
| data_stream.namespace | Data stream namespace. | constant_keyword | |
| data_stream.type | Data stream type. | constant_keyword | |
| ecs.version | ECS version this event conforms to. ecs.version is a required field and must exist in all events. When querying across multiple indices -- which may conform to slightly different ECS versions -- this field lets integrations adjust to the schema version of the events. |
keyword | |
| elasticsearch.cluster.id | Elasticsearch cluster id. | keyword | |
| elasticsearch.cluster.name | Elasticsearch cluster name. | keyword | |
| elasticsearch.cluster.state.id | Elasticsearch state id. | keyword | |
| elasticsearch.node.id | Node ID | keyword | |
| elasticsearch.node.master | Is the node the master node? | boolean | |
| elasticsearch.node.mlockall | Is mlockall enabled on the node? | boolean | |
| elasticsearch.node.name | Node name. | keyword | |
| elasticsearch.node.roles | Node roles. | keyword | |
| elasticsearch.node.version | Elasticsearch version reported by the node (for example, 9.2.0). |
keyword | |
| elasticsearch.security.stats.dls.cache.entries.count | Current number of cached entries on this node. | long | gauge |
| elasticsearch.security.stats.dls.cache.evictions.count | Number of entries evicted (due to size limit or expiration) since node startup. | long | counter |
| elasticsearch.security.stats.dls.cache.hits.count | Number of cache lookups served from the cache since node startup. | long | counter |
| elasticsearch.security.stats.dls.cache.hits.time.ms | Cumulative time spent serving cache hits since node startup, in milliseconds. | long | counter |
| elasticsearch.security.stats.dls.cache.memory.bytes | Current memory consumed by the DLS cache on this node, in bytes. | long | gauge |
| elasticsearch.security.stats.dls.cache.misses.count | Number of cache lookups that had to materialize an entry since node startup. | long | counter |
| elasticsearch.security.stats.dls.cache.misses.time.ms | Cumulative time spent materializing entries on cache misses since node startup, in milliseconds. | long | counter |
| error.message | Error message. | match_only_text | |
| event.dataset | Name of the dataset. If an event source publishes more than one type of log or events (e.g. access log, error log), the dataset is used to specify which one the event comes from. It's recommended but not required to start the dataset name with the module name, followed by a dot, then the dataset name. | keyword | |
| event.duration | Duration of the event in nanoseconds. If event.start and event.end are known this value should be the difference between the end and start time. | long | |
| event.module | Name of the module this data is coming from. If your monitoring agent supports the concept of modules or plugins to process events of a given source (e.g. Apache logs), event.module should contain the name of this module. |
keyword | |
| host.name | Name of the host. It can contain what hostname returns on Unix systems, the fully qualified domain name, or a name specified by the user. The sender decides which value to use. |
keyword | |
| service.address | Service address | keyword | |
| service.name | Name of the service data is collected from. The name of the service is normally user given. This allows for distributed services that run on multiple hosts to correlate the related instances based on the name. In the case of Elasticsearch the service.name could contain the cluster name. For Beats the service.name is by default a copy of the service.type field if no name is specified. |
keyword | |
| service.type | The type of the service data is collected from. The type can be used to group and correlate logs and metrics from one service type. Example: If logs or metrics are collected from Elasticsearch, service.type would be elasticsearch. |
keyword | |
| source_node.name | alias | ||
| source_node.uuid | alias | ||
| timestamp | alias |
shard interrogates the
Cluster State API endpoint to fetch
information about all shards.
Example
{
    "@timestamp": "2022-10-11T12:00:04.109Z",
    "agent": {
        "ephemeral_id": "ff5b976d-76c5-46ff-8ca0-b78828af3950",
        "id": "79e48fe3-2ecd-4021-aed5-6e7e69d47606",
        "name": "docker-fleet-agent",
        "type": "metricbeat",
        "version": "8.5.0"
    },
    "data_stream": {
        "dataset": "elasticsearch.stack_monitoring.shard",
        "namespace": "ep",
        "type": "metrics"
    },
    "ecs": {
        "version": "8.0.0"
    },
    "elastic_agent": {
        "id": "79e48fe3-2ecd-4021-aed5-6e7e69d47606",
        "snapshot": true,
        "version": "8.5.0"
    },
    "elasticsearch": {
        "cluster": {
            "id": "rOwlC3lOTzC64KncMOKXkA",
            "name": "elasticsearch",
            "state": {
                "id": "wYk2RYBFT4K4m91iKD2rJQ"
            },
            "stats": {
                "state": {
                    "state_uuid": "wYk2RYBFT4K4m91iKD2rJQ"
                }
            }
        },
        "index": {
            "name": ".ml-anomalies-custom-test-job1"
        },
        "node": {
            "id": "66VKJaFeRDOIwmKcAcvnlA",
            "name": "3d0712405273"
        },
        "shard": {
            "number": 0,
            "primary": true,
            "relocating_node": {},
            "source_node": {
                "name": "3d0712405273",
                "uuid": "66VKJaFeRDOIwmKcAcvnlA"
            },
            "state": "STARTED"
        }
    },
    "event": {
        "agent_id_status": "verified",
        "dataset": "elasticsearch.stack_monitoring.shard",
        "duration": 80668875,
        "ingested": "2022-10-11T12:00:05Z",
        "module": "elasticsearch"
    },
    "host": {
        "architecture": "x86_64",
        "containerized": false,
        "hostname": "docker-fleet-agent",
        "id": "b6bc6723e51b43959ce07f0c3105c72d",
        "ip": [
            "192.168.0.7"
        ],
        "mac": [
            "02-42-C0-A8-00-07"
        ],
        "name": "docker-fleet-agent",
        "os": {
            "codename": "focal",
            "family": "debian",
            "kernel": "5.10.124-linuxkit",
            "name": "Ubuntu",
            "platform": "ubuntu",
            "type": "linux",
            "version": "20.04.5 LTS (Focal Fossa)"
        }
    },
    "metricset": {
        "name": "shard",
        "period": 10000
    },
    "service": {
        "address": "http://elastic-package-service-elasticsearch-1:9200",
        "type": "elasticsearch"
    }
}
Exported fields
| Field | Description | Type |
|---|---|---|
| @timestamp | Date/time when the event originated. This is the date/time extracted from the event, typically representing when the event was generated by the source. If the event source has no original timestamp, this value is typically populated by the first time the event was received by the pipeline. Required field for all events. | date |
| cluster_uuid | alias | |
| data_stream.dataset | Data stream dataset. | constant_keyword |
| data_stream.namespace | Data stream namespace. | constant_keyword |
| data_stream.type | Data stream type. | constant_keyword |
| ecs.version | ECS version this event conforms to. ecs.version is a required field and must exist in all events. When querying across multiple indices -- which may conform to slightly different ECS versions -- this field lets integrations adjust to the schema version of the events. |
keyword |
| elasticsearch.cluster.id | Elasticsearch cluster id. | keyword |
| elasticsearch.cluster.name | Elasticsearch cluster name. | keyword |
| elasticsearch.cluster.state.id | Elasticsearch state id. | keyword |
| elasticsearch.cluster.stats.state.state_uuid | keyword | |
| elasticsearch.index.name | keyword | |
| elasticsearch.node.id | Node ID | keyword |
| elasticsearch.node.master | Is the node the master node? | boolean |
| elasticsearch.node.mlockall | Is mlockall enabled on the node? | boolean |
| elasticsearch.node.name | Node name. | keyword |
| elasticsearch.shard.number | The number of this shard. | long |
| elasticsearch.shard.primary | True if this is the primary shard. | boolean |
| elasticsearch.shard.relocating_node.id | The node the shard was relocated from. It has the exact same value than relocating_node.name for compatibility purposes. | keyword |
| elasticsearch.shard.relocating_node.name | The node the shard was relocated from. | keyword |
| elasticsearch.shard.source_node.name | keyword | |
| elasticsearch.shard.source_node.uuid | keyword | |
| elasticsearch.shard.state | The state of this shard. | keyword |
| error.message | Error message. | match_only_text |
| event.dataset | Name of the dataset. If an event source publishes more than one type of log or events (e.g. access log, error log), the dataset is used to specify which one the event comes from. It's recommended but not required to start the dataset name with the module name, followed by a dot, then the dataset name. | keyword |
| event.duration | Duration of the event in nanoseconds. If event.start and event.end are known this value should be the difference between the end and start time. | long |
| event.module | Name of the module this data is coming from. If your monitoring agent supports the concept of modules or plugins to process events of a given source (e.g. Apache logs), event.module should contain the name of this module. |
keyword |
| host.name | Name of the host. It can contain what hostname returns on Unix systems, the fully qualified domain name, or a name specified by the user. The sender decides which value to use. |
keyword |
| service.address | Service address | keyword |
| service.name | Name of the service data is collected from. The name of the service is normally user given. This allows for distributed services that run on multiple hosts to correlate the related instances based on the name. In the case of Elasticsearch the service.name could contain the cluster name. For Beats the service.name is by default a copy of the service.type field if no name is specified. |
keyword |
| service.type | The type of the service data is collected from. The type can be used to group and correlate logs and metrics from one service type. Example: If logs or metrics are collected from Elasticsearch, service.type would be elasticsearch. |
keyword |
| shard.index | alias | |
| shard.node | alias | |
| shard.primary | alias | |
| shard.shard | alias | |
| shard.state | alias | |
| source_node.name | alias | |
| source_node.uuid | alias | |
| timestamp | alias |
Technical preview: please report any issue here, and specify the "elasticsearch" integration
For version 8.17.1+ of the module and collected data, the integration also installs a transform job called logs-elasticsearch.index_pivot-default-{VERSION}. This transform isn't started by default (Stack management > Transforms), but will perform the following once activated:
- Read the data from the
indexdataset, produced by this very same integration. - Aggregate the index-level stats in data-stream-centric insights, such as query count, query time or overall data volume.
- This aggregated data is then processed through an additional, integration-installed, ingest pipeline (
{VERSION}-monitoring_indices) before being shipped to amonitoring-indicesindex.
You can then visualize the resulting data in the [Elasticsearch] Indices & data streams usage dashboard.
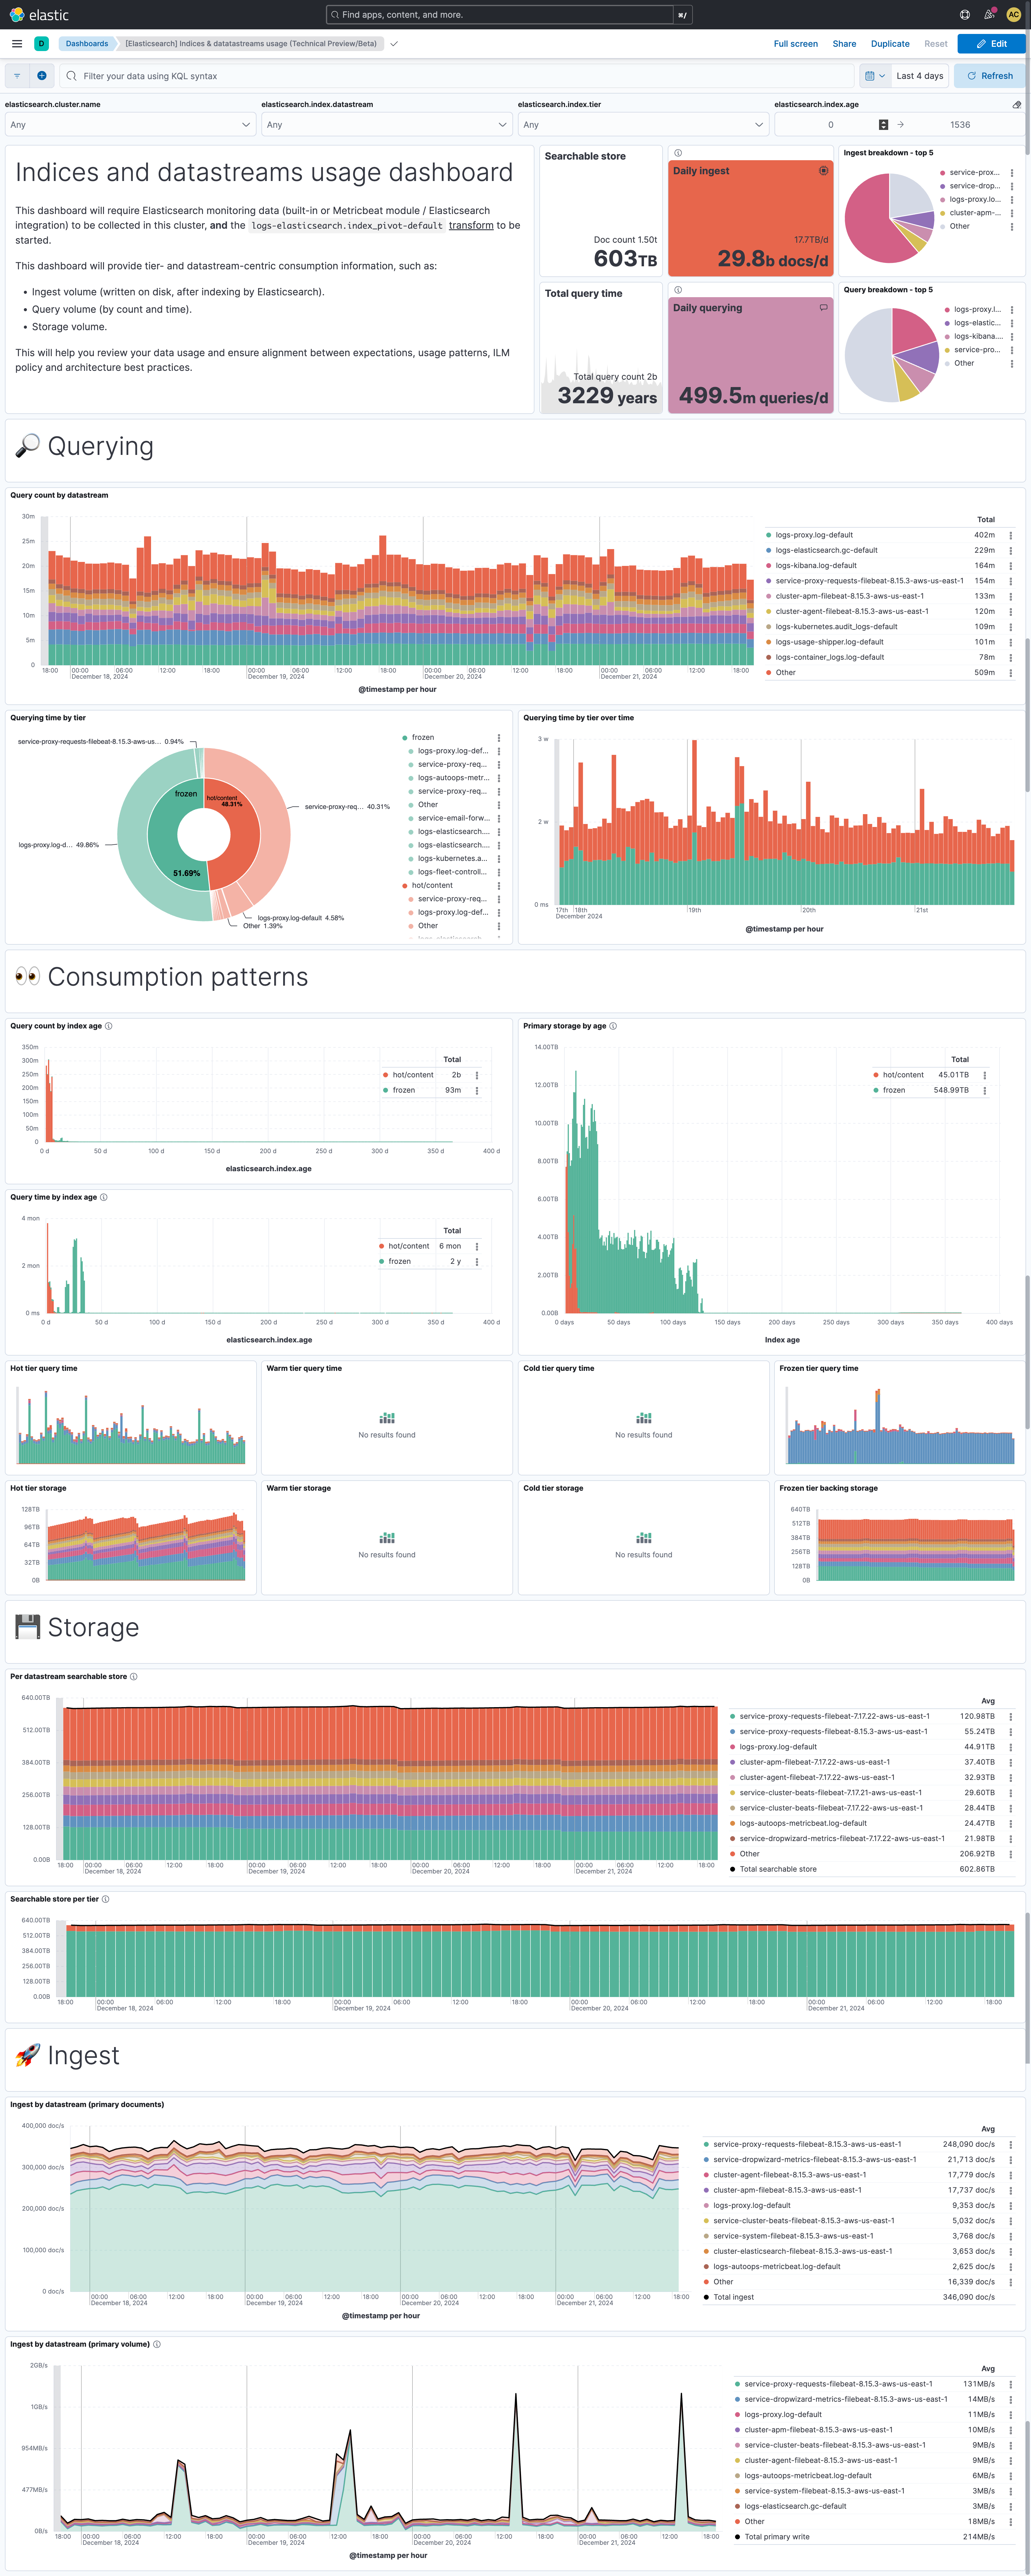
Apart from some high-level statistics, such as total query count, total query time and total addressable data, the dashboard surfaces usage information centered on two dimensions:
- The data tier.
- The data stream (see note below for details about how this is computed).
As data ages, it commonly reduces in relative importance and is commonly stored on less efficient and more cost-effective hardware. Usage count and query time should also proportionally diminish. Various visualizations in the dashboard allow you to verify this assumption on your data, and ensure your ILM policy (and therefore data tier transitions) are aligned with how the data is actually being used.
Other visualizations in the dashboard allow you to compare the relative footprint of each data stream, from a storage, querying and indexing perspective. This can help you identify anomalies, stemming from faulty configuration or poor user behavior.
Both approaches can be used in conjunction, allowing you to fine-tune ILM on a data stream basis (if required) to closely match usage patterns.
⚠️ Important notes:
- The transform job will process all compatible historical data that is still on the hot or warm tier, which has two implications: 1. if you have pre-8.17.1 data, this will not get picked up by the job and 2. it might take time for "live" data to be available, as the transform job works its way through all documents.
- The target index
monitoring-indicesis not controlled by ILM. In case you work on a setup with a high count of indices or with a high retention, you may need to tune the transform job, or activate ILM on the target index. Per our testing on a cluster with 5000 indices, we generated around 1GB of primary data for each week (your mileage may vary). - The transform reads the monitoring data from the backing indices of the
metrics-elasticsearch.stack_monitoring.indexdata stream, and not from the data stream itself. If your ILM policy downsamples that data, the downsampled indices are skipped, as the transform cannot aggregate downsampled data. The same applies to indices renamed by a shrink action or mounted as searchable snapshots. - The identification of the data stream is based on the following grok pattern:
^(?:partial-)?(?:restored-)?(?:shrink-.{4}-)?(?:\\.ds-)?(?<elasticsearch.index.datastream>[a-z_0-9\\-\\.]+?)(-(?:\\d{4}\\.\\d{2}(\\.\\d{2})?))?(?:-\\d+)?$. This should cover all "out of the box" names, but you can modify this to your liking in the{VERSION}-monitoring_indicesingest pipeline (though a copy is advised), if you are using non-standard names or would like to aggregate data differently.
This integration includes one or more Kibana dashboards that visualizes the data collected by the integration. The screenshots below illustrate how the ingested data is displayed.
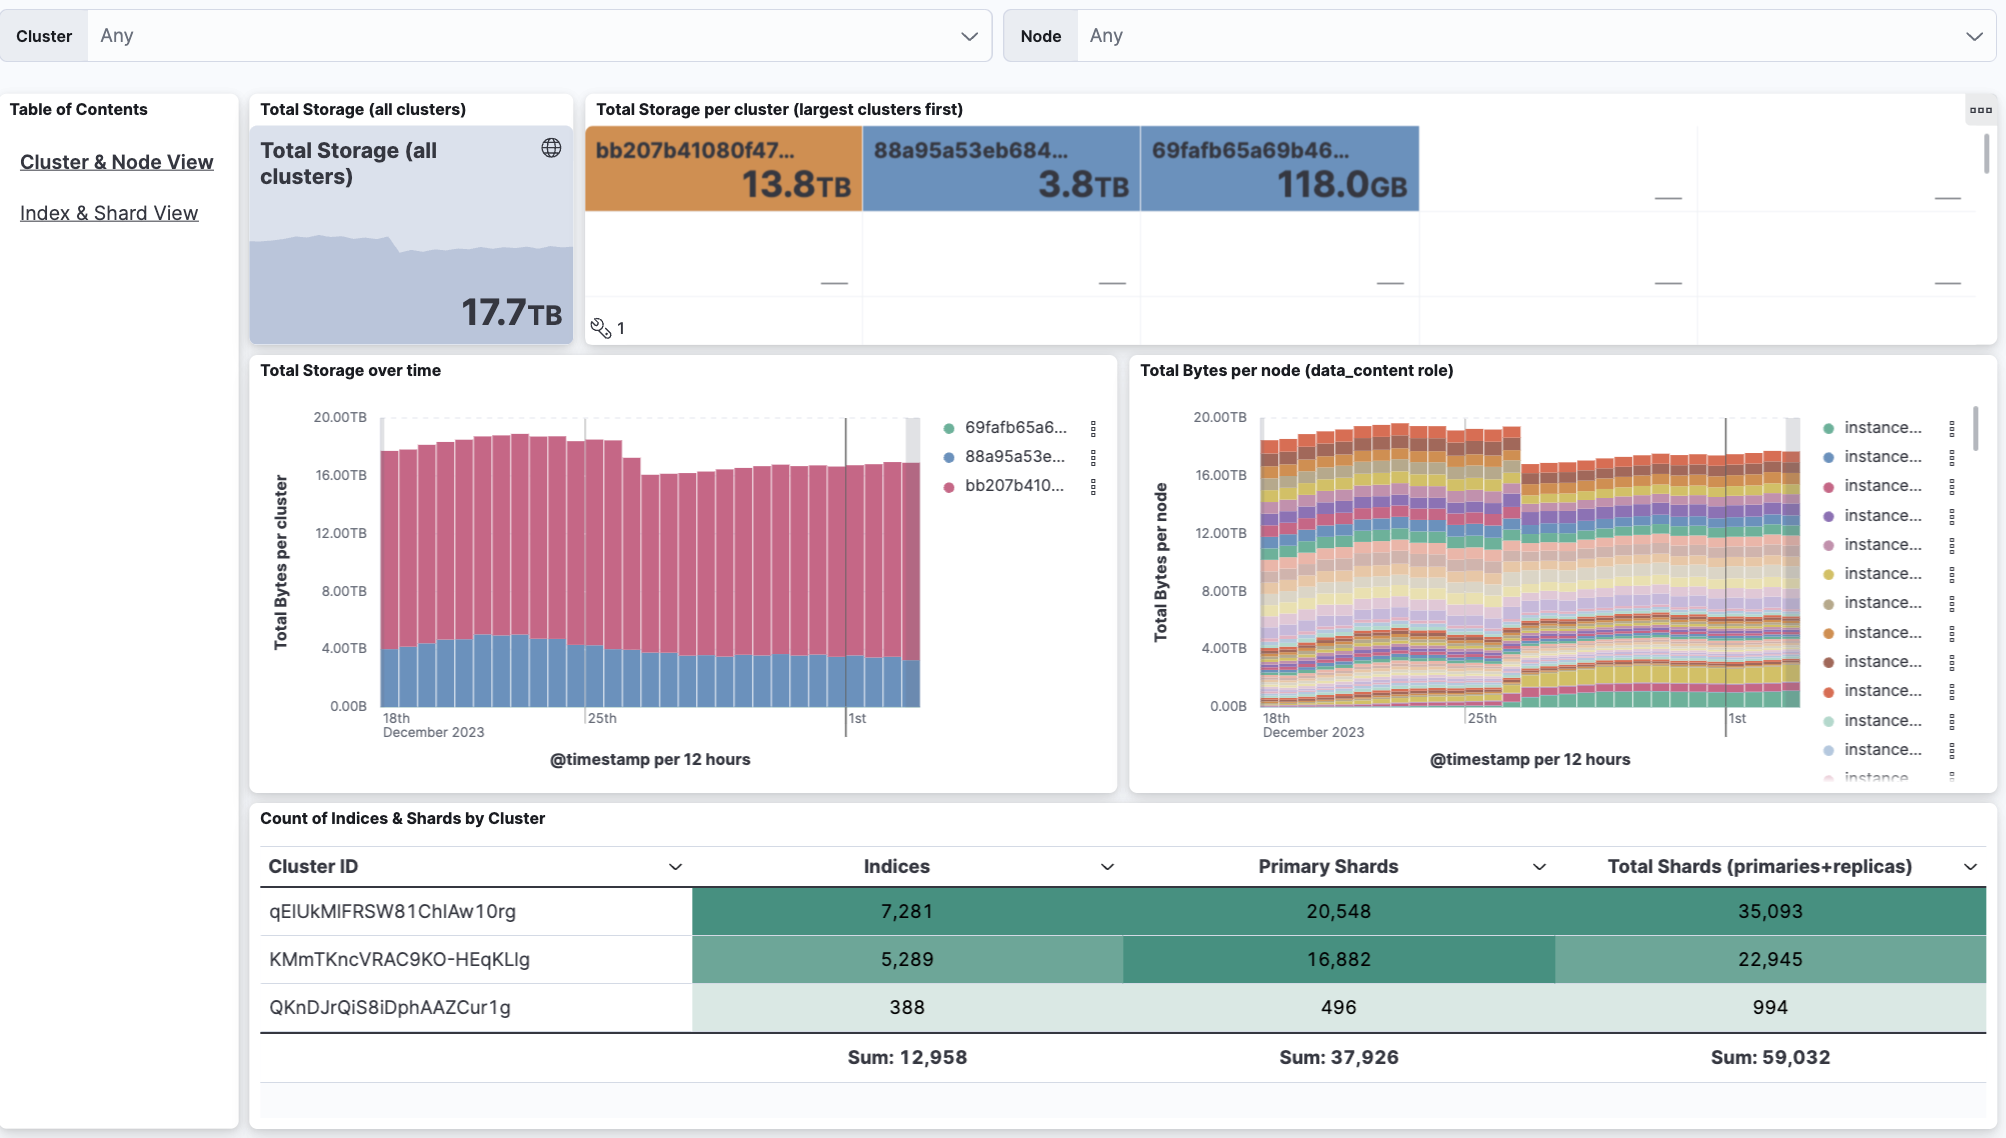
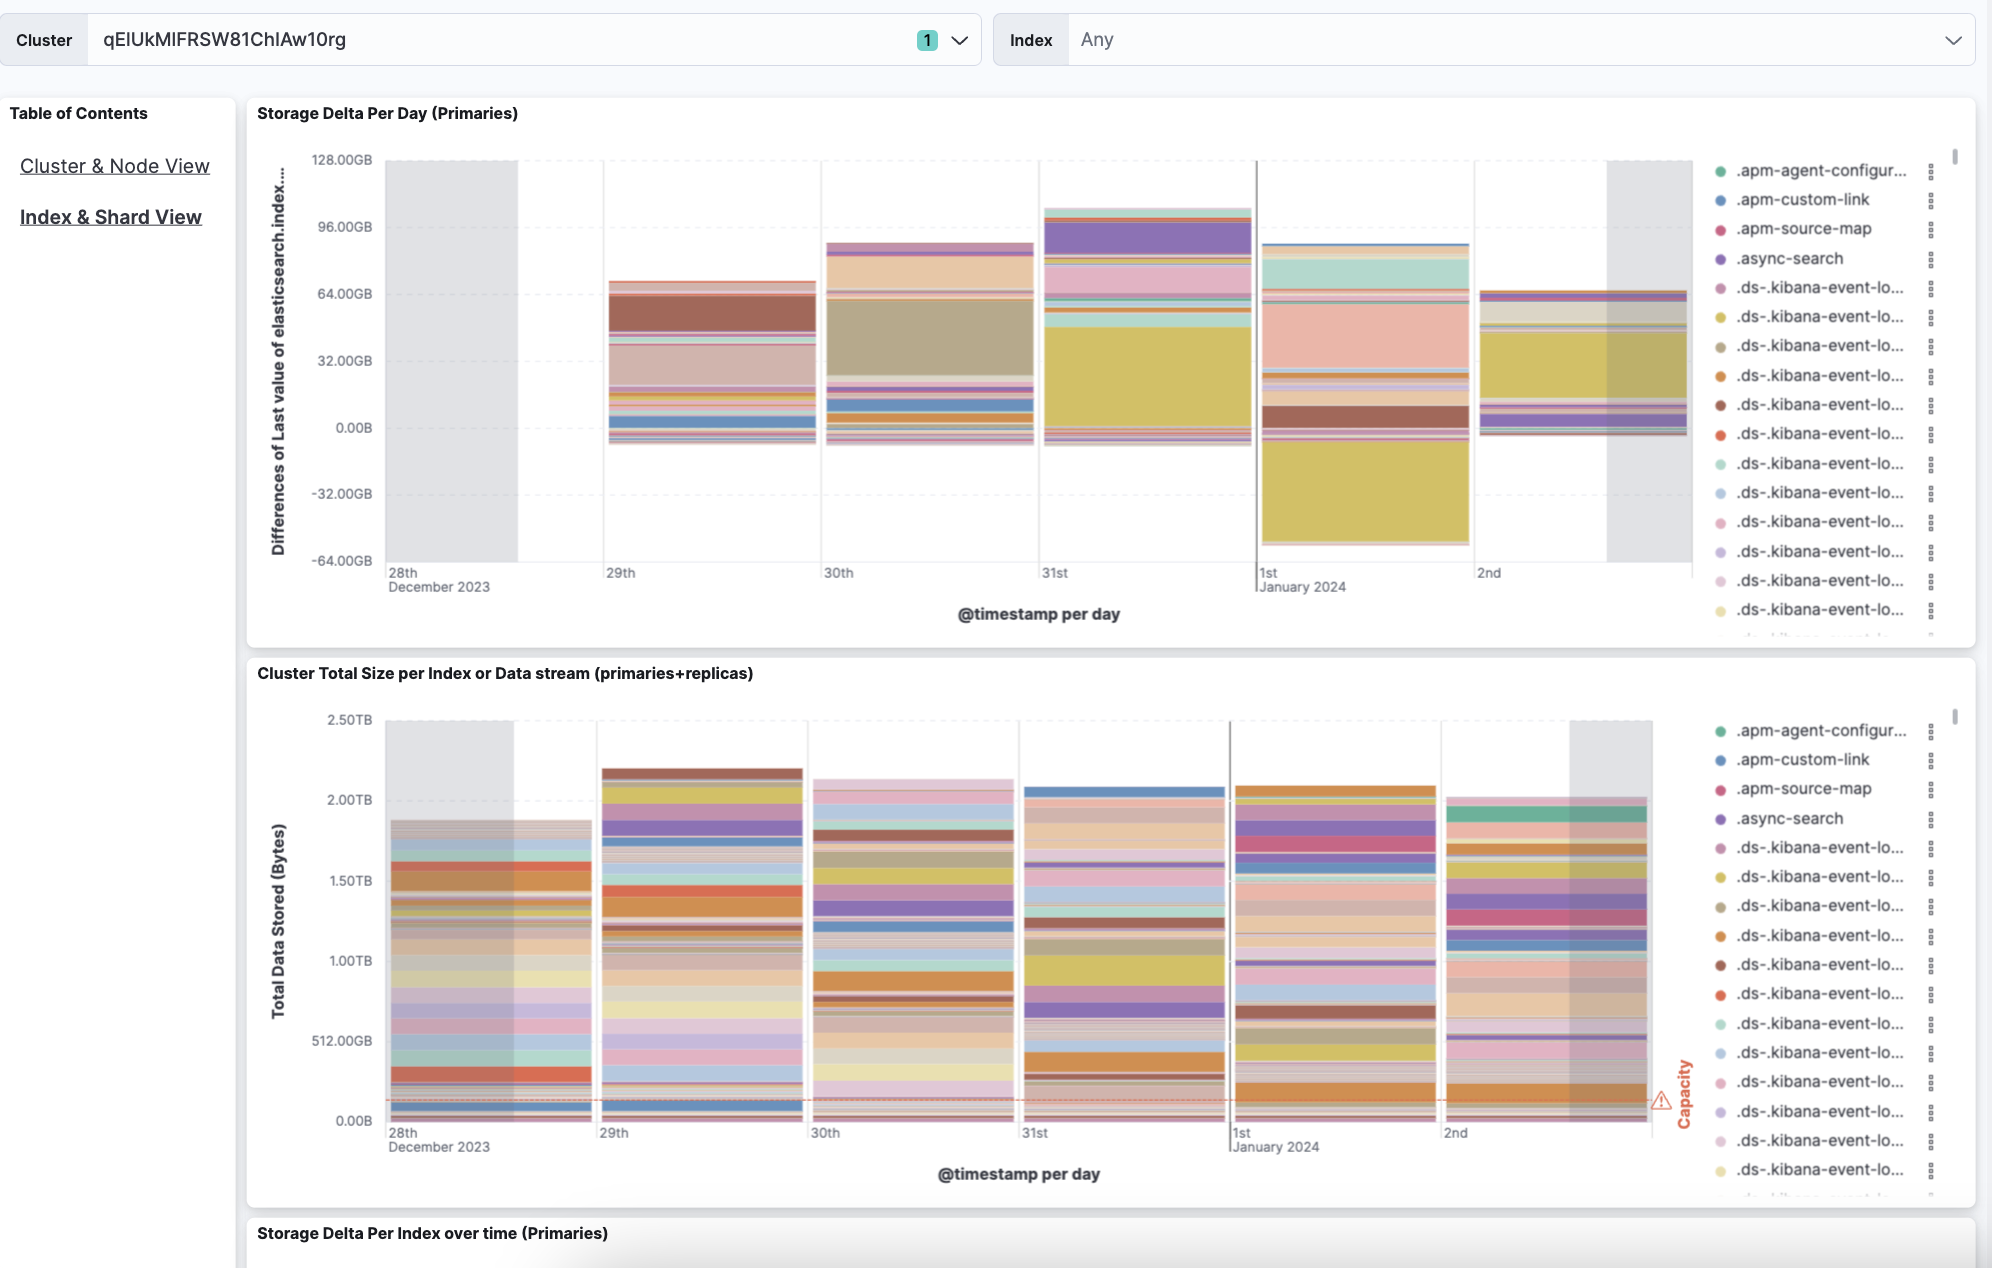
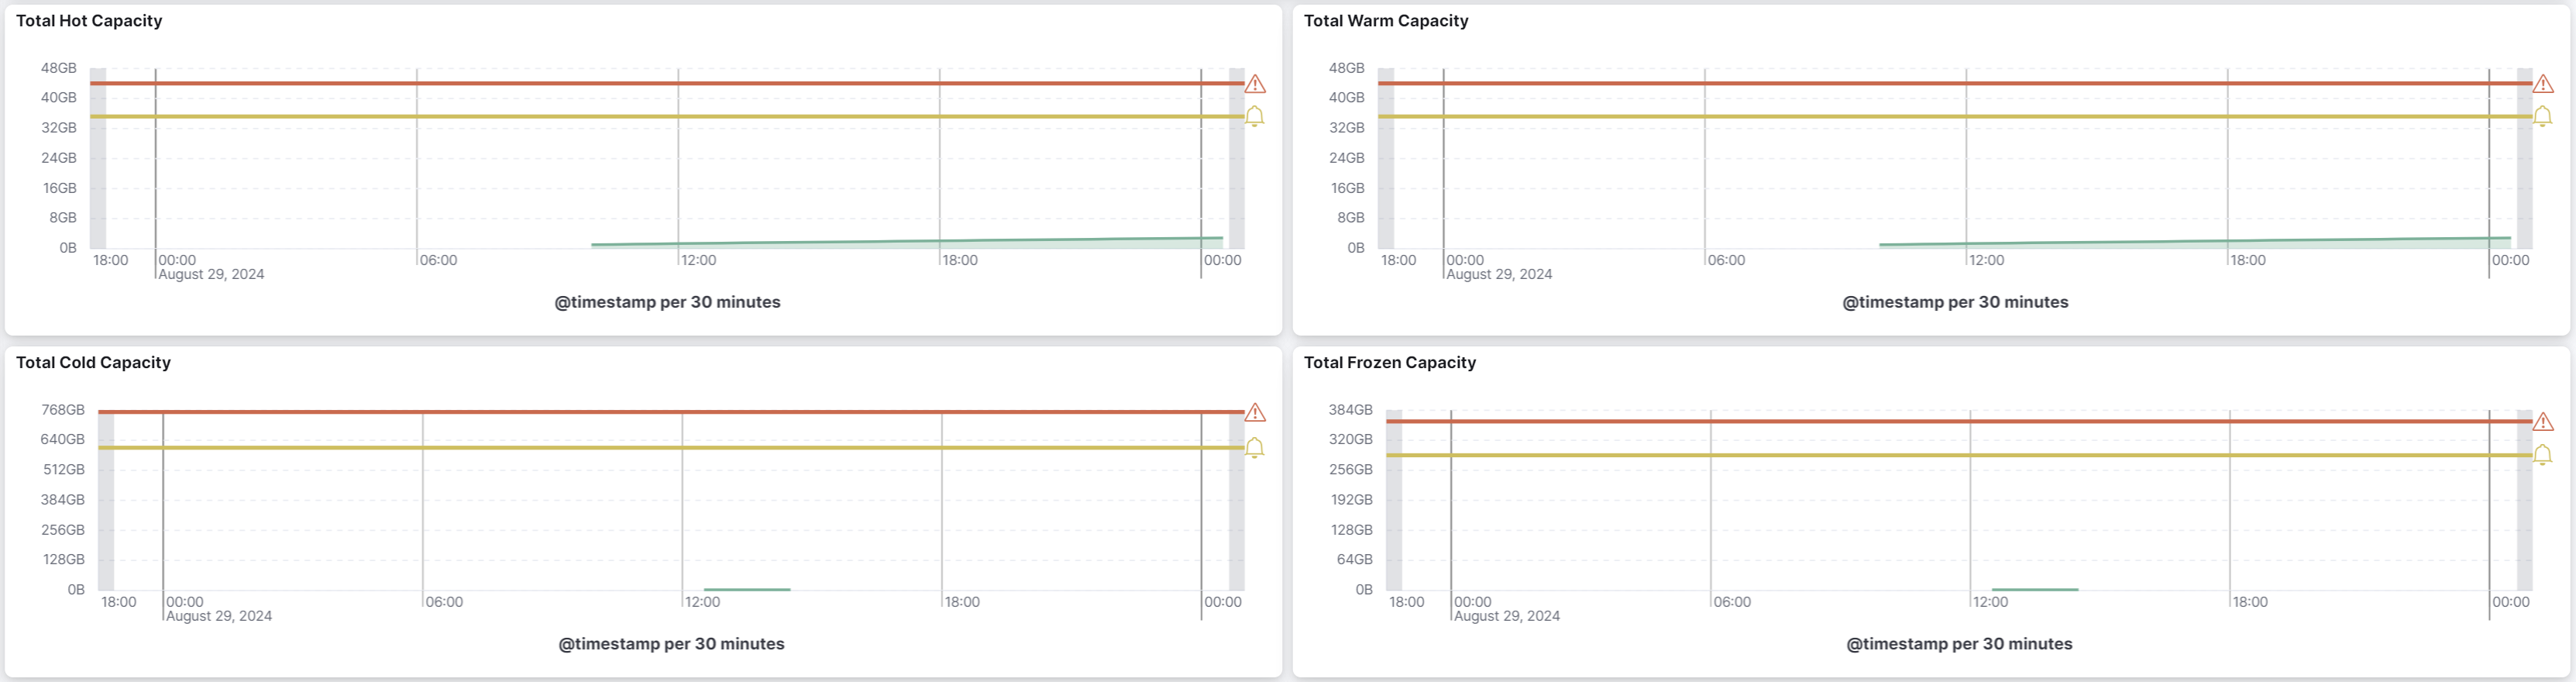
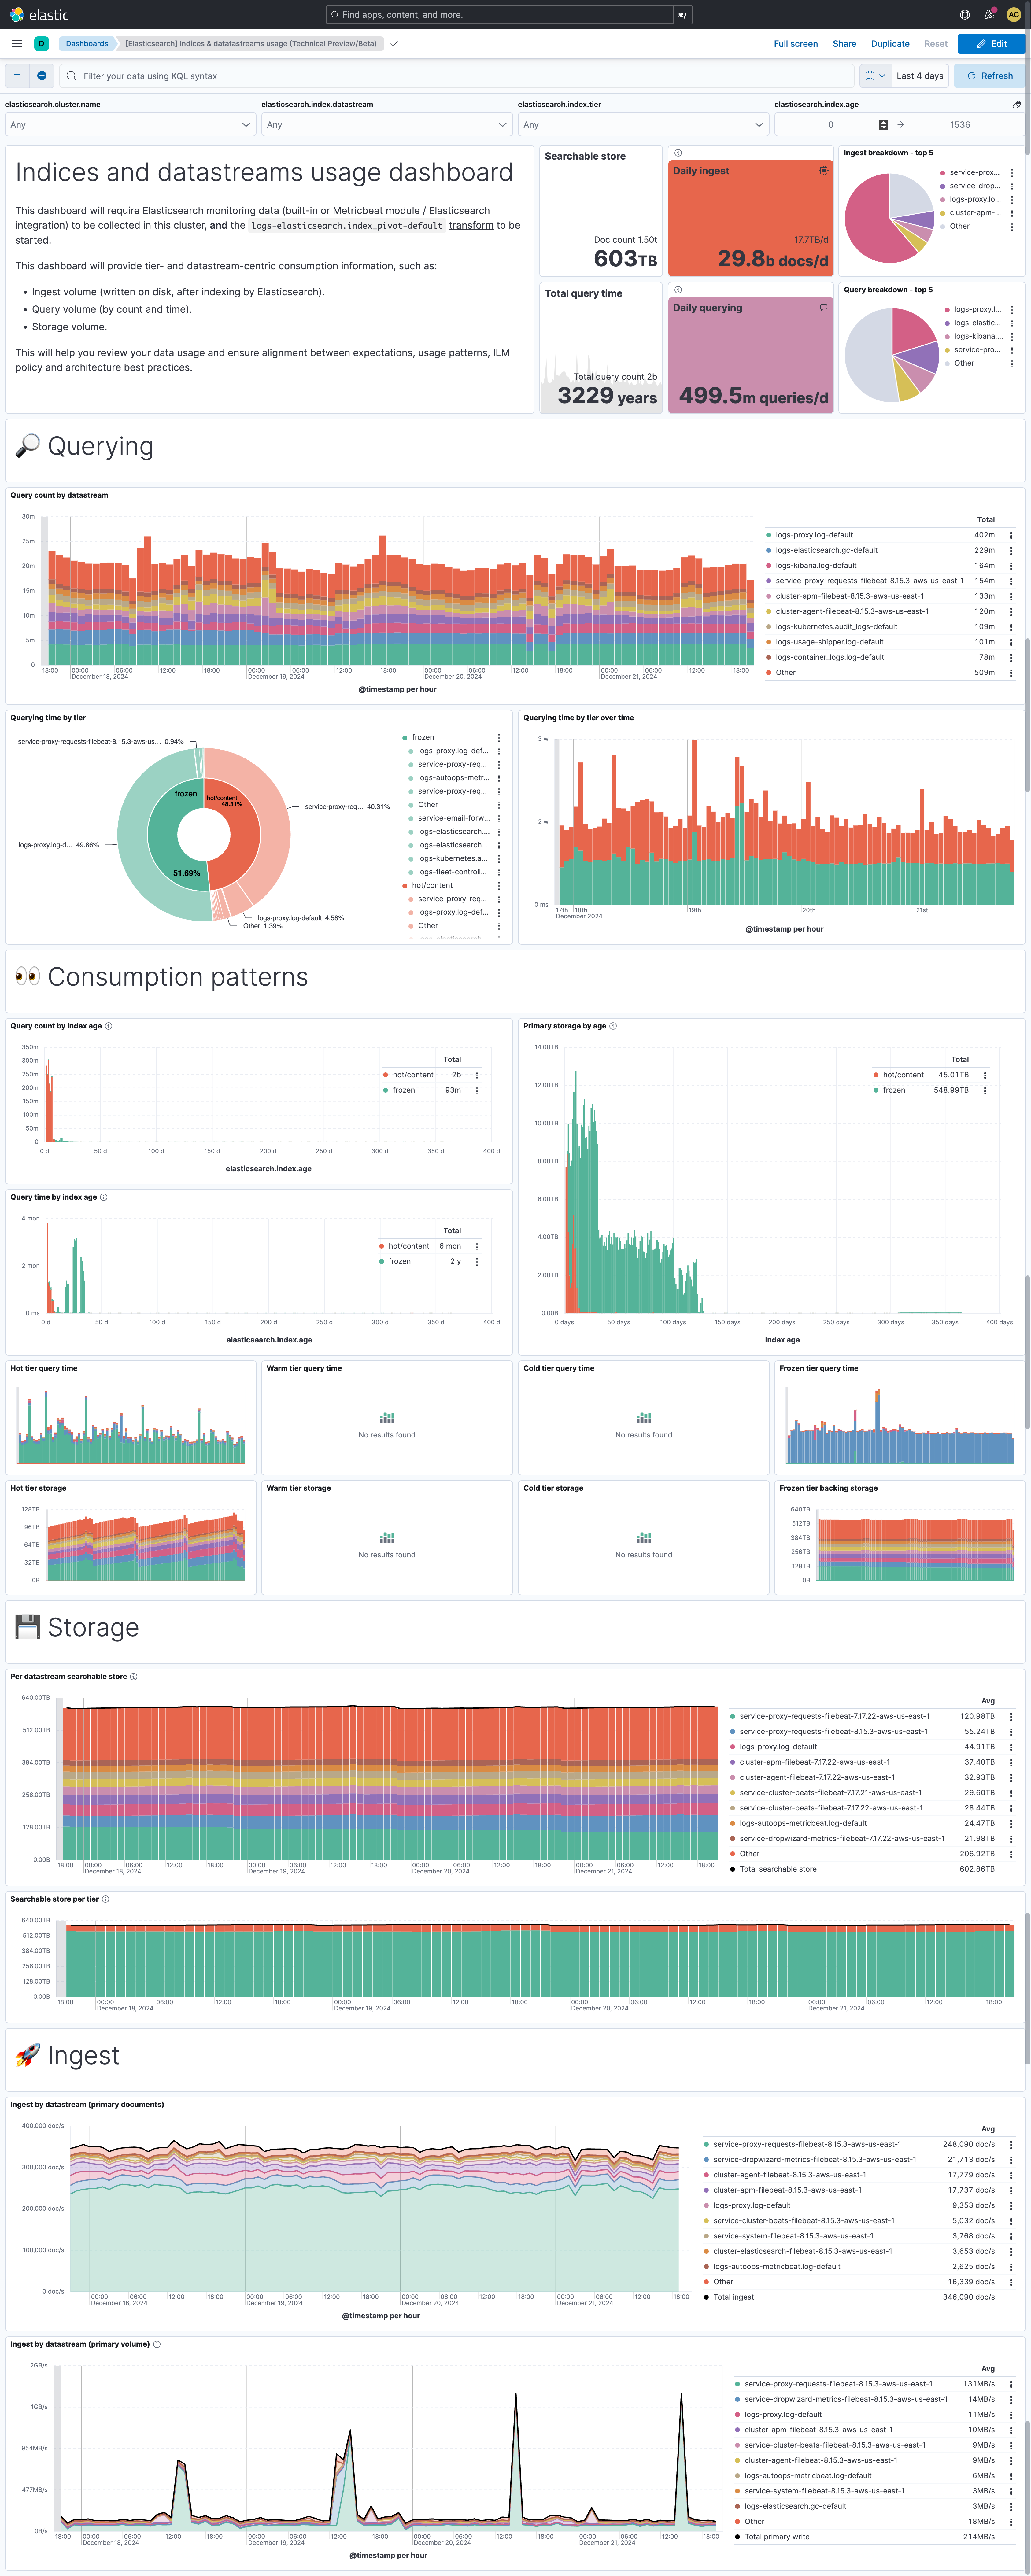
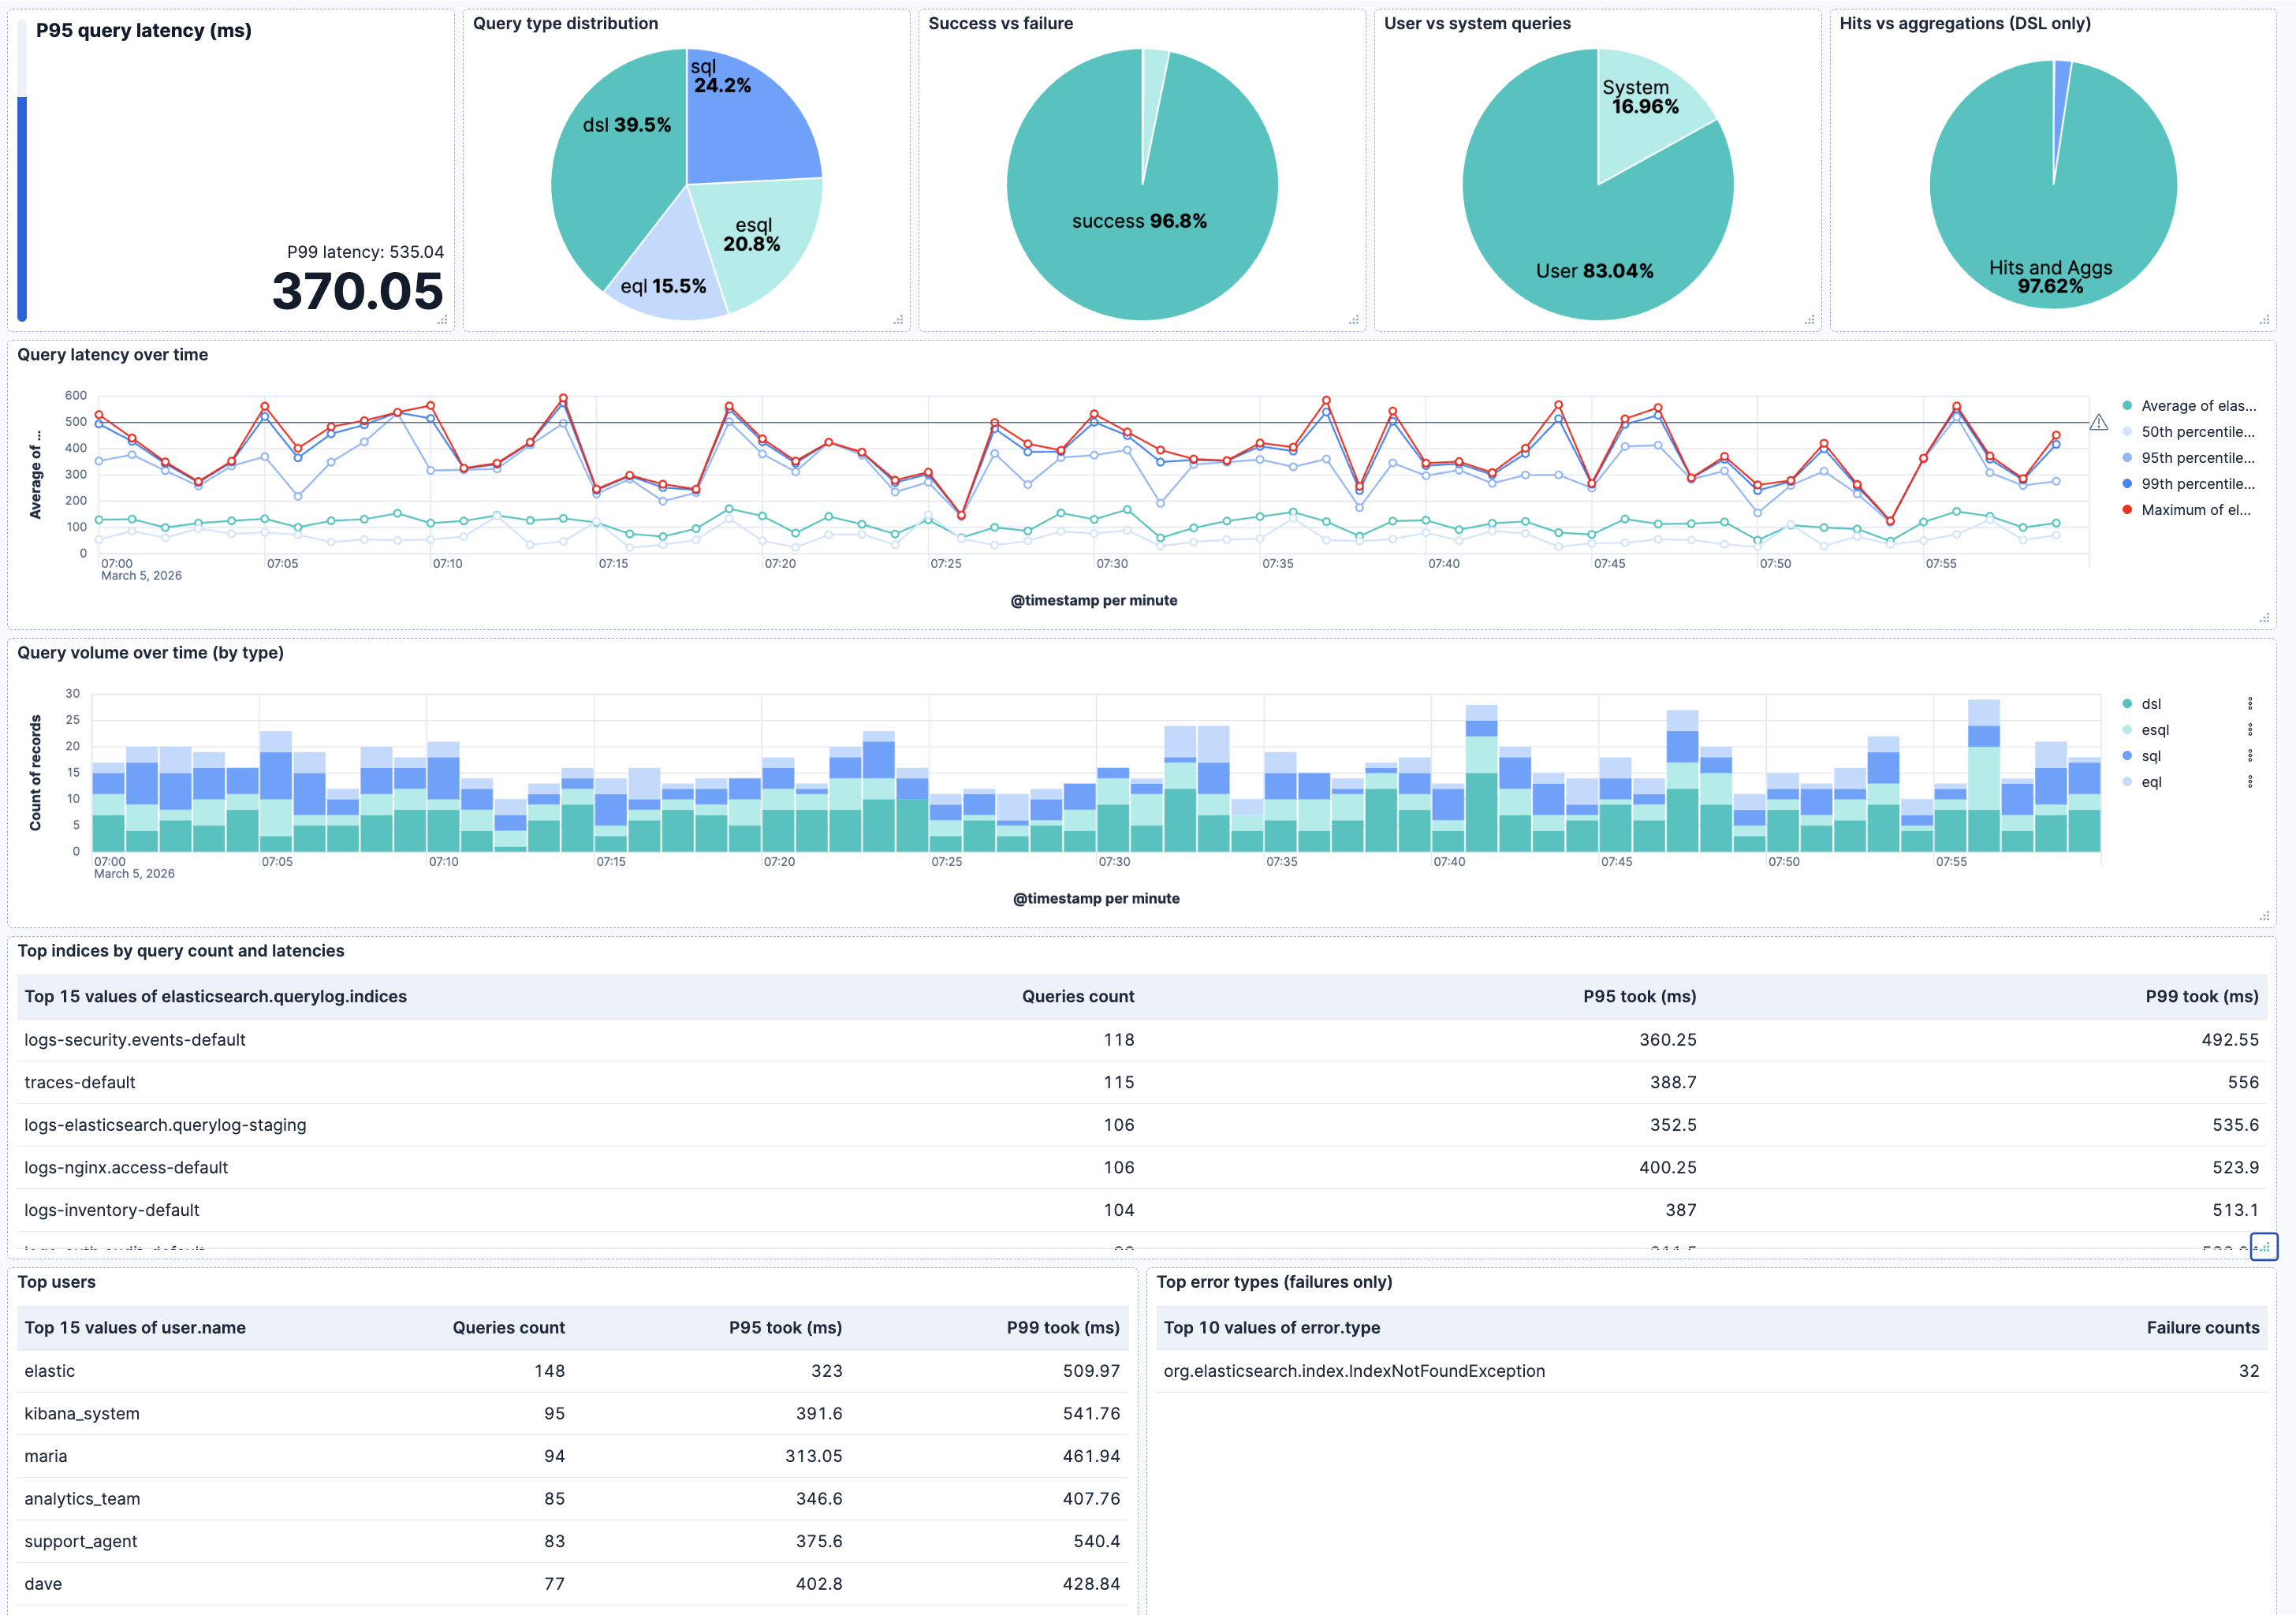
Changelog
| Version | Details | Minimum Kibana version |
|---|---|---|
| 1.23.3 | Bug fix (View pull request) Decode querylog NDJSON on the Agent so events parse when the x-pack destination template overrides the Fleet ingest pipeline. |
9.0.0 8.11.2 |
| 1.23.2 | Bug fix (View pull request) Exclude cold and frozen tier data from the index_pivot transform to prevent its checkpoint from stalling on deployments with long monitoring retention. |
9.0.0 8.11.2 |
| 1.23.1 | Bug fix (View pull request) Read the index_pivot transform source from the monitoring data stream backing indices, so downsampled indices are skipped instead of failing the transform. |
9.0.0 8.11.2 |
| 1.23.0 | Enhancement (View pull request) Mark password and api_key as secret so Fleet cannot reveal stored credentials. After upgrading, existing values cannot be read back and can only be overwritten. |
9.0.0 8.11.2 |
| 1.22.0 | Enhancement (View pull request) Add security_stats data stream to collect per-node Document Level Security (DLS) bitset cache metrics from the Security Stats API (requires Elasticsearch 9.2+). |
9.0.0 8.10.1 |
| 1.21.1 | Bug fix (View pull request) Bugfix for querylog new data stream (docs and dashboard) |
9.0.0 8.10.1 |
| 1.21.0 | Enhancement (View pull request) Add support for querylog data stream to collect Elasticsearch query logs |
9.0.0 8.10.1 |
| 1.20.2 | Bug fix (View pull request) Fix authentication failure when username or password contains YAML special characters (e.g. double quotes) by using the escape_string Handlebars helper. |
9.0.0 8.10.1 |
| 1.20.1 | Bug fix (View pull request) Make Elasticsearch server log pipeline tolerate missing elasticsearch fields |
9.0.0 8.10.1 |
| 1.20.0 | Enhancement (View pull request) Add index mode and codec to datastream fields (aligns with Metricbeat elasticsearch index metricset) |
9.0.0 8.10.1 |
| 1.19.1 | Enhancement (View pull request) Fix role filter in Cluster Node View Dashboards |
9.0.0 8.10.1 |
| 1.19.0 | Enhancement (View pull request) Removed deprecated _source.mode in transform index |
9.0.0 8.10.1 |
| 1.18.1 | Bug fix (View pull request) Fixed transform job definition that was inflating ingest volume |
9.0.0 8.10.1 |
| 1.18.0 | Enhancement (View pull request) Added 9.0.0 constraint |
9.0.0 8.10.1 |
| 1.17.4 | Bug fix (View pull request) Fix formulas for computing tier capacity |
8.10.1 |
| 1.17.3 | Bug fix (View pull request) Fix ingest pipeline reference in elasticsearch transform job |
8.10.1 |
| 1.17.2 | Bug fix (View pull request) Stop truncating the Elasticsearch server logs |
8.10.1 |
| 1.17.1 | Bug fix (View pull request) Updated SSL description to be uniform and to include links to documentation. |
8.10.1 |
| 1.17.0 | Enhancement (View pull request) Allow the usage of deprecated log input and support for stack 9.0 |
8.10.1 |
| 1.16.0 | Enhancement (View pull request) Add transform job & dashboard for datastream metrics |
8.10.1 |
| 1.15.3 | Bug fix (View pull request) Make elasticsearch.node.name a TSDS dimension to prevent document collisions. |
8.10.1 |
| 1.15.2 | Enhancement (View pull request) Add support for HTTP timeout in all elasticsearch metricsets |
8.10.1 |
| 1.15.1 | Enhancement (View pull request) Add visualizations for data tier capacity |
8.10.1 |
| 1.15.0 | Enhancement (View pull request) Add support shard_stats.total_count in node metricset |
8.10.1 |
| 1.14.0 | Enhancement (View pull request) Add support for tags |
8.10.1 |
| 1.13.1 | Bug fix (View pull request) Make "Total Storage over time" viz consistent with others by using same sourceField |
8.10.1 |
| 1.13.0 | Enhancement (View pull request) Add mapping for total_data_set_size |
8.10.1 |
| 1.12.1 | Bug fix (View pull request) Minor mapping fixes |
8.10.1 |
| 1.12.0 | Enhancement (View pull request) Add dashboards to monitor ingestion volume / storage (Technical Preview/Beta) |
8.10.1 |
| 1.11.2 | Bug fix (View pull request) Disable otherBucket in the panels of [Elasticsearch] Ingest Pipeline Details dashboard |
8.10.1 |
| 1.11.1 | Bug fix (View pull request) Audit Pipeline Ignore Missing elasticsearch.audit.user.run_as.name |
8.10.1 |
| 1.11.0 | Enhancement (View pull request) Make Stack Monitoring metrics GA |
8.10.1 |
| 1.10.0 | Enhancement (View pull request) Add support for api_key authentication |
8.10.0 |
| 1.9.0 | Enhancement (View pull request) Enable time series data streams for the metrics datasets Index, Index Summary, Index Recovery, ML Job, Ingest Pipeline, Node and Node Stats. This improves storage usage and query performance. For more details, see https://www.elastic.co/guide/en/elasticsearch/reference/current/tsds.html |
8.8.0 |
| 1.8.1 | Enhancement (View pull request) Add metric_type mapping for the fields of metrics datasets to support TSDB. |
8.8.0 |
| 1.8.0 | Enhancement (View pull request) Set fields as dimensions for TSDB migration. |
8.8.0 |
| 1.7.4 | Bug fix (View pull request) Fix elasticsearch.server.tags mapping |
8.8.0 |
| 1.7.3 | Bug fix (View pull request) Add missing index_recovery.active_only configuration |
8.8.0 |
| 1.7.2 | Bug fix (View pull request) Add missing event fields field mapping |
8.8.0 |
| 1.7.1 | Bug fix (View pull request) Add host.ip field mapping to Elasticsearch |
8.8.0 |
| 1.7.0 | Enhancement (View pull request) Add event.module field to Elasticsearch for Logs |
8.8.0 |
| 1.6.2 | Bug fix (View pull request) Add missing ssl, condition and leader_election support to elasticsearch ingest pipeline datastream |
8.8.0 |
| 1.6.1 | Bug fix (View pull request) Add explicit mapping for event timestamp fields |
8.8.0 |
| 1.6.0 | Enhancement (View pull request) Make scope variable a select Enhancement (View pull request) Add roles to node |
8.8.0 |
| 1.5.0 | Enhancement (View pull request) Add force_merge to thread_pool node stats |
8.7.0 |
| 1.4.3 | Bug fix (View pull request) Add mappings for ccr read_exceptions |
8.7.0 |
| 1.4.2 | Bug fix (View pull request) Clarify that the metrics collected power the Stack Monitoring application |
8.7.0 |
| 1.4.1 | Bug fix (View pull request) Fix collection of shard recovery total time |
8.7.0 |
| 1.4.0 | Enhancement (View pull request) Add ingest pipeline monitoring dataset and dashboard (experimental) |
8.7.0 |
| 1.3.0 | Enhancement (View pull request) Add conditional support to Elasticsearch log and metrics inputs Enhancement (View pull request) Add leader election support to Elasticsearch inputs metrics inputs |
8.5.0 |
| 1.2.0 | Enhancement (View pull request) Add period variable to define polling frequency |
8.5.0 |
| 1.2.0-preview2 | Enhancement (View pull request) Add GC log level |
— |
| 1.2.0-preview1 | Enhancement (View pull request) Add ssl configuration option for metricsets |
— |
| 1.1.0-preview1 | Enhancement (View pull request) Suffix stack_monitoring to the datasetsBug fix (View pull request) Align metrics mappings with metricbeat |
— |
| 0.3.0 | Enhancement (View pull request) Add scope configuration option for metricsets |
— |
| 0.2.2 | Enhancement (View pull request) Add documentation for multi-fields |
— |
| 0.2.1 | Bug fix (View pull request) Fix version mapping in the index_recovery data stream. |
— |
| 0.2.0 | Enhancement (View pull request) Update to ECS 1.12.0 |
— |
| 0.1.0 | Enhancement (View pull request) initial release |
— |