Varonis integration
Elastic Cloud Serverless projects are autoscaled environments, fully managed by Elastic and available on Elastic Cloud. Availability This functionality is generally available and ready for production usage. Elastic Cloud Serverless projects are autoscaled environments, fully managed by Elastic and available on Elastic Cloud. Availability This functionality is generally available and ready for production usage. The Elastic Stack includes Elastic's core products such as Elasticsearch, Kibana, Logstash, and Beats. Availability This functionality is generally available and ready for production usage. Unless stated otherwise on the page, this functionality is available when your Elastic Stack is deployed on Elastic Cloud Hosted, Elastic Cloud Enterprise, Elastic Cloud on Kubernetes, and self-managed environments. This documentation corresponds to the latest patch available for each minor version. If you're not using the latest patch, check the release notes for changes.
Serverless Observability
Generally available
Serverless Security
Generally available
Stack
9.0+
Generally available since 9.0
| Version | 1.1.0 (View all) |
| Subscription level What's this? |
Basic |
| Developed by What's this? |
Elastic |
| Ingestion method(s) | Network Protocol |
| Minimum Kibana version(s) | 9.0.0 8.15.3 |
Varonis is a data security platform that helps organizations protect their sensitive data from insider threats and cyberattacks. This integration collects and analyzes security alerts from Varonis, enabling real-time threat monitoring, compliance reporting, and incident response.
logs: Provides alert data from Varonis syslog. This data stream includes information about alerts generated by Varonis, such as the alert type, severity, file permission changes, and more.
Users can configure the syslog server address in DatAlert so that alerts can be sent to elasticsearch integration.
- Login to the Varonis UI using admin credentials.
- In Data Advantage, select
Tools > DatAlert > Select DatAlert. - From the left menu, select
Configuration. - In syslog message forwarding, do the following:
- Syslog server IP address: Enter the IP address of the machine where the Elasticsearch integration agent is running.
- Port: Enter the UDP port on which this integration will be configured (e.g., 9035).
- Click
Apply.
- In DatAlert, select
Alert Templates. - Click the Green Plus sign to add a new alert template.
- Template name: Select
External system default template (CEF). - Apply to alert methods: Select
Syslog message. - Click
OK.
This integration expects to use External system default template (CEF) for alert forwarding in Varonis DatAlert tool. In case any custom template is used, all the fields in External system default template (CEF) should also be present in custom template along with the other additional fields. Additional fields will be part of varonis.logs object and such fields will be indexed only if dynamic mapping is enabled in Elasticsearch.
There are cases where incoming CEF messages do not follow the CEF specification exactly, and this can cause errors with message decoding. To work around this, there is an option for pre-processors, which are run before the CEF message is decoded. These can be used modify the message to follow the CEF specification correctly, which will allow proper decoding.
The pre-processors will modify the message field before CEF decoding is done on the agent, but the original, non-preprocessed,
message will still be preserved in the event.original field when the agent sends the event.
Logs documents can be found by setting the following filter:
event.dataset : "varonis.logs"
Example
{
    "@timestamp": "2025-04-28T15:01:42.000Z",
    "agent": {
        "ephemeral_id": "505a3770-450a-4300-b325-f9e2c6caa79e",
        "id": "1fa84ff2-0b52-47f7-80a0-edbc73168926",
        "name": "elastic-agent-78603",
        "type": "filebeat",
        "version": "8.15.3"
    },
    "data_stream": {
        "dataset": "varonis.logs",
        "namespace": "57343",
        "type": "logs"
    },
    "destination": {
        "domain": "AD-contosofoo.com",
        "user": {
            "group": {
                "name": "contosofoo.com\\Group Admins-Region_200"
            },
            "name": "contosofoo.com\\Bourne Jr., Jason"
        }
    },
    "ecs": {
        "version": "8.17.0"
    },
    "elastic_agent": {
        "id": "1fa84ff2-0b52-47f7-80a0-edbc73168926",
        "snapshot": false,
        "version": "8.15.3"
    },
    "event": {
        "action": "DS object permission added",
        "agent_id_status": "verified",
        "category": [
            "configuration"
        ],
        "code": "5015",
        "dataset": "varonis.logs",
        "end": "2025-04-28T14:53:02.000Z",
        "ingested": "2025-09-11T06:42:47Z",
        "kind": "event",
        "module": "varonis",
        "original": "<14>Apr 28 15:59:01 VARONISSRVR1 CEF:0|Varonis Inc.|DatAdvantage|8.7.1|5015|DS object permission added|3|rt=Apr 28 2025 15:01:42 cat=Alert cs2=Permission changes on OU cs2Label=RuleName cn1=142 cn1Label=RuleID end=Apr 28 2025 14:53:02 duser=contosofoo.com\\Bourne Jr., Jason dhost=AD-contosofoo.com filePath=contosofoo.com\\Home Office Site\\Computers\\Containered fname=Containered act=DS object permission added dvchost=Compute outcome=Success msg=Permissions were added to \"Containered\" for group \"contosofoo.com\\Group Admins-Region_200\" cs3= cs3Label=AttachmentName cs4= cs4Label=ClientAccessType deviceCustomDate1= fileType= cs1= cs1Label=MailRecipient suser= cs5= cs5Label=MailboxAccessType cnt= cs6= cs6Label=ChangedPermissions oldFilePermission= filePermission=Write dpriv=contosofoo.com\\Group Admins-Region_200 start=Apr 28 2025 14:53:02",
        "outcome": "success",
        "severity": 3,
        "severity_label": "error",
        "start": "2025-04-28T14:53:02.000Z",
        "type": [
            "info"
        ]
    },
    "file": {
        "group": "Write",
        "name": "Containered",
        "path": "contosofoo.com\\Home Office Site\\Computers\\Containered"
    },
    "input": {
        "type": "udp"
    },
    "message": "Permissions were added to \"Containered\" for group \"contosofoo.com\\Group Admins-Region_200\"",
    "observer": {
        "hostname": "Compute",
        "product": "DatAdvantage",
        "vendor": "Varonis Inc.",
        "version": "8.7.1"
    },
    "tags": [
        "preserve_original_event",
        "forwarded"
    ],
    "varonis": {
        "logs": {
            "device_event_category": "Alert",
            "device_host_name": "Compute",
            "rule_id": 142,
            "rule_name": "Permission changes on OU"
        }
    }
}
ECS Field Reference
Please refer to the following document for detailed information on ECS fields.
The following non-ECS fields are used in events documents:
Exported fields
| Field | Description | Type |
|---|---|---|
| @timestamp | Date/time when the event originated. This is the date/time extracted from the event, typically representing when the event was generated by the source. If the event source has no original timestamp, this value is typically populated by the first time the event was received by the pipeline. Required field for all events. | date |
| data_stream.dataset | The field can contain anything that makes sense to signify the source of the data. Examples include nginx.access, prometheus, endpoint etc. For data streams that otherwise fit, but that do not have dataset set we use the value "generic" for the dataset value. event.dataset should have the same value as data_stream.dataset. Beyond the Elasticsearch data stream naming criteria noted above, the dataset value has additional restrictions: * Must not contain - * No longer than 100 characters |
constant_keyword |
| data_stream.namespace | A user defined namespace. Namespaces are useful to allow grouping of data. Many users already organize their indices this way, and the data stream naming scheme now provides this best practice as a default. Many users will populate this field with default. If no value is used, it falls back to default. Beyond the Elasticsearch index naming criteria noted above, namespace value has the additional restrictions: * Must not contain - * No longer than 100 characters |
constant_keyword |
| data_stream.type | An overarching type for the data stream. Currently allowed values are "logs" and "metrics". We expect to also add "traces" and "synthetics" in the near future. | constant_keyword |
| event.dataset | Name of the dataset. If an event source publishes more than one type of log or events (e.g. access log, error log), the dataset is used to specify which one the event comes from. It's recommended but not required to start the dataset name with the module name, followed by a dot, then the dataset name. | constant_keyword |
| event.module | Name of the module this data is coming from. If your monitoring agent supports the concept of modules or plugins to process events of a given source (e.g. Apache logs), event.module should contain the name of this module. |
constant_keyword |
| event.severity_label | keyword | |
| input.type | Input type | keyword |
| varonis.logs.attachment_name | The name of the attachment involved in the event. | keyword |
| varonis.logs.base_event_count | The threshold value for number of events. | |
| varonis.logs.changed_permissions | The permissions that were changed. | keyword |
| varonis.logs.client_access_type | The type of client access involved in the event. | keyword |
| varonis.logs.device_custom_date1 | A custom date field from varonis syslog. | |
| varonis.logs.device_event_category | The category of the device event. | keyword |
| varonis.logs.device_host_name | The host name of the device. | keyword |
| varonis.logs.device_receipt_time | The time the device received the event. | |
| varonis.logs.event_category | The category of the event. | keyword |
| varonis.logs.mail_recipient | The mail recipient involved in the event. | keyword |
| varonis.logs.mailbox_access_type | The type of mailbox access involved in the event. | keyword |
| varonis.logs.old_file_permission | The file permissions before the change. | keyword |
| varonis.logs.rule_id | The ID of the rule that triggered the event. | integer |
| varonis.logs.rule_name | The name of the rule that triggered the event. | keyword |
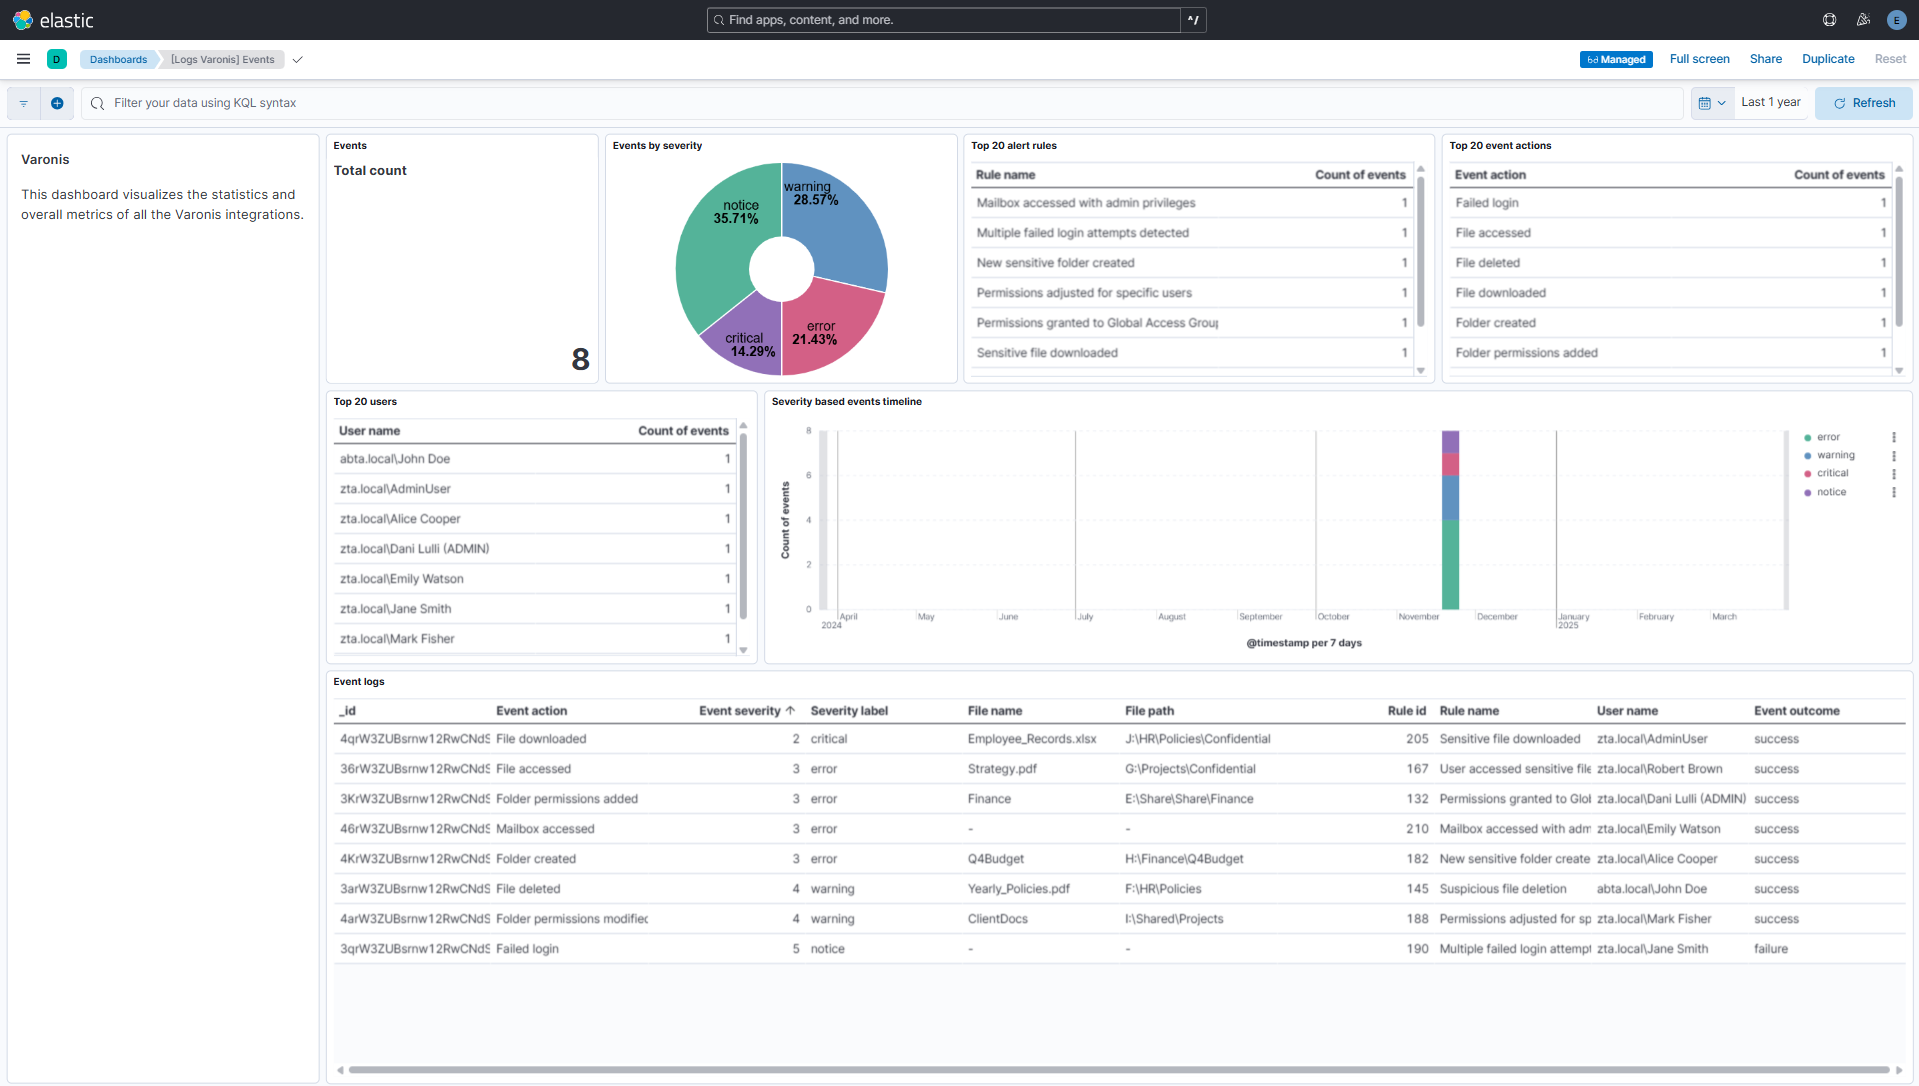
This integration includes one or more Kibana dashboards that visualizes the data collected by the integration. The screenshots below illustrate how the ingested data is displayed.
Changelog
| Version | Details | Minimum Kibana version |
|---|---|---|
| 1.1.0 | Enhancement (View pull request) Add tags to ingest pipeline processors and add preserve_original_event to pipeline-level on_failure handlers. |
9.0.0 8.15.3 |
| 1.0.0 | Enhancement (View pull request) Release package as GA. Enhancement (View pull request) ECS version updated to 8.17.0. |
9.0.0 8.15.3 |
| 0.2.0 | Enhancement (View pull request) Add preprocessors config option, to allow running processors before CEF messages are decoded. |
9.0.0 8.15.3 |
| 0.1.0 | Enhancement (View pull request) Initial release. |
9.0.0 8.15.3 |