Hashicorp Vault Integration for Elastic
Elastic Cloud Serverless projects are autoscaled environments, fully managed by Elastic and available on Elastic Cloud. Availability This functionality is generally available and ready for production usage. Elastic Cloud Serverless projects are autoscaled environments, fully managed by Elastic and available on Elastic Cloud. Availability This functionality is generally available and ready for production usage. The Elastic Stack includes Elastic's core products such as Elasticsearch, Kibana, Logstash, and Beats. Availability This functionality is generally available and ready for production usage. Unless stated otherwise on the page, this functionality is available when your Elastic Stack is deployed on Elastic Cloud Hosted, Elastic Cloud Enterprise, Elastic Cloud on Kubernetes, and self-managed environments. This documentation corresponds to the latest patch available for each minor version. If you're not using the latest patch, check the release notes for changes.
Serverless Observability
Generally available
Serverless Security
Generally available
Stack
9.0+
Generally available since 9.0
| Version | 1.31.0 (View all) |
| Subscription level What's this? |
Basic |
| Developed by What's this? |
Elastic |
| Ingestion method(s) | File, Network Protocol, Prometheus |
| Minimum Kibana version(s) | 9.0.0 8.12.0 |
The Hashicorp Vault integration allows you to collect audit logs, operational logs, and performance metrics from your Vault environment into the Elastic Stack. This gives you comprehensive visibility into the security posture and operational health of your secrets management infrastructure.
This integration has been tested with Hashicorp Vault version 1.11.
This integration is compatible with Elastic Stack version 8.12.0 or later.
This integration collects logs and metrics from your Hashicorp Vault deployment. You install an Elastic Agent on a host that can access your Vault service's logs, metrics endpoint, or audit device socket. The agent forwards this data to your Elastic deployment for monitoring and analysis.
The Elastic Agent collects data in the following ways:
- Vault metrics: It collects Prometheus metrics from the
/sys/metricsAPI endpoint, which includes performance telemetry like request counts, seal status, and memory usage. - Audit logs (file): It ingests audit logs directly from a local JSON file generated by Vault's file audit device.
- Audit logs (socket): It streams audit logs from Vault's socket audit device over a TCP connection to a listening Elastic Agent.
- Operational logs: It collects the standard operational logs (stdout) of the Vault service from a log file.
The Hashicorp Vault integration collects several types of data to provide comprehensive visibility into your Vault environment's security, performance, and operational health.
This integration collects the following data types:
- Audit logs: Detailed JSON records of every authenticated request and response. These logs are crucial for security monitoring and can be collected from a local file (
file audit device) or a TCP socket stream (socket audit device). - Operational logs: Standard output logs from the Vault service. These logs contain internal system events and error messages, which are essential for troubleshooting the Vault service itself.
- Metrics: Performance telemetry from Vault's
/sys/metricsAPI endpoint. This includes metrics on request counts, seal status, memory usage, and other key performance indicators.
Integrating Hashicorp Vault data with Elastic enables several key use cases for security and operations teams:
- Security monitoring and threat detection: Ingest audit logs into Elastic SIEM to detect suspicious activity, such as unauthorized access attempts, privilege escalations, or unusual secret access patterns.
- Performance and health monitoring: Use Kibana dashboards to visualize metrics, monitor the health of your Vault cluster, track performance telemetry, and receive alerts on critical issues like a sealed vault or high memory usage.
- Compliance and auditing: Maintain a detailed, searchable audit trail of all interactions with Vault to meet regulatory compliance requirements and simplify security audits.
- Operational troubleshooting: Correlate operational logs with metrics and audit events to quickly diagnose and resolve issues within the Vault service, reducing downtime and improving reliability.
Before you begin, ensure you have the following prerequisites:
- An Elastic Agent installed and enrolled in a policy.
- Administrative access to your Hashicorp Vault server. You'll need a Vault token with
rootprivileges or sufficient permissions to enable audit devices and read metrics from the/sys/metricsendpoint. - The
vaultCLI installed and authenticated on a machine where you can run configuration commands. - Network connectivity between the Vault server and the Elastic Agent host. Firewalls must be configured to allow traffic on the required ports:
- For metrics collection, the Elastic Agent must be able to connect to the Vault API port (default
8200). - For audit log collection using the TCP socket device, the Vault server must be able to connect to the listening port on the Elastic Agent host.
- For metrics collection, the Elastic Agent must be able to connect to the Vault API port (default
You must install an Elastic Agent on a host that can receive log data or has access to the log files from Hashicorp Vault. For more details, refer to the Elastic Agent installation instructions. You only need to install one Elastic Agent per host.
The Elastic Agent streams data from the log file or TCP socket and sends it to your Elastic deployment. Once there, the events are processed by the integration's ingest pipelines.
Follow the steps below to configure Hashicorp Vault to send data to the Elastic Agent. This integration supports audit logs, operational logs, and metrics.
To collect audit logs from a file, you'll need to enable the file audit device in Vault.
- SSH into your Vault server and create a dedicated directory for logs:
Shell sudo mkdir -p /var/log/vault - Ensure the
vaultuser has ownership of the directory:Shell sudo chown vault:vault /var/log/vault - Enable the audit device using the Vault CLI, specifying the JSON file path:
Shell vault audit enable file file_path=/var/log/vault/audit.json - It's recommended to configure
logrotateor similar utility to manage file growth.
You can also configure Vault to send audit logs to the Elastic Agent over a TCP socket.
Risk of Unresponsive Vault with TCP socket audit devices
- Ensure the Elastic Agent is installed and configured to listen on the target TCP port (e.g.,
9007). - Enable the socket device via the Vault CLI, providing the Elastic Agent's IP address and port:
Shell # Replace <elastic_agent_ip> with the actual IP address vault audit enable socket address="<elastic_agent_ip>:9007" socket_type=tcp - Verify connectivity. If the Agent is not reachable, Vault might block API requests.
To collect operational logs, you need to set the log format to json in your Vault configuration.
- Open your Vault configuration file (commonly
/etc/vault.d/vault.hcl). - Set the
log_formattojsonwithin the main configuration body:Text log_format = "json" - Reload the daemon and restart Vault for the changes to take effect:
Shell sudo systemctl daemon-reload && sudo systemctl restart vault
This integration collects metrics in Prometheus format from Vault's /v1/sys/metrics endpoint. To enable it, you'll need to configure the telemetry stanza in Vault.
- Open the Vault configuration file and add or update the
telemetrystanza. Theprometheus_retention_timeparameter must be set to a non-zero value to enable the Prometheus metrics endpoint:Text telemetry { prometheus_retention_time = "30s" disable_hostname = true enable_hostname_label = true } - Restart the Vault service to enable the
/v1/sys/metricsendpoint. - Generate a token with a policy that allows
readpermissions for thesys/metricspath.
- In Kibana, navigate to Management > Integrations.
- Search for "Hashicorp Vault" and select the integration.
- Click Add Hashicorp Vault.
- Configure the integration by selecting an input type and providing the necessary settings.
This input collects audit logs written to a file by Vault's file audit device.
| Setting | Description |
|---|---|
| Paths | The file paths to the audit logs. The default is ['/var/log/vault/audit*.json*']. |
| Preserve original event | If enabled, a raw copy of the original log is stored in the event.original field. The default is false. |
This input collects operational logs from a file.
| Setting | Description |
|---|---|
| Paths | The file paths to the operational logs. The default is ['/var/log/vault/log*.json*']. |
| Preserve original event | If enabled, a raw copy of the original log is stored in the event.original field. The default is false. |
This input collects audit logs sent from Vault's socket audit device over a TCP connection.
| Setting | Description |
|---|---|
| Listen Address | The bind address for the TCP listener. Use 0.0.0.0 to listen on all available interfaces. The default is localhost. |
| Listen Port | The TCP port number to listen on. The default is 9007. |
| Preserve original event | If enabled, a raw copy of the original log is stored in the event.original field. The default is false. |
This input collects metrics from Vault's Prometheus endpoint.
| Setting | Description |
|---|---|
| Hosts | The Vault addresses to monitor. The integration automatically appends /v1/sys/metrics?format=prometheus. The default is ['http://localhost:8200']. |
| Vault Token | A Vault token with read access to the /sys/metrics API endpoint. |
| Period | Optional. How often the Agent should poll the metrics API. The default is 30s. |
After configuring the input, assign the integration to an agent policy and click Save and continue.
After you've configured the integration, you can validate that data is flowing into your Elastic deployment.
To test the integration, generate some activity in Vault:
- Audit events: Log in to the Vault UI or CLI and perform an action, such as reading a secret:
vault kv get secret/test. - Configuration events: Enable a secrets engine to trigger administrative audit logs:
vault secrets enable cubbyhole. - Operational logs: Restart the Vault service to generate initialization logs:
sudo systemctl restart vault. - Metrics: Perform several CLI requests to increment request counters and latency metrics.
- In Kibana, navigate to Discover.
- In the search bar, filter for your Vault data using a KQL query. For example, to see audit logs, use
data_stream.dataset: "hashicorp_vault.audit". For operational logs, usedata_stream.dataset: "hashicorp_vault.log". - Verify that events are appearing with recent timestamps.
- Expand a document to confirm that fields like
event.dataset,event.action, andmessageare populated correctly. - Navigate to Analytics > Dashboards and search for "Hashicorp Vault" to see if the visualizations are populated with data.
For help with common issues, refer to the following sections.
- File permission denied: If the Elastic Agent cannot read the logs, ensure the Agent user (usually
rootorelastic-agent) has read permissions for/var/log/vaultand the JSON files within it. - Socket connection refused: Vault will fail to start the audit device if the Elastic Agent TCP listener is not already active. Ensure the Agent is successfully deployed with the listening port open before you run the
vault audit enablecommand. - Operational logs not in JSON format: If operational logs are not being parsed correctly, verify that
log_format = "json"is present in yourvault.hclfile and that you've restarted the service. - Telemetry prefixing: If metrics look unusual, ensure
disable_hostname = trueis set in the telemetry configuration. Otherwise, metric names will be prefixed with the hostname, which can break the integration's standard mappings. - JSON parsing failures: If the
error.messagefield in Kibana indicates parsing issues, verify thatlog_format = "json"is correctly set in the Vault configuration for operational logs. - Hashed secrets in logs: By default, Vault hashes secret values in audit logs using HMAC-SHA256. If you cannot see raw secrets, this is expected behavior.
- 403 Forbidden on metrics endpoint: Ensure the token provided in the integration configuration has a policy that allows
readaccess to thesys/metricspath. - Expired token: Vault tokens used for metrics collection should be "periodic" or have a long time-to-live (TTL) to prevent the integration from failing when the token expires.
To ensure optimal performance and scalability in high-volume environments, consider the following recommendations:
- Choose the right collection method for audit logs: The
logfileinput is the recommended collection method for production. It provides the strongest delivery guarantees because logs are saved to disk before the Elastic Agent reads them. Thetcpsocket input offers real-time streaming, but it requires a stable network. Be aware that Vault's audit devices are blocking by default. If the Elastic Agent becomes unreachable and the socket buffer fills, Vault may stop responding to prevent un-audited actions. - Manage data volume: In high-traffic environments, audit logs can generate a large amount of data. You can use Vault's built-in audit filtering to exclude high-volume, low-value paths and reduce the load. For metrics, you can adjust the
Periodsetting in the integration to balance the need for visibility with the performance impact of polling the metrics endpoint. - Scale your Elastic Agents: For high-throughput environments, it's best to deploy a dedicated Elastic Agent on each Vault node instead of using a centralized collector. This approach distributes the JSON parsing load across your Vault cluster. If you are using socket-based collection for environments with very high event volumes, ensure the agent has enough CPU resources to handle the concurrent TCP connections.
For more information on architectures that you can use for scaling this integration, check the Ingest Architectures documentation.
- Vault Audit Devices: File
- Vault Audit Devices: Socket
- Vault Telemetry Configuration
- Vault API Documentation
- Vault Audit-Hash API
- Configure Systemd for Vault
The audit data stream collects audit logs from Hashicorp Vault. These logs contain detailed information about all requests and responses to Vault, providing a comprehensive trail of activity. This is useful for security monitoring, compliance, and troubleshooting.
Exported fields
| Field | Description | Type |
|---|---|---|
| @timestamp | Date/time when the event originated. This is the date/time extracted from the event, typically representing when the event was generated by the source. If the event source has no original timestamp, this value is typically populated by the first time the event was received by the pipeline. Required field for all events. | date |
| data_stream.dataset | The field can contain anything that makes sense to signify the source of the data. Examples include nginx.access, prometheus, endpoint etc. For data streams that otherwise fit, but that do not have dataset set we use the value "generic" for the dataset value. event.dataset should have the same value as data_stream.dataset. Beyond the Elasticsearch data stream naming criteria noted above, the dataset value has additional restrictions: * Must not contain - * No longer than 100 characters |
constant_keyword |
| data_stream.namespace | A user defined namespace. Namespaces are useful to allow grouping of data. Many users already organize their indices this way, and the data stream naming scheme now provides this best practice as a default. Many users will populate this field with default. If no value is used, it falls back to default. Beyond the Elasticsearch index naming criteria noted above, namespace value has the additional restrictions: * Must not contain - * No longer than 100 characters |
constant_keyword |
| data_stream.type | An overarching type for the data stream. Currently allowed values are "logs" and "metrics". We expect to also add "traces" and "synthetics" in the near future. | constant_keyword |
| ecs.version | ECS version this event conforms to. ecs.version is a required field and must exist in all events. When querying across multiple indices -- which may conform to slightly different ECS versions -- this field lets integrations adjust to the schema version of the events. |
keyword |
| event.action | The action captured by the event. This describes the information in the event. It is more specific than event.category. Examples are group-add, process-started, file-created. The value is normally defined by the implementer. |
keyword |
| event.category | This is one of four ECS Categorization Fields, and indicates the second level in the ECS category hierarchy. event.category represents the "big buckets" of ECS categories. For example, filtering on event.category:process yields all events relating to process activity. This field is closely related to event.type, which is used as a subcategory. This field is an array. This will allow proper categorization of some events that fall in multiple categories. |
keyword |
| event.dataset | Event dataset | constant_keyword |
| event.id | Unique ID to describe the event. | keyword |
| event.kind | This is one of four ECS Categorization Fields, and indicates the highest level in the ECS category hierarchy. event.kind gives high-level information about what type of information the event contains, without being specific to the contents of the event. For example, values of this field distinguish alert events from metric events. The value of this field can be used to inform how these kinds of events should be handled. They may warrant different retention, different access control, it may also help understand whether the data is coming in at a regular interval or not. |
keyword |
| event.module | Event module | constant_keyword |
| event.original | Raw text message of entire event. Used to demonstrate log integrity or where the full log message (before splitting it up in multiple parts) may be required, e.g. for reindex. This field is not indexed and doc_values are disabled. It cannot be searched, but it can be retrieved from _source. If users wish to override this and index this field, please see Field data types in the Elasticsearch Reference. |
keyword |
| event.outcome | This is one of four ECS Categorization Fields, and indicates the lowest level in the ECS category hierarchy. event.outcome simply denotes whether the event represents a success or a failure from the perspective of the entity that produced the event. Note that when a single transaction is described in multiple events, each event may populate different values of event.outcome, according to their perspective. Also note that in the case of a compound event (a single event that contains multiple logical events), this field should be populated with the value that best captures the overall success or failure from the perspective of the event producer. Further note that not all events will have an associated outcome. For example, this field is generally not populated for metric events, events with event.type:info, or any events for which an outcome does not make logical sense. |
keyword |
| event.type | This is one of four ECS Categorization Fields, and indicates the third level in the ECS category hierarchy. event.type represents a categorization "sub-bucket" that, when used along with the event.category field values, enables filtering events down to a level appropriate for single visualization. This field is an array. This will allow proper categorization of some events that fall in multiple event types. |
keyword |
| hashicorp_vault.audit.auth.accessor | This is an HMAC of the client token accessor | keyword |
| hashicorp_vault.audit.auth.client_token | This is an HMAC of the client's token ID. | keyword |
| hashicorp_vault.audit.auth.display_name | Display name is a non-security sensitive identifier that is applicable to this auth. It is used for logging and prefixing of dynamic secrets. For example, it may be "armon" for the github credential backend. If the client token is used to generate a SQL credential, the user may be "github-armon-uuid". This is to help identify the source without using audit tables. | keyword |
| hashicorp_vault.audit.auth.entity_id | Entity ID is the identifier of the entity in identity store to which the identity of the authenticating client belongs to. | keyword |
| hashicorp_vault.audit.auth.external_namespace_policies | External namespace policies represent the policies authorized from different namespaces indexed by respective namespace identifiers. | flattened |
| hashicorp_vault.audit.auth.identity_policies | These are the policies sourced from the identity. | keyword |
| hashicorp_vault.audit.auth.metadata | This will contain a list of metadata key/value pairs associated with the authenticated user. | flattened |
| hashicorp_vault.audit.auth.no_default_policy | Indicates that the default policy should not be added by core when creating a token. The default policy will still be added if it's explicitly defined. | boolean |
| hashicorp_vault.audit.auth.policies | Policies is the list of policies that the authenticated user is associated with. | keyword |
| hashicorp_vault.audit.auth.policy_results.allowed | boolean | |
| hashicorp_vault.audit.auth.policy_results.granting_policies.name | keyword | |
| hashicorp_vault.audit.auth.policy_results.granting_policies.namespace_id | keyword | |
| hashicorp_vault.audit.auth.policy_results.granting_policies.type | keyword | |
| hashicorp_vault.audit.auth.remaining_uses | long | |
| hashicorp_vault.audit.auth.token_issue_time | date | |
| hashicorp_vault.audit.auth.token_policies | These are the policies sourced from the token. | keyword |
| hashicorp_vault.audit.auth.token_ttl | long | |
| hashicorp_vault.audit.auth.token_type | keyword | |
| hashicorp_vault.audit.entity_created | entity_created is set to true if an entity is created as part of a login request. | boolean |
| hashicorp_vault.audit.error | If an error occurred with the request, the error message is included in this field's value. | keyword |
| hashicorp_vault.audit.request.client_certificate_serial_number | Serial number from the client's certificate. | keyword |
| hashicorp_vault.audit.request.client_id | keyword | |
| hashicorp_vault.audit.request.client_token | This is an HMAC of the client's token ID. | keyword |
| hashicorp_vault.audit.request.client_token_accessor | This is an HMAC of the client token accessor. | keyword |
| hashicorp_vault.audit.request.data | The data object will contain secret data in key/value pairs. | flattened |
| hashicorp_vault.audit.request.headers | Additional HTTP headers specified by the client as part of the request. | flattened |
| hashicorp_vault.audit.request.id | This is the unique request identifier. | keyword |
| hashicorp_vault.audit.request.mount_accessor | keyword | |
| hashicorp_vault.audit.request.mount_class | keyword | |
| hashicorp_vault.audit.request.mount_point | keyword | |
| hashicorp_vault.audit.request.mount_running_version | keyword | |
| hashicorp_vault.audit.request.mount_type | keyword | |
| hashicorp_vault.audit.request.namespace.id | keyword | |
| hashicorp_vault.audit.request.namespace.path | keyword | |
| hashicorp_vault.audit.request.operation | This is the type of operation which corresponds to path capabilities and is expected to be one of: create, read, update, delete, or list. | keyword |
| hashicorp_vault.audit.request.path | The requested Vault path for operation. | keyword |
| hashicorp_vault.audit.request.path.text | Multi-field of hashicorp_vault.audit.request.path. |
text |
| hashicorp_vault.audit.request.policy_override | Policy override indicates that the requestor wishes to override soft-mandatory Sentinel policies. | boolean |
| hashicorp_vault.audit.request.remote_address | The IP address of the client making the request. | ip |
| hashicorp_vault.audit.request.remote_port | The remote port of the client making the request. | long |
| hashicorp_vault.audit.request.replication_cluster | Name given to the replication secondary where this request originated. | keyword |
| hashicorp_vault.audit.request.wrap_ttl | If the token is wrapped, this displays configured wrapped TTL in seconds. | long |
| hashicorp_vault.audit.response.auth.accessor | keyword | |
| hashicorp_vault.audit.response.auth.client_token | keyword | |
| hashicorp_vault.audit.response.auth.display_name | keyword | |
| hashicorp_vault.audit.response.auth.entity_id | keyword | |
| hashicorp_vault.audit.response.auth.external_namespace_policies | flattened | |
| hashicorp_vault.audit.response.auth.identity_policies | keyword | |
| hashicorp_vault.audit.response.auth.metadata | flattened | |
| hashicorp_vault.audit.response.auth.no_default_policy | boolean | |
| hashicorp_vault.audit.response.auth.num_uses | long | |
| hashicorp_vault.audit.response.auth.policies | keyword | |
| hashicorp_vault.audit.response.auth.token_issue_time | date | |
| hashicorp_vault.audit.response.auth.token_policies | keyword | |
| hashicorp_vault.audit.response.auth.token_ttl | Time to live for the token in seconds. | long |
| hashicorp_vault.audit.response.auth.token_type | keyword | |
| hashicorp_vault.audit.response.data | Response payload. | flattened |
| hashicorp_vault.audit.response.headers | Headers will contain the http headers from the plugin that it wishes to have as part of the output. | flattened |
| hashicorp_vault.audit.response.mount_accessor | keyword | |
| hashicorp_vault.audit.response.mount_class | keyword | |
| hashicorp_vault.audit.response.mount_point | keyword | |
| hashicorp_vault.audit.response.mount_running_plugin_version | keyword | |
| hashicorp_vault.audit.response.mount_type | keyword | |
| hashicorp_vault.audit.response.redirect | Redirect is an HTTP URL to redirect to for further authentication. This is only valid for credential backends. This will be blanked for any logical backend and ignored. | keyword |
| hashicorp_vault.audit.response.warnings | keyword | |
| hashicorp_vault.audit.response.wrap_info.accessor | The token accessor for the wrapped response token. | keyword |
| hashicorp_vault.audit.response.wrap_info.creation_path | Creation path is the original request path that was used to create the wrapped response. | keyword |
| hashicorp_vault.audit.response.wrap_info.creation_time | The creation time. This can be used with the TTL to figure out an expected expiration. | date |
| hashicorp_vault.audit.response.wrap_info.token | The token containing the wrapped response. | keyword |
| hashicorp_vault.audit.response.wrap_info.ttl | Specifies the desired TTL of the wrapping token. | long |
| hashicorp_vault.audit.response.wrap_info.wrapped_accessor | The token accessor for the wrapped response token. | keyword |
| hashicorp_vault.audit.type | Audit record type (request or response). | keyword |
| input.type | keyword | |
| log.file.path | Full path to the log file this event came from, including the file name. It should include the drive letter, when appropriate. If the event wasn't read from a log file, do not populate this field. | keyword |
| log.offset | long | |
| log.source.address | Source address (IP and port) of the log message. | keyword |
| message | For log events the message field contains the log message, optimized for viewing in a log viewer. For structured logs without an original message field, other fields can be concatenated to form a human-readable summary of the event. If multiple messages exist, they can be combined into one message. | match_only_text |
| nomad.allocation.id | Nomad allocation ID | keyword |
| nomad.namespace | Nomad namespace. | keyword |
| nomad.node.id | Nomad node ID. | keyword |
| nomad.task.name | Nomad task name. | keyword |
| related.ip | All of the IPs seen on your event. | ip |
| source.as.number | Unique number allocated to the autonomous system. The autonomous system number (ASN) uniquely identifies each network on the Internet. | long |
| source.as.organization.name | Organization name. | keyword |
| source.as.organization.name.text | Multi-field of source.as.organization.name. |
match_only_text |
| source.geo.city_name | City name. | keyword |
| source.geo.continent_name | Name of the continent. | keyword |
| source.geo.country_iso_code | Country ISO code. | keyword |
| source.geo.country_name | Country name. | keyword |
| source.geo.location | Longitude and latitude. | geo_point |
| source.geo.region_iso_code | Region ISO code. | keyword |
| source.geo.region_name | Region name. | keyword |
| source.ip | IP address of the source (IPv4 or IPv6). | ip |
| source.port | Port of the source. | long |
| tags | List of keywords used to tag each event. | keyword |
| user.email | User email address. | keyword |
| user.id | Unique identifier of the user. | keyword |
| user_agent.device.name | Name of the device. | keyword |
| user_agent.name | Name of the user agent. | keyword |
| user_agent.original | Unparsed user_agent string. | keyword |
| user_agent.original.text | Multi-field of user_agent.original. |
match_only_text |
| user_agent.os.full | Operating system name, including the version or code name. | keyword |
| user_agent.os.full.text | Multi-field of user_agent.os.full. |
match_only_text |
| user_agent.os.name | Operating system name, without the version. | keyword |
| user_agent.os.name.text | Multi-field of user_agent.os.name. |
match_only_text |
| user_agent.os.version | Operating system version as a raw string. | keyword |
| user_agent.version | Version of the user agent. | keyword |
Example
{
    "@timestamp": "2023-09-26T13:07:49.743Z",
    "agent": {
        "ephemeral_id": "5bbd86cc-8032-432d-be82-fae8f624ed98",
        "id": "f25d13cd-18cc-4e73-822c-c4f849322623",
        "name": "docker-fleet-agent",
        "type": "filebeat",
        "version": "8.10.1"
    },
    "data_stream": {
        "dataset": "hashicorp_vault.audit",
        "namespace": "ep",
        "type": "logs"
    },
    "ecs": {
        "version": "8.17.0"
    },
    "elastic_agent": {
        "id": "f25d13cd-18cc-4e73-822c-c4f849322623",
        "snapshot": false,
        "version": "8.10.1"
    },
    "event": {
        "action": "update",
        "agent_id_status": "verified",
        "category": [
            "authentication"
        ],
        "dataset": "hashicorp_vault.audit",
        "id": "0b1b9013-da54-633d-da69-8575e6794ed3",
        "ingested": "2023-09-26T13:08:15Z",
        "kind": "event",
        "original": "{\"time\":\"2023-09-26T13:07:49.743284857Z\",\"type\":\"request\",\"auth\":{\"token_type\":\"default\"},\"request\":{\"id\":\"0b1b9013-da54-633d-da69-8575e6794ed3\",\"operation\":\"update\",\"namespace\":{\"id\":\"root\"},\"path\":\"sys/audit/test\"}}",
        "outcome": "success",
        "type": [
            "info"
        ]
    },
    "hashicorp_vault": {
        "audit": {
            "auth": {
                "token_type": "default"
            },
            "request": {
                "id": "0b1b9013-da54-633d-da69-8575e6794ed3",
                "namespace": {
                    "id": "root"
                },
                "operation": "update",
                "path": "sys/audit/test"
            },
            "type": "request"
        }
    },
    "host": {
        "architecture": "x86_64",
        "containerized": false,
        "hostname": "docker-fleet-agent",
        "id": "28da52b32df94b50aff67dfb8f1be3d6",
        "ip": [
            "192.168.80.5"
        ],
        "mac": [
            "02-42-C0-A8-50-05"
        ],
        "name": "docker-fleet-agent",
        "os": {
            "codename": "focal",
            "family": "debian",
            "kernel": "5.10.104-linuxkit",
            "name": "Ubuntu",
            "platform": "ubuntu",
            "type": "linux",
            "version": "20.04.6 LTS (Focal Fossa)"
        }
    },
    "input": {
        "type": "log"
    },
    "log": {
        "file": {
            "path": "/tmp/service_logs/vault/audit.json"
        },
        "offset": 0
    },
    "tags": [
        "preserve_original_event",
        "hashicorp-vault-audit"
    ]
}
The log data stream collects the operational logs from Hashicorp Vault. These logs provide insights into the internal operations of the Vault server, including startup, shutdown, errors, and warnings. They are essential for monitoring the health and performance of your Vault instance.
Exported fields
| Field | Description | Type |
|---|---|---|
| @timestamp | Date/time when the event originated. This is the date/time extracted from the event, typically representing when the event was generated by the source. If the event source has no original timestamp, this value is typically populated by the first time the event was received by the pipeline. Required field for all events. | date |
| data_stream.dataset | The field can contain anything that makes sense to signify the source of the data. Examples include nginx.access, prometheus, endpoint etc. For data streams that otherwise fit, but that do not have dataset set we use the value "generic" for the dataset value. event.dataset should have the same value as data_stream.dataset. Beyond the Elasticsearch data stream naming criteria noted above, the dataset value has additional restrictions: * Must not contain - * No longer than 100 characters |
constant_keyword |
| data_stream.namespace | A user defined namespace. Namespaces are useful to allow grouping of data. Many users already organize their indices this way, and the data stream naming scheme now provides this best practice as a default. Many users will populate this field with default. If no value is used, it falls back to default. Beyond the Elasticsearch index naming criteria noted above, namespace value has the additional restrictions: * Must not contain - * No longer than 100 characters |
constant_keyword |
| data_stream.type | An overarching type for the data stream. Currently allowed values are "logs" and "metrics". We expect to also add "traces" and "synthetics" in the near future. | constant_keyword |
| ecs.version | ECS version this event conforms to. ecs.version is a required field and must exist in all events. When querying across multiple indices -- which may conform to slightly different ECS versions -- this field lets integrations adjust to the schema version of the events. |
keyword |
| event.dataset | Event dataset | constant_keyword |
| event.kind | This is one of four ECS Categorization Fields, and indicates the highest level in the ECS category hierarchy. event.kind gives high-level information about what type of information the event contains, without being specific to the contents of the event. For example, values of this field distinguish alert events from metric events. The value of this field can be used to inform how these kinds of events should be handled. They may warrant different retention, different access control, it may also help understand whether the data is coming in at a regular interval or not. |
keyword |
| event.module | Event module | constant_keyword |
| event.original | Raw text message of entire event. Used to demonstrate log integrity or where the full log message (before splitting it up in multiple parts) may be required, e.g. for reindex. This field is not indexed and doc_values are disabled. It cannot be searched, but it can be retrieved from _source. If users wish to override this and index this field, please see Field data types in the Elasticsearch Reference. |
keyword |
| file.path | Full path to the file, including the file name. It should include the drive letter, when appropriate. | keyword |
| file.path.text | Multi-field of file.path. |
match_only_text |
| hashicorp_vault.log | flattened | |
| input.type | keyword | |
| log.file.path | Full path to the log file this event came from, including the file name. It should include the drive letter, when appropriate. If the event wasn't read from a log file, do not populate this field. | keyword |
| log.level | Original log level of the log event. If the source of the event provides a log level or textual severity, this is the one that goes in log.level. If your source doesn't specify one, you may put your event transport's severity here (e.g. Syslog severity). Some examples are warn, err, i, informational. |
keyword |
| log.logger | The name of the logger inside an application. This is usually the name of the class which initialized the logger, or can be a custom name. | keyword |
| log.offset | long | |
| message | For log events the message field contains the log message, optimized for viewing in a log viewer. For structured logs without an original message field, other fields can be concatenated to form a human-readable summary of the event. If multiple messages exist, they can be combined into one message. | match_only_text |
| tags | List of keywords used to tag each event. | keyword |
Example
{
    "@timestamp": "2023-09-26T13:09:08.587Z",
    "agent": {
        "ephemeral_id": "5bbd86cc-8032-432d-be82-fae8f624ed98",
        "id": "f25d13cd-18cc-4e73-822c-c4f849322623",
        "name": "docker-fleet-agent",
        "type": "filebeat",
        "version": "8.10.1"
    },
    "data_stream": {
        "dataset": "hashicorp_vault.log",
        "namespace": "ep",
        "type": "logs"
    },
    "ecs": {
        "version": "8.17.0"
    },
    "elastic_agent": {
        "id": "f25d13cd-18cc-4e73-822c-c4f849322623",
        "snapshot": false,
        "version": "8.10.1"
    },
    "event": {
        "agent_id_status": "verified",
        "dataset": "hashicorp_vault.log",
        "ingested": "2023-09-26T13:09:35Z",
        "kind": "event",
        "original": "{\"@level\":\"info\",\"@message\":\"proxy environment\",\"@timestamp\":\"2023-09-26T13:09:08.587324Z\",\"http_proxy\":\"\",\"https_proxy\":\"\",\"no_proxy\":\"\"}"
    },
    "hashicorp_vault": {
        "log": {
            "http_proxy": "",
            "https_proxy": "",
            "no_proxy": ""
        }
    },
    "host": {
        "architecture": "x86_64",
        "containerized": false,
        "hostname": "docker-fleet-agent",
        "id": "28da52b32df94b50aff67dfb8f1be3d6",
        "ip": [
            "192.168.80.5"
        ],
        "mac": [
            "02-42-C0-A8-50-05"
        ],
        "name": "docker-fleet-agent",
        "os": {
            "codename": "focal",
            "family": "debian",
            "kernel": "5.10.104-linuxkit",
            "name": "Ubuntu",
            "platform": "ubuntu",
            "type": "linux",
            "version": "20.04.6 LTS (Focal Fossa)"
        }
    },
    "input": {
        "type": "log"
    },
    "log": {
        "file": {
            "path": "/tmp/service_logs/log.json"
        },
        "level": "info",
        "offset": 709
    },
    "message": "proxy environment",
    "tags": [
        "preserve_original_event",
        "hashicorp-vault-log"
    ]
}
The metrics data stream collects telemetry data from Hashicorp Vault. These metrics provide real-time visibility into Vault's performance, including memory usage, request latency, and backend operations. The metrics are collected in Prometheus format.
Exported fields
| Field | Description | Type | Metric Type |
|---|---|---|---|
| @timestamp | Date/time when the event originated. This is the date/time extracted from the event, typically representing when the event was generated by the source. If the event source has no original timestamp, this value is typically populated by the first time the event was received by the pipeline. Required field for all events. | date | |
| agent.id | Unique identifier of this agent (if one exists). Example: For Beats this would be beat.id. | keyword | |
| cloud.account.id | The cloud account or organization id used to identify different entities in a multi-tenant environment. Examples: AWS account id, Google Cloud ORG Id, or other unique identifier. | keyword | |
| cloud.availability_zone | Availability zone in which this host, resource, or service is located. | keyword | |
| cloud.instance.id | Instance ID of the host machine. | keyword | |
| cloud.provider | Name of the cloud provider. Example values are aws, azure, gcp, or digitalocean. | keyword | |
| cloud.region | Region in which this host, resource, or service is located. | keyword | |
| container.id | Unique container id. | keyword | |
| data_stream.dataset | The field can contain anything that makes sense to signify the source of the data. Examples include nginx.access, prometheus, endpoint etc. For data streams that otherwise fit, but that do not have dataset set we use the value "generic" for the dataset value. event.dataset should have the same value as data_stream.dataset. Beyond the Elasticsearch data stream naming criteria noted above, the dataset value has additional restrictions: * Must not contain - * No longer than 100 characters |
constant_keyword | |
| data_stream.namespace | A user defined namespace. Namespaces are useful to allow grouping of data. Many users already organize their indices this way, and the data stream naming scheme now provides this best practice as a default. Many users will populate this field with default. If no value is used, it falls back to default. Beyond the Elasticsearch index naming criteria noted above, namespace value has the additional restrictions: * Must not contain - * No longer than 100 characters |
constant_keyword | |
| data_stream.type | An overarching type for the data stream. Currently allowed values are "logs" and "metrics". We expect to also add "traces" and "synthetics" in the near future. | constant_keyword | |
| ecs.version | ECS version this event conforms to. ecs.version is a required field and must exist in all events. When querying across multiple indices -- which may conform to slightly different ECS versions -- this field lets integrations adjust to the schema version of the events. |
keyword | |
| event.dataset | Event dataset | constant_keyword | |
| event.duration | Duration of the event in nanoseconds. If event.start and event.end are known this value should be the difference between the end and start time. |
long | |
| event.kind | This is one of four ECS Categorization Fields, and indicates the highest level in the ECS category hierarchy. event.kind gives high-level information about what type of information the event contains, without being specific to the contents of the event. For example, values of this field distinguish alert events from metric events. The value of this field can be used to inform how these kinds of events should be handled. They may warrant different retention, different access control, it may also help understand whether the data is coming in at a regular interval or not. |
keyword | |
| event.module | Event module | constant_keyword | |
| hashicorp_vault.metrics.*.counter | Hashicorp Vault telemetry data from the Prometheus endpoint. | double | counter |
| hashicorp_vault.metrics.*.histogram | Hashicorp Vault telemetry data from the Prometheus endpoint. | histogram | |
| hashicorp_vault.metrics.*.rate | Hashicorp Vault telemetry data from the Prometheus endpoint. | double | gauge |
| hashicorp_vault.metrics.*.value | Hashicorp Vault telemetry data from the Prometheus endpoint. | double | gauge |
| host.name | Name of the host. It can contain what hostname returns on Unix systems, the fully qualified domain name (FQDN), or a name specified by the user. The recommended value is the lowercase FQDN of the host. | keyword | |
| labels | Custom key/value pairs. Can be used to add meta information to events. Should not contain nested objects. All values are stored as keyword. Example: docker and k8s labels. |
object | |
| labels.auth_method | Authorization engine type. | keyword | |
| labels.cluster | The cluster name from which the metric originated; set in the configuration file, or automatically generated when a cluster is created. | keyword | |
| labels.cluster_address | Address of the Vault cluster from which the metric originated. | keyword | |
| labels.code | The HTTP response status code returned by the Vault API (e.g., "200", "400", "404", "500") | keyword | |
| labels.creation_ttl | Time-to-live value assigned to a token or lease at creation. This value is rounded up to the next-highest bucket; the available buckets are 1m, 10m, 20m, 1h, 2h, 1d, 2d, 7d, and 30d. Any longer TTL is assigned the value +Inf. | keyword | |
| labels.expiring | keyword | ||
| labels.gauge | keyword | ||
| labels.host | keyword | ||
| labels.instance | keyword | ||
| labels.job | keyword | ||
| labels.local | keyword | ||
| labels.mount_point | Path at which an auth method or secret engine is mounted. | keyword | |
| labels.namespace | A namespace path, or root for the root namespace | keyword | |
| labels.policy | keyword | ||
| labels.quantile | keyword | ||
| labels.queue_id | keyword | ||
| labels.seal_wrapper_name | The name of the seal wrapper or auto-seal backend configured in Vault (e.g., awskms, transit, shamir). It provides a dimension to track metrics like decryption times, decryption errors, and health check statuses specific to each configured seal mechanism. | keyword | |
| labels.term | keyword | ||
| labels.token_type | Identifies whether the token is a batch token or a service token. | keyword | |
| labels.type | keyword | ||
| labels.version | keyword | ||
| service.address | Address where data about this service was collected from. This should be a URI, network address (ipv4:port or [ipv6]:port) or a resource path (sockets). | keyword | |
| service.type | The type of the service data is collected from. The type can be used to group and correlate logs and metrics from one service type. Example: If logs or metrics are collected from Elasticsearch, service.type would be elasticsearch. |
keyword |
Example
{
    "@timestamp": "2023-09-26T13:11:06.913Z",
    "agent": {
        "ephemeral_id": "3de3cc3a-6b9f-46c0-a268-200ac7dda214",
        "id": "f25d13cd-18cc-4e73-822c-c4f849322623",
        "name": "docker-fleet-agent",
        "type": "metricbeat",
        "version": "8.10.1"
    },
    "data_stream": {
        "dataset": "hashicorp_vault.metrics",
        "namespace": "ep",
        "type": "metrics"
    },
    "ecs": {
        "version": "8.17.0"
    },
    "elastic_agent": {
        "id": "f25d13cd-18cc-4e73-822c-c4f849322623",
        "snapshot": false,
        "version": "8.10.1"
    },
    "event": {
        "agent_id_status": "verified",
        "duration": 4669007,
        "ingested": "2023-09-26T13:11:09Z",
        "kind": "metric"
    },
    "hashicorp_vault": {
        "metrics": {
            "vault_barrier_estimated_encryptions": {
                "counter": 48,
                "rate": 0
            }
        }
    },
    "host": {
        "architecture": "x86_64",
        "containerized": false,
        "hostname": "docker-fleet-agent",
        "id": "28da52b32df94b50aff67dfb8f1be3d6",
        "ip": [
            "192.168.80.5"
        ],
        "mac": [
            "02-42-C0-A8-50-05"
        ],
        "name": "docker-fleet-agent",
        "os": {
            "codename": "focal",
            "family": "debian",
            "kernel": "5.10.104-linuxkit",
            "name": "Ubuntu",
            "platform": "ubuntu",
            "type": "linux",
            "version": "20.04.6 LTS (Focal Fossa)"
        }
    },
    "labels": {
        "cluster_address": "https://hashicorp_vault:8201",
        "host": "hashicorp_vault",
        "instance": "hashicorp_vault:8200",
        "job": "hashicorp_vault",
        "term": "1"
    },
    "metricset": {
        "period": 5000
    },
    "service": {
        "type": "hashicorp_vault"
    }
}
These inputs can be used with this integration:
logfile
For more details about the logfile input settings, check the Filebeat documentation.
To collect logs via logfile, select Collect logs via the logfile input and configure the following parameter:
- Paths: List of glob-based paths to crawl and fetch log files from. Supports glob patterns like
/var/log/*.logor/var/log/*/*.logfor subfolder matching. Each file found starts a separate harvester.
tcp
For more details about the TCP input settings, check the Filebeat documentation.
To collect logs via TCP, select Collect logs via TCP and configure the following parameters:
Required Settings:
- Host
- Port
Common Optional Settings:
- Max Message Size - Maximum size of incoming messages
- Max Connections - Maximum number of concurrent connections
- Timeout - How long to wait for data before closing idle connections
- Line Delimiter - Character(s) that separate log messages
To enable encrypted connections, configure the following SSL settings:
SSL Settings:
- Enable SSL - Toggle to enable SSL/TLS encryption
- Certificate - Path to the SSL certificate file (
.crtor.pem) - Certificate Key - Path to the private key file (
.key) - Certificate Authorities - Path to CA certificate file for client certificate validation (optional)
- Client Authentication - Require client certificates (
none,optional, orrequired) - Supported Protocols - TLS versions to support (e.g.,
TLSv1.2,TLSv1.3)
Example SSL Configuration:
ssl.enabled: true
ssl.certificate: "/path/to/server.crt"
ssl.key: "/path/to/server.key"
ssl.certificate_authorities: ["/path/to/ca.crt"]
ssl.client_authentication: "optional"
This integration uses the following API to collect metrics:
/v1/sys/metrics: This endpoint is used to collect Prometheus-formatted telemetry data from Vault. For more information, see the HashiCorp Vault Metrics API documentation.
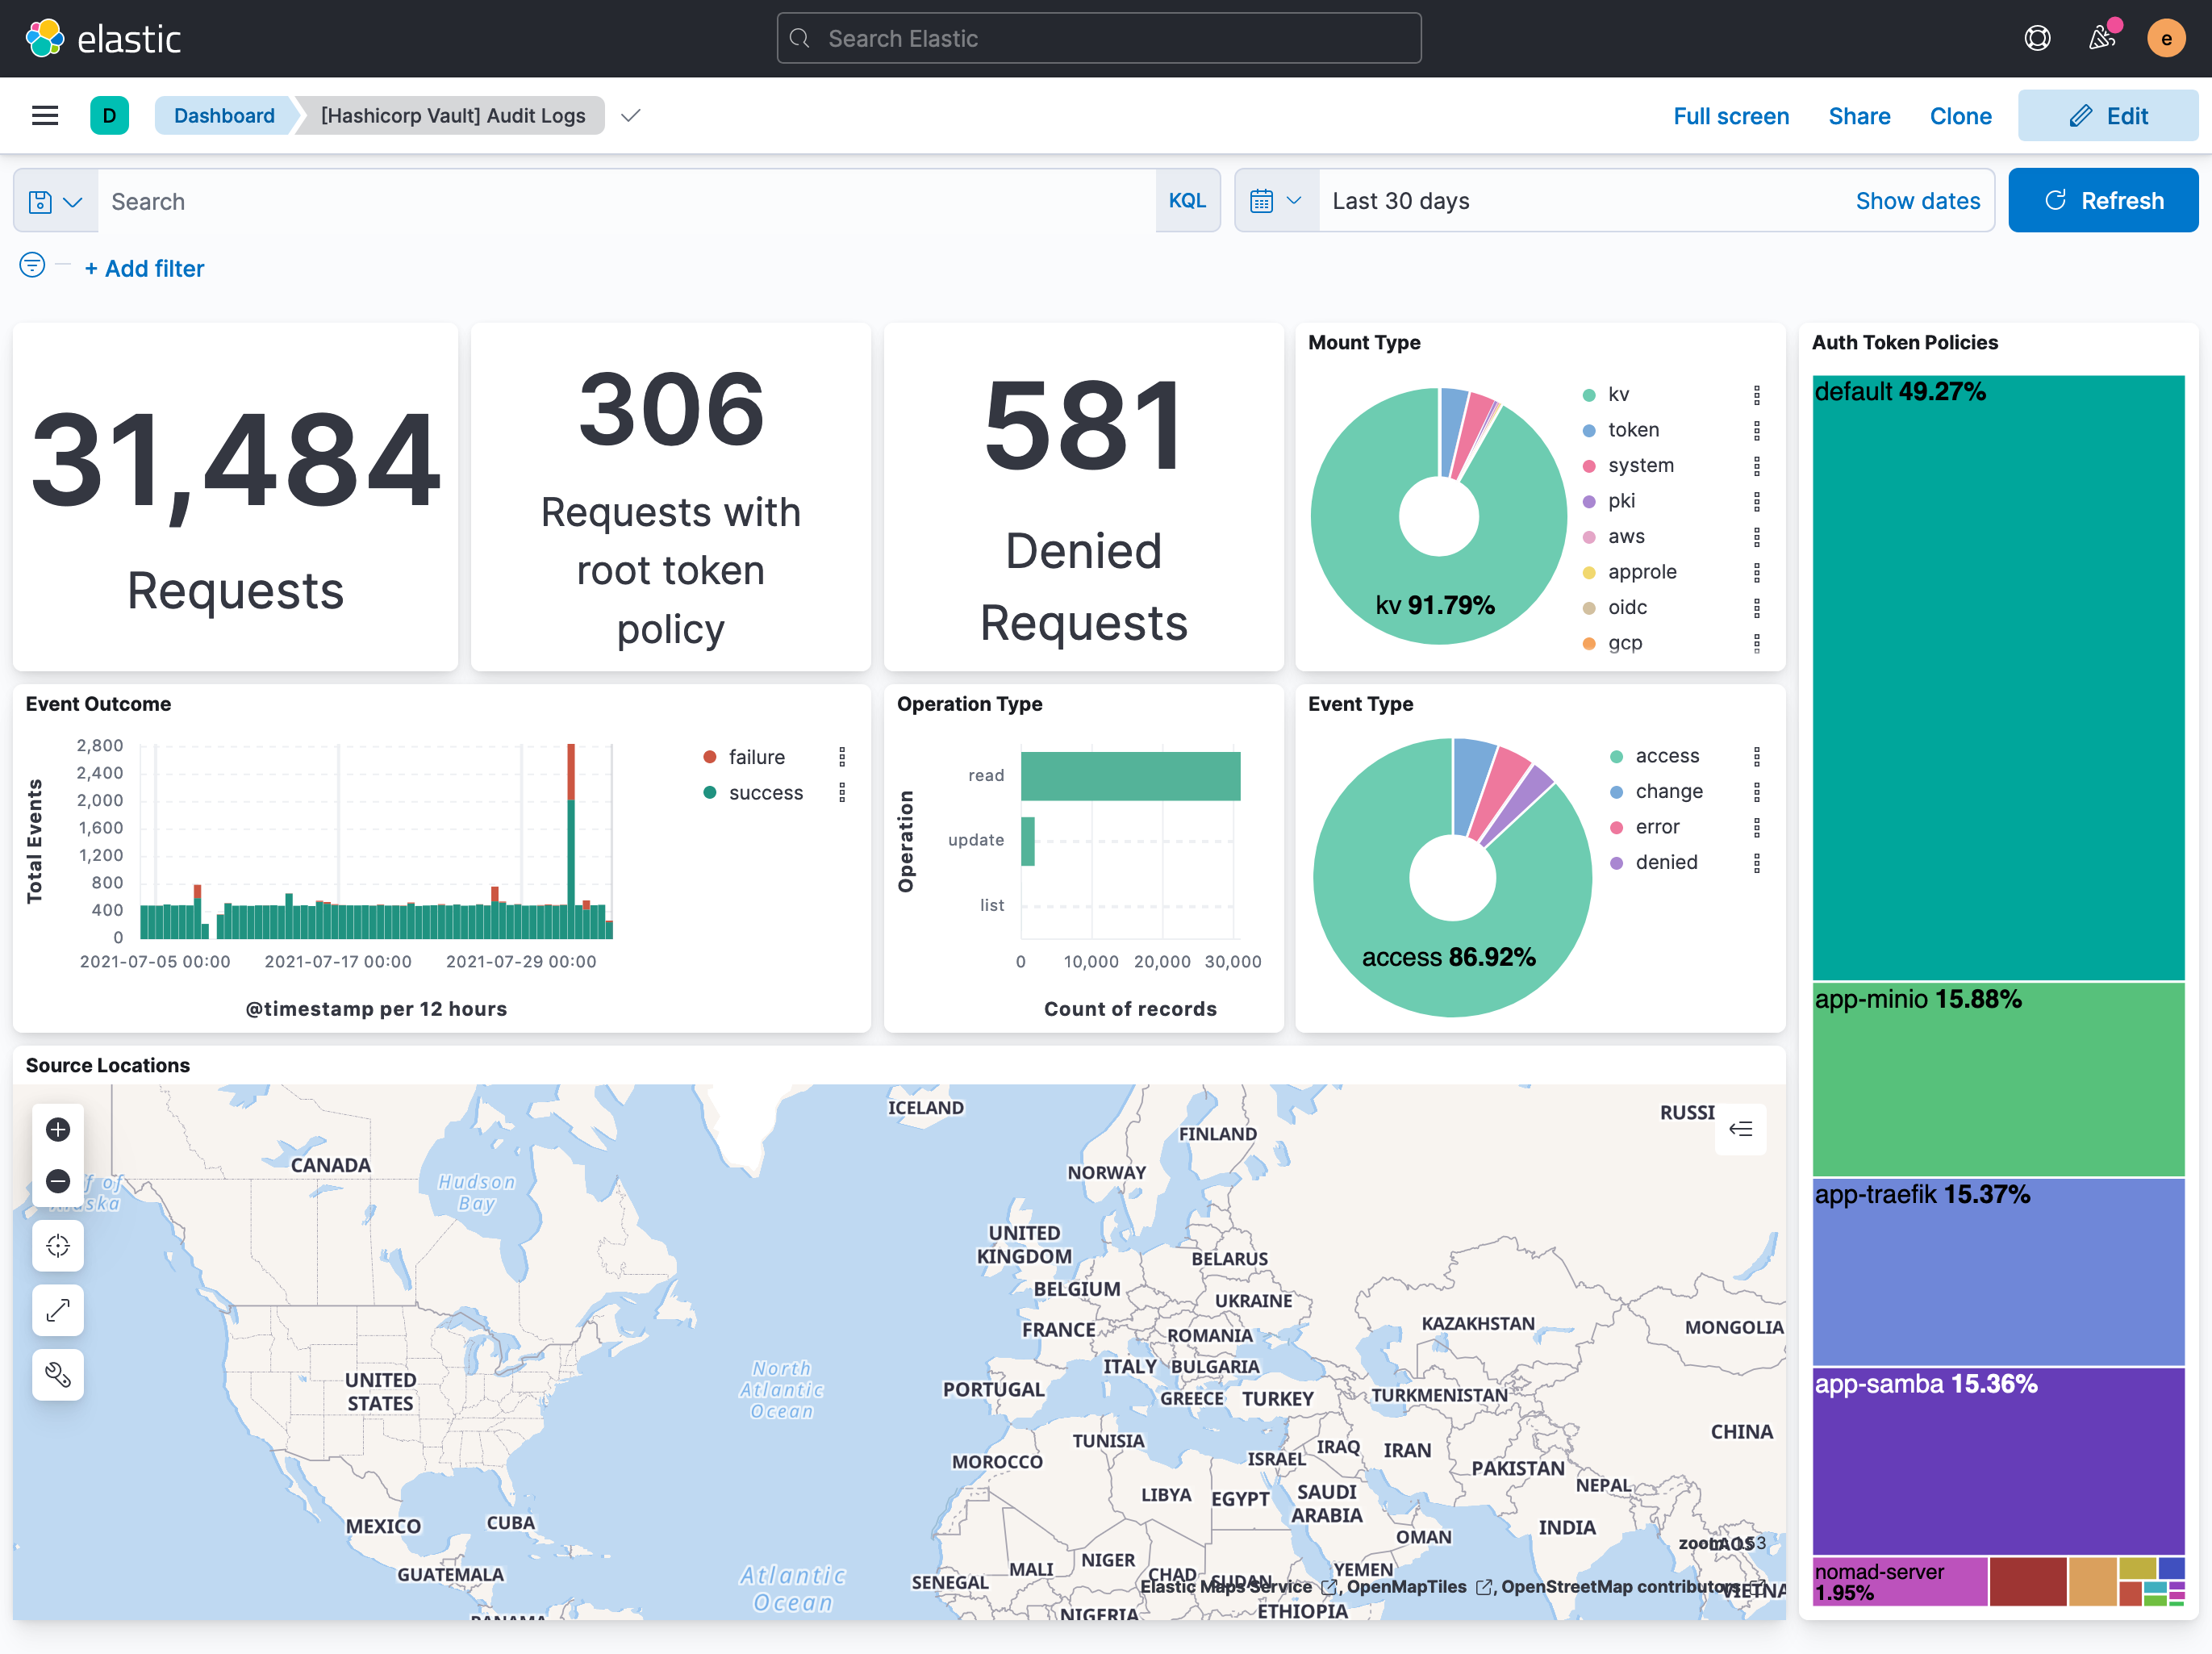
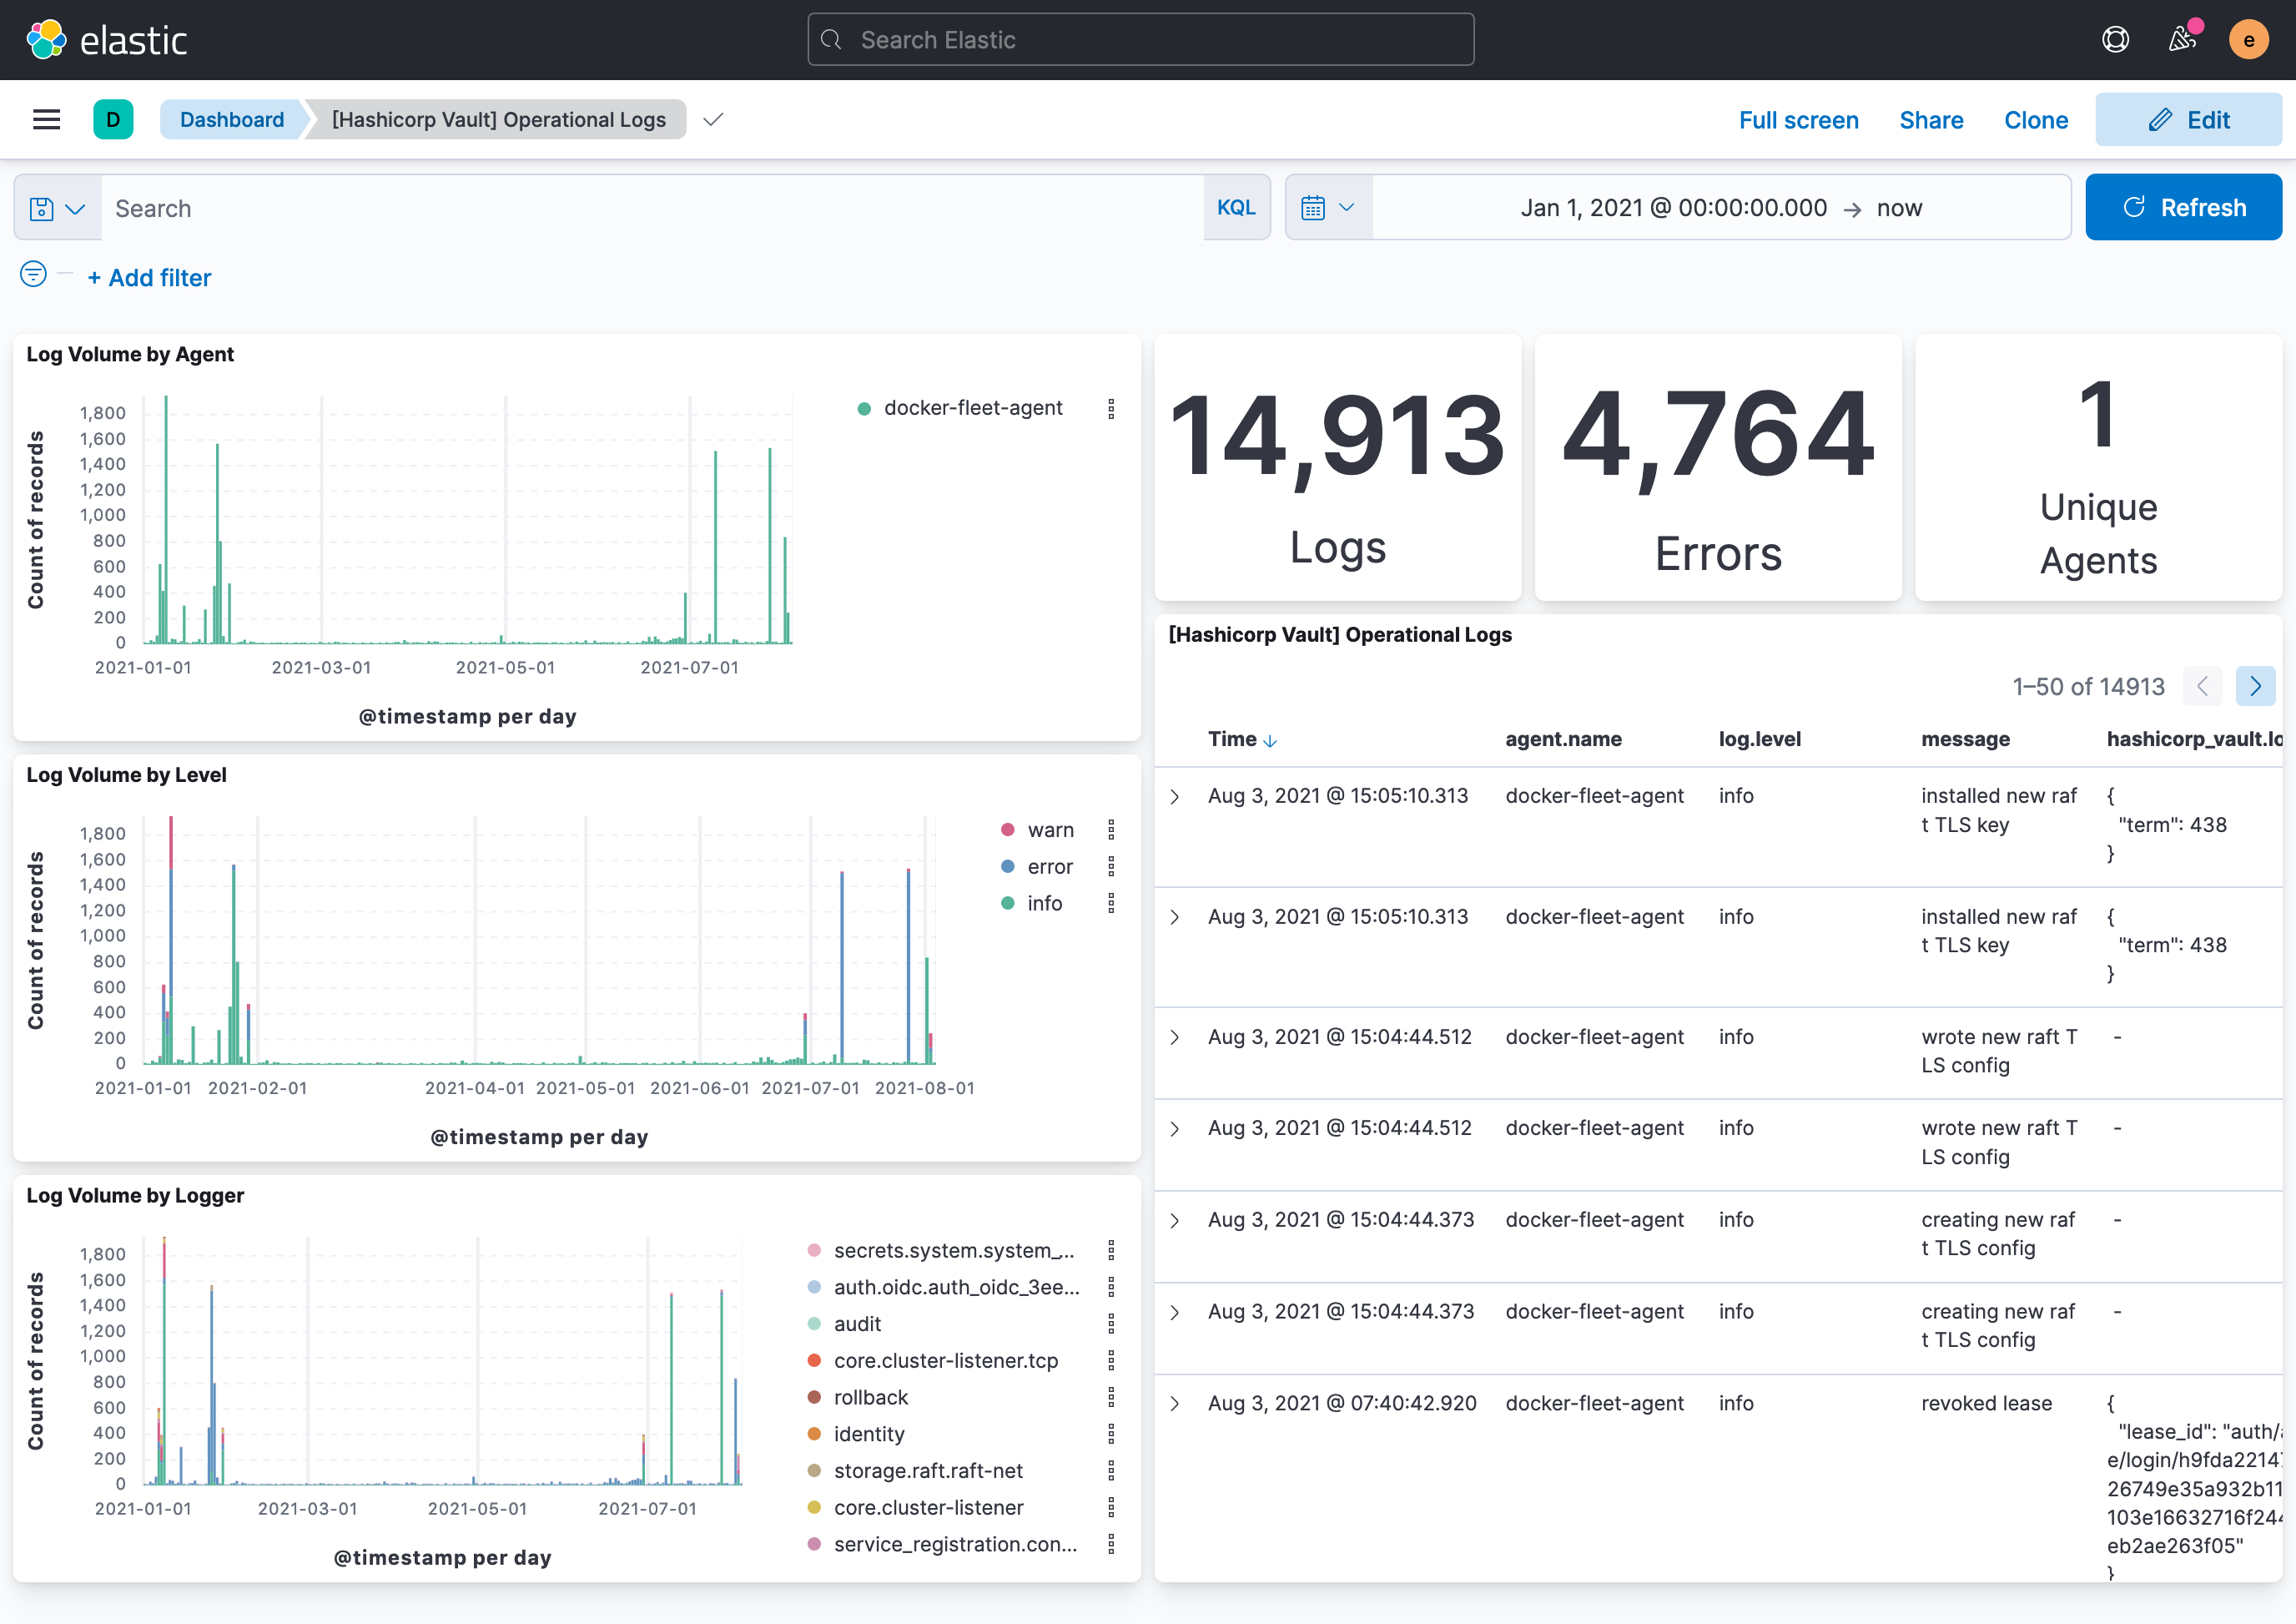
This integration includes one or more Kibana dashboards that visualizes the data collected by the integration. The screenshots below illustrate how the ingested data is displayed.
Changelog
| Version | Details | Minimum Kibana version |
|---|---|---|
| 1.31.0 | Enhancement (View pull request) Populate and parse user_agent fields from the audit request's User-Agent header. |
9.0.0 8.12.0 |
| 1.30.2 | Bug fix (View pull request) Remove top level note from docs |
9.0.0 8.12.0 |
| 1.30.1 | Bug fix (View pull request) Add cluster_address, code, and seal_wrapper_name as dimension fields to prevent duplicate document conflicts in TSDS. Bump test Vault Docker image from 1.11.2 to 1.21.4. |
9.0.0 8.12.0 |
| 1.30.0 | Enhancement (View pull request) Update integration documentation |
9.0.0 8.12.0 |
| 1.29.0 | Enhancement (View pull request) Preserve event.original on pipeline error. |
9.0.0 8.12.0 |
| 1.28.2 | Enhancement (View pull request) Generate processor tags and normalize error handler. |
9.0.0 8.12.0 |
| 1.28.1 | Enhancement (View pull request) Changed owners. |
9.0.0 8.12.0 |
| 1.28.0 | Enhancement (View pull request) Allow @custom pipeline access to event.original without setting preserve_original_event. |
9.0.0 8.12.0 |
| 1.27.0 | Enhancement (View pull request) Support stack version 9.0. |
9.0.0 8.12.0 |
| 1.26.1 | Bug fix (View pull request) Updated SSL description to be uniform and to include links to documentation. |
8.12.0 |
| 1.26.0 | Enhancement (View pull request) ECS version updated to 8.17.0. |
8.12.0 |
| 1.25.0 | Enhancement (View pull request) Add global filter on data_stream.dataset to improve performance. |
8.12.0 |
| 1.24.0 | Enhancement (View pull request) Update package-spec to 3.0.3. |
8.12.0 |
| 1.23.0 | Enhancement (View pull request) Set sensitive values as secret. |
8.12.0 |
| 1.22.2 | Enhancement (View pull request) Changed owners |
8.9.0 |
| 1.22.1 | Bug fix (View pull request) Fix exclude_files pattern. |
8.9.0 |
| 1.22.0 | Enhancement (View pull request) ECS version updated to 8.11.0. |
8.9.0 |
| 1.21.0 | Enhancement (View pull request) Enable time series data streams for the metrics datasets. This improves storage usage and query performance. For more details, see https://www.elastic.co/guide/en/elasticsearch/reference/current/tsds.html |
8.9.0 |
| 1.20.0 | Enhancement (View pull request) Add dimension mapping to metrics datastream |
8.9.0 |
| 1.19.0 | Enhancement (View pull request) Improve 'event.original' check to avoid errors if set. |
8.9.0 |
| 1.18.0 | Enhancement (View pull request) Add metric_type mapping to metrics datastream |
8.9.0 |
| 1.17.0 | Enhancement (View pull request) Update the package format_version to 3.0.0. |
8.6.2 |
| 1.16.1 | Bug fix (View pull request) Use regular Fleet package fields to create dynamic mappings for prometheus metrics. Enhancement (View pull request) Refer to the ECS definition for all fields that exist in ECS. |
8.6.2 |
| 1.16.0 | Enhancement (View pull request) Update package to ECS 8.10.0 and align ECS categorization fields. |
8.0.0 7.17.0 |
| 1.15.0 | Enhancement (View pull request) Add tags.yml file so that integration's dashboards and saved searches are tagged with "Security Solution" and displayed in the Security Solution UI. |
8.0.0 7.17.0 |
| 1.14.0 | Enhancement (View pull request) Update package to ECS 8.9.0. |
8.0.0 7.17.0 |
| 1.13.0 | Enhancement (View pull request) Update package spec to 2.9.0. |
8.0.0 7.17.0 |
| 1.12.0 | Enhancement (View pull request) Ensure event.kind is correctly set for pipeline errors. |
8.0.0 7.17.0 |
| 1.11.0 | Enhancement (View pull request) Update package to ECS 8.8.0. |
8.0.0 7.17.0 |
| 1.10.0 | Enhancement (View pull request) Update package to ECS 8.7.0. |
8.0.0 7.17.0 |
| 1.9.1 | Enhancement (View pull request) Added categories and/or subcategories. |
8.0.0 7.17.0 |
| 1.9.0 | Enhancement (View pull request) Update package to ECS 8.6.0. |
8.0.0 7.17.0 |
| 1.8.0 | Enhancement (View pull request) Update package to ECS 8.5.0. |
8.0.0 7.17.0 |
| 1.7.0 | Enhancement (View pull request) Update mappings for Hashicorp Vault 1.11. |
8.0.0 7.17.0 |
| 1.6.0 | Enhancement (View pull request) Update package to ECS 8.4.0 |
8.0.0 7.16.0 |
| 1.5.0 | Enhancement (View pull request) Update package to ECS 8.3.0. |
8.0.0 7.16.0 |
| 1.4.0 | Enhancement (View pull request) Update to ECS 8.2 |
8.0.0 7.16.0 |
| 1.3.3 | Bug fix (View pull request) Use dynamic mappings for all hashicorp_vault.metrics fields. |
8.0.0 7.16.0 |
| 1.3.2 | Enhancement (View pull request) Add documentation for multi-fields |
— |
| 1.3.1 | Enhancement (View pull request) Update docs to use markdown code blocks |
8.0.0 7.16.0 |
| 1.3.0 | Enhancement (View pull request) Update to ECS 8.0 |
— |
| 1.2.3 | Bug fix (View pull request) Make hashicorp_vault.audit.request.id optional in the audit pipeline to prevent errors. |
8.0.0 7.16.0 |
| 1.2.2 | Bug fix (View pull request) Regenerate test files using the new GeoIP database |
— |
| 1.2.1 | Bug fix (View pull request) Change test public IPs to the supported subset |
— |
| 1.2.0 | Enhancement (View pull request) Add 8.0.0 version constraint |
8.0.0 7.16.0 |
| 1.1.4 | Enhancement (View pull request) Uniform with guidelines |
7.16.0 |
| 1.1.3 | Enhancement (View pull request) Update Title and Description. |
7.16.0 |
| 1.1.2 | Enhancement (View pull request) Add missing fields to metrics |
— |
| 1.1.1 | Bug fix (View pull request) Fix logic that checks for the 'forwarded' tag |
— |
| 1.1.0 | Enhancement (View pull request) Update to ECS 1.12.0 |
— |
| 1.0.0 | Enhancement (View pull request) make GA |
— |
| 0.0.1 | Enhancement (View pull request) Initial package with audit, log, and metrics. |
— |