Cassandra Integration
Elastic Cloud Serverless projects are autoscaled environments, fully managed by Elastic and available on Elastic Cloud. Availability This functionality is generally available and ready for production usage. Elastic Cloud Serverless projects are autoscaled environments, fully managed by Elastic and available on Elastic Cloud. Availability This functionality is generally available and ready for production usage. The Elastic Stack includes Elastic's core products such as Elasticsearch, Kibana, Logstash, and Beats. Availability This functionality is generally available and ready for production usage. Unless stated otherwise on the page, this functionality is available when your Elastic Stack is deployed on Elastic Cloud Hosted, Elastic Cloud Enterprise, Elastic Cloud on Kubernetes, and self-managed environments. This documentation corresponds to the latest patch available for each minor version. If you're not using the latest patch, check the release notes for changes.
Serverless Observability
Generally available
Serverless Security
Generally available
Stack
9.0+
Generally available since 9.0
| Version | 1.20.0 (View all) |
| Subscription level What's this? |
Basic |
| Developed by What's this? |
Elastic |
| Ingestion method(s) | File, Jolokia |
| Minimum Kibana version(s) | 9.0.0 8.13.0 |
This integration periodically fetches metrics from Cassandra using Jolokia agent. It can parse System logs.
This integration has been tested against Cassandra version 3.11.11.
- Java Development Kit (JDK) 1.8 or later
- Apache Cassandra 3.x or 4.x (depending on user's version)
- Jolokia agent JAR file
Follow these steps to set up Jolokia for monitoring Apache Cassandra:
Download the Jolokia JVM Agent:
Visit the Jolokia official download page to obtain the latest version of the Jolokia JVM agent JAR file. Download the
jolokia-jvm-<jolokia_version>-agent.jarfile.Copy the Jolokia Agent to Cassandra's Library Directory:
Copy the downloaded
jolokia-jvm-<jolokia_version>-agent.jarfile to the Cassandra library directory on the server where Cassandra is installed.For example:
Shell cp jolokia-jvm-<jolokia_version>-agent.jar /path/to/cassandra/lib/Replace
/path/to/cassandra/lib/with the actual path to Cassandra's library directory.Configure Cassandra to use the Jolokia Agent:
Open the
cassandra-env.shfile, located in the Cassandra configuration directory, using a text editor, and add the following line at the bottom of the file:Text JVM_OPTS="$JVM_OPTS -javaagent:/path/to/jolokia-jvm-<jolokia_version>-agent.jar=port=<jolokia_port>,host=0.0.0.0"Replace
/path/to/jolokia-jvm-<version>-agent.jarwith the actual path to the Jolokia agent JAR file copied in Step 2. Save the changes and close thecassandra-env.shfile.Restart Cassandra:
Restart the Apache Cassandra service to apply the changes made to the configuration.
Note:
- Restarting the Apache Cassandra service will temporarily disrupt database connectivity. Ensure that dependent services are designed to handle such interruptions gracefully.
- Immediately after a restart, Cassandra's performance may be impacted due to cold caches and commit log replay. Allow some time for the system to stabilize.
- Before restarting Cassandra, ensure that no cluster maintenance tasks are in progress to prevent any unintended consequences.
- The exact steps will vary based on the installation type, the setup process might differ based on the specific deployment method or environment.
- Procedures for restarting Cassandra may vary based on user's specific setup and configuration.
After restarting Cassandra, user can verify that Jolokia is properly set up by accessing the Jolokia endpoint:
http://<cassandra-host>:<jolokia_port>/jolokia
Replace with the hostname or IP address of user's Cassandra server.
If the setup is successful, user should see a JSON response containing information about the available Jolokia operations and the Cassandra instance.
User can now use Jolokia to monitor and manage Apache Cassandra cluster.
- If
log.flagsappears conflicted under thelogs-*data view, this issue can be resolved by reindexing theLogsdata stream.
Cassandra system logs from cassandra.log files.
Example
{
    "@timestamp": "2024-06-18T06:33:32.952Z",
    "agent": {
        "ephemeral_id": "b1e9fa09-5c73-45d9-b26f-184761635dd9",
        "id": "97400795-188c-4140-a1ee-0002078c785d",
        "name": "docker-fleet-agent",
        "type": "filebeat",
        "version": "8.13.0"
    },
    "data_stream": {
        "dataset": "cassandra.log",
        "namespace": "ep",
        "type": "logs"
    },
    "ecs": {
        "version": "8.11.0"
    },
    "elastic_agent": {
        "id": "97400795-188c-4140-a1ee-0002078c785d",
        "snapshot": false,
        "version": "8.13.0"
    },
    "event": {
        "agent_id_status": "verified",
        "category": [
            "database"
        ],
        "dataset": "cassandra.log",
        "ingested": "2024-06-18T06:34:02Z",
        "kind": "event",
        "module": "cassandra",
        "type": [
            "info"
        ]
    },
    "input": {
        "type": "log"
    },
    "log": {
        "file": {
            "path": "/tmp/service_logs/cassandra/system.log"
        },
        "level": "INFO",
        "offset": 0,
        "origin": {
            "file": {
                "line": 92,
                "name": "YamlConfigurationLoader.java"
            }
        }
    },
    "message": "Configuration location: file:/etc/cassandra/cassandra.yaml",
    "process": {
        "thread": {
            "name": "main"
        }
    },
    "tags": [
        "forwarded",
        "cassandra-systemlogs"
    ]
}
ECS Field Reference
Please refer to the following document for detailed information on ECS fields.
Exported fields
| Field | Description | Type |
|---|---|---|
| @timestamp | Event timestamp. | date |
| cassandra.log.meta | Log meta infos like java stack_trace. | keyword |
| data_stream.dataset | Data stream dataset. | constant_keyword |
| data_stream.namespace | Data stream namespace. | constant_keyword |
| data_stream.type | Data stream type. | constant_keyword |
| input.type | Type of Filebeat input. | keyword |
| log.flags | Flags for the log file. | keyword |
| log.offset | Offset of the entry in the log file. | long |
Cassandra metrics using jolokia agent installed on cassandra.
Example
{
    "@timestamp": "2024-06-18T06:35:01.265Z",
    "agent": {
        "ephemeral_id": "51e65675-8699-4d2e-8c14-ecde813096e9",
        "id": "97400795-188c-4140-a1ee-0002078c785d",
        "name": "docker-fleet-agent",
        "type": "metricbeat",
        "version": "8.13.0"
    },
    "cassandra": {
        "metrics": {
            "cache": {
                "key_cache": {
                    "capacity": 104857600,
                    "one_minute_hit_rate": 0,
                    "requests": {
                        "one_minute_rate": 12
                    }
                },
                "row_cache": {
                    "capacity": 0,
                    "requests": {
                        "one_minute_rate": 0
                    }
                }
            },
            "client": {
                "connected_native_clients": 0
            },
            "client_request": {
                "casread": {
                    "one_minute_rate": 0
                },
                "caswrite": {
                    "one_minute_rate": 0
                },
                "range_slice": {
                    "one_minute_rate": 0,
                    "total_latency": 0
                },
                "read": {
                    "count": 0,
                    "one_minute_rate": 0,
                    "timeouts": 0,
                    "timeoutsms": 0,
                    "total_latency": 0,
                    "unavailables": 0,
                    "unavailablesms": 0
                },
                "write": {
                    "count": 0,
                    "one_minute_rate": 0,
                    "timeouts": 0,
                    "timeoutsms": 0,
                    "total_latency": 0,
                    "unavailables": 0,
                    "unavailablesms": 0
                }
            },
            "column_family": {
                "total_disk_space_used": 72566
            },
            "compaction": {
                "completed": 44,
                "pending": 0
            },
            "dropped_message": {
                "batch_remove": 0,
                "batch_store": 0,
                "counter_mutation": 0,
                "hint": 0,
                "mutation": 0,
                "paged_range": 0,
                "range_slice": 0,
                "read": 0,
                "read_repair": 0,
                "request_response": 0,
                "trace": 0
            },
            "gc": {
                "concurrent_mark_sweep": {
                    "collection_count": 1,
                    "collection_time": 26
                },
                "par_new": {
                    "collection_count": 1,
                    "collection_time": 29
                }
            },
            "memory": {
                "heap_usage": {
                    "committed": 4054777856,
                    "init": 4158652416,
                    "max": 4054777856,
                    "used": 481894272
                },
                "other_usage": {
                    "committed": 62337024,
                    "init": 2555904,
                    "max": -1,
                    "used": 60729840
                }
            },
            "storage": {
                "exceptions": 0,
                "load": 72566,
                "total_hint_in_progress": 0,
                "total_hints": 0
            },
            "system": {
                "cluster": "Test Cluster",
                "data_center": "datacenter1",
                "live_nodes": "192.168.247.2",
                "rack": "rack1",
                "version": "3.11.11"
            },
            "table": {
                "all_memtables_heap_size": 4584,
                "all_memtables_off_heap_size": 0,
                "live_disk_space_used": 72566,
                "live_ss_table_count": 11
            },
            "task": {
                "complete": 55,
                "pending": 0,
                "total_commitlog_size": 67108864
            },
            "thread_pools": {
                "counter_mutation_stage": {
                    "request": {
                        "active": 0,
                        "pending": 0
                    }
                },
                "mutation_stage": {
                    "request": {
                        "active": 0,
                        "pending": 0
                    }
                },
                "read_repair_stage": {
                    "request": {
                        "active": 0,
                        "pending": 0
                    }
                },
                "read_stage": {
                    "request": {
                        "active": 0,
                        "pending": 0
                    }
                },
                "request_response_stage": {
                    "request": {
                        "active": 0,
                        "pending": 0
                    }
                }
            }
        }
    },
    "data_stream": {
        "dataset": "cassandra.metrics",
        "namespace": "ep",
        "type": "metrics"
    },
    "ecs": {
        "version": "8.11.0"
    },
    "elastic_agent": {
        "id": "97400795-188c-4140-a1ee-0002078c785d",
        "snapshot": false,
        "version": "8.13.0"
    },
    "event": {
        "agent_id_status": "verified",
        "category": [
            "database"
        ],
        "created": "2024-06-18T06:35:01.265Z",
        "dataset": "cassandra.metrics",
        "duration": 110507236,
        "ingested": "2024-06-18T06:35:13Z",
        "kind": "event",
        "module": "cassandra",
        "type": [
            "info"
        ]
    },
    "host": {
        "architecture": "x86_64",
        "containerized": true,
        "hostname": "docker-fleet-agent",
        "id": "8259e024976a406e8a54cdbffeb84fec",
        "ip": [
            "192.168.245.7"
        ],
        "mac": [
            "02-42-C0-A8-F5-07"
        ],
        "name": "docker-fleet-agent",
        "os": {
            "codename": "focal",
            "family": "debian",
            "kernel": "3.10.0-1160.102.1.el7.x86_64",
            "name": "Ubuntu",
            "platform": "ubuntu",
            "type": "linux",
            "version": "20.04.6 LTS (Focal Fossa)"
        }
    },
    "metricset": {
        "name": "jmx",
        "period": 10000
    },
    "service": {
        "address": "http://elastic-package-service-cassandra-1:8778/jolokia/%3FignoreErrors=true&canonicalNaming=false",
        "type": "jolokia"
    }
}
ECS Field Reference
Please refer to the following document for detailed information on ECS fields.
Exported fields
| Field | Description | Type | Metric Type |
|---|---|---|---|
| @timestamp | Event timestamp. | date | |
| agent.id | Unique identifier of this agent (if one exists). Example: For Beats this would be beat.id. | keyword | |
| cassandra.metrics.cache.key_cache.capacity | long | gauge | |
| cassandra.metrics.cache.key_cache.one_minute_hit_rate | long | gauge | |
| cassandra.metrics.cache.key_cache.requests.one_minute_rate | long | gauge | |
| cassandra.metrics.cache.row_cache.capacity | long | gauge | |
| cassandra.metrics.cache.row_cache.one_minute_hit_rate | long | gauge | |
| cassandra.metrics.cache.row_cache.requests.one_minute_rate | long | gauge | |
| cassandra.metrics.client.connected_native_clients | long | gauge | |
| cassandra.metrics.client_request.casread.one_minute_rate | double | gauge | |
| cassandra.metrics.client_request.caswrite.one_minute_rate | double | gauge | |
| cassandra.metrics.client_request.range_slice.one_minute_rate | double | gauge | |
| cassandra.metrics.client_request.range_slice.total_latency | double | counter | |
| cassandra.metrics.client_request.read.count | long | counter | |
| cassandra.metrics.client_request.read.one_minute_rate | double | gauge | |
| cassandra.metrics.client_request.read.timeouts | Number of read timeouts encountered. | double | counter |
| cassandra.metrics.client_request.read.timeoutsms | double | gauge | |
| cassandra.metrics.client_request.read.total_latency | double | counter | |
| cassandra.metrics.client_request.read.unavailables | Number of read unavailables encountered. | double | counter |
| cassandra.metrics.client_request.read.unavailablesms | double | gauge | |
| cassandra.metrics.client_request.write.count | long | counter | |
| cassandra.metrics.client_request.write.one_minute_rate | double | gauge | |
| cassandra.metrics.client_request.write.timeouts | double | counter | |
| cassandra.metrics.client_request.write.timeoutsms | double | gauge | |
| cassandra.metrics.client_request.write.total_latency | double | counter | |
| cassandra.metrics.client_request.write.unavailables | double | counter | |
| cassandra.metrics.client_request.write.unavailablesms | double | gauge | |
| cassandra.metrics.column_family.total_disk_space_used | long | gauge | |
| cassandra.metrics.compaction.completed | compaction completed tasks. | long | gauge |
| cassandra.metrics.compaction.pending | compaction pending tasks. | long | gauge |
| cassandra.metrics.dropped_message.batch_remove | long | counter | |
| cassandra.metrics.dropped_message.batch_store | long | counter | |
| cassandra.metrics.dropped_message.counter_mutation | long | counter | |
| cassandra.metrics.dropped_message.hint | long | counter | |
| cassandra.metrics.dropped_message.mutation | long | counter | |
| cassandra.metrics.dropped_message.paged_range | long | counter | |
| cassandra.metrics.dropped_message.range_slice | long | counter | |
| cassandra.metrics.dropped_message.read | long | counter | |
| cassandra.metrics.dropped_message.read_repair | long | counter | |
| cassandra.metrics.dropped_message.request_response | long | counter | |
| cassandra.metrics.dropped_message.trace | long | counter | |
| cassandra.metrics.gc.concurrent_mark_sweep.collection_count | Total number of CMS collections that have occurred. | long | gauge |
| cassandra.metrics.gc.concurrent_mark_sweep.collection_time | Approximate accumulated CMS collection elapsed time in milliseconds. | long | gauge |
| cassandra.metrics.gc.par_new.collection_count | Total number of ParNew collections that have occurred. | long | gauge |
| cassandra.metrics.gc.par_new.collection_time | Approximate accumulated ParNew collection elapsed time in milliseconds. | long | gauge |
| cassandra.metrics.memory.heap_usage.committed | Committed heap memory usage. | long | gauge |
| cassandra.metrics.memory.heap_usage.init | Initial heap memory usage. | long | gauge |
| cassandra.metrics.memory.heap_usage.max | Max heap memory usage. | long | gauge |
| cassandra.metrics.memory.heap_usage.used | Used heap memory usage. | long | gauge |
| cassandra.metrics.memory.other_usage.committed | Committed non-heap memory usage. | long | gauge |
| cassandra.metrics.memory.other_usage.init | Initial non-heap memory usage. | long | gauge |
| cassandra.metrics.memory.other_usage.max | Max non-heap memory usage. | long | gauge |
| cassandra.metrics.memory.other_usage.used | Used non-heap memory usage. | long | gauge |
| cassandra.metrics.storage.exceptions | The number of the total exceptions. | long | counter |
| cassandra.metrics.storage.load | Storage used for Cassandra data in bytes. | long | counter |
| cassandra.metrics.storage.total_hint_in_progress | The number of the total hits in progress. | long | counter |
| cassandra.metrics.storage.total_hints | The number of the total hits. | long | counter |
| cassandra.metrics.system.cluster | keyword | ||
| cassandra.metrics.system.data_center | keyword | ||
| cassandra.metrics.system.joining_nodes | keyword | ||
| cassandra.metrics.system.leaving_nodes | keyword | ||
| cassandra.metrics.system.live_nodes | keyword | ||
| cassandra.metrics.system.moving_nodes | keyword | ||
| cassandra.metrics.system.rack | keyword | ||
| cassandra.metrics.system.unreachable_nodes | keyword | ||
| cassandra.metrics.system.version | keyword | ||
| cassandra.metrics.table.all_memtables_heap_size | long | gauge | |
| cassandra.metrics.table.all_memtables_off_heap_size | long | gauge | |
| cassandra.metrics.table.live_disk_space_used | long | counter | |
| cassandra.metrics.table.live_ss_table_count | long | gauge | |
| cassandra.metrics.task.complete | completed tasks. | long | gauge |
| cassandra.metrics.task.pending | pending tasks. | long | gauge |
| cassandra.metrics.task.total_commitlog_size | total commitlog size of tasks. | long | gauge |
| cassandra.metrics.thread_pools.counter_mutation_stage.request.active | long | gauge | |
| cassandra.metrics.thread_pools.counter_mutation_stage.request.pending | long | gauge | |
| cassandra.metrics.thread_pools.mutation_stage.request.active | long | gauge | |
| cassandra.metrics.thread_pools.mutation_stage.request.pending | long | gauge | |
| cassandra.metrics.thread_pools.read_repair_stage.request.active | long | gauge | |
| cassandra.metrics.thread_pools.read_repair_stage.request.pending | long | gauge | |
| cassandra.metrics.thread_pools.read_stage.request.active | long | gauge | |
| cassandra.metrics.thread_pools.read_stage.request.pending | long | gauge | |
| cassandra.metrics.thread_pools.request_response_stage.request.active | long | gauge | |
| cassandra.metrics.thread_pools.request_response_stage.request.pending | long | gauge | |
| cloud.account.id | The cloud account or organization id used to identify different entities in a multi-tenant environment. Examples: AWS account id, Google Cloud ORG Id, or other unique identifier. | keyword | |
| cloud.availability_zone | Availability zone in which this host, resource, or service is located. | keyword | |
| cloud.instance.id | Instance ID of the host machine. | keyword | |
| cloud.provider | Name of the cloud provider. Example values are aws, azure, gcp, or digitalocean. | keyword | |
| cloud.region | Region in which this host, resource, or service is located. | keyword | |
| container.id | Unique container id. | keyword | |
| data_stream.dataset | Data stream dataset. | constant_keyword | |
| data_stream.namespace | Data stream namespace. | constant_keyword | |
| data_stream.type | Data stream type. | constant_keyword | |
| host.name | Name of the host. It can contain what hostname returns on Unix systems, the fully qualified domain name (FQDN), or a name specified by the user. The recommended value is the lowercase FQDN of the host. | keyword | |
| service.address | Address where data about this service was collected from. This should be a URI, network address (ipv4:port or [ipv6]:port) or a resource path (sockets). | keyword |
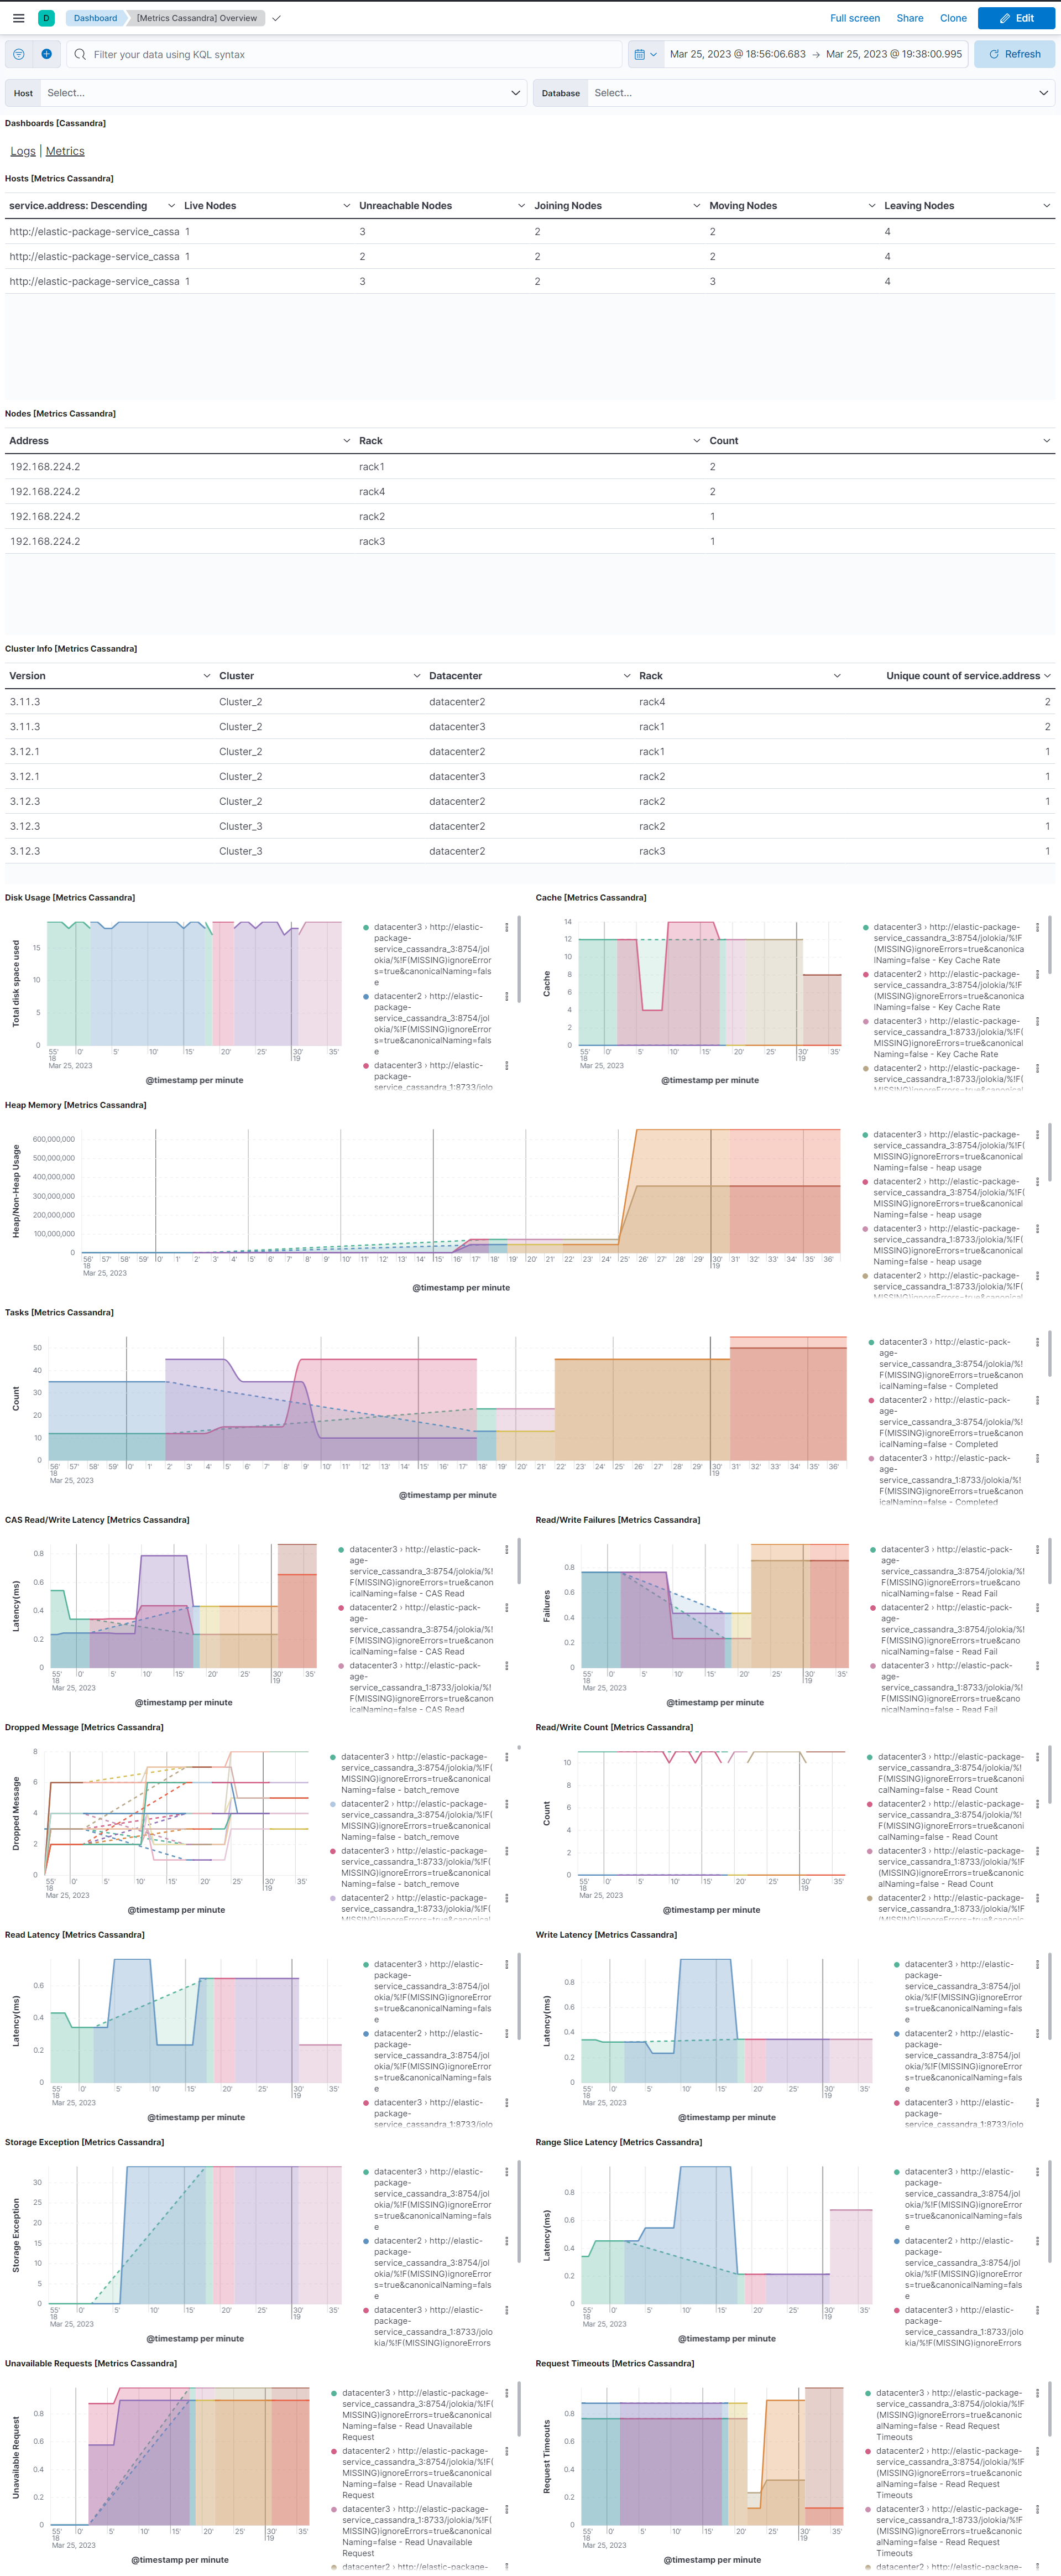
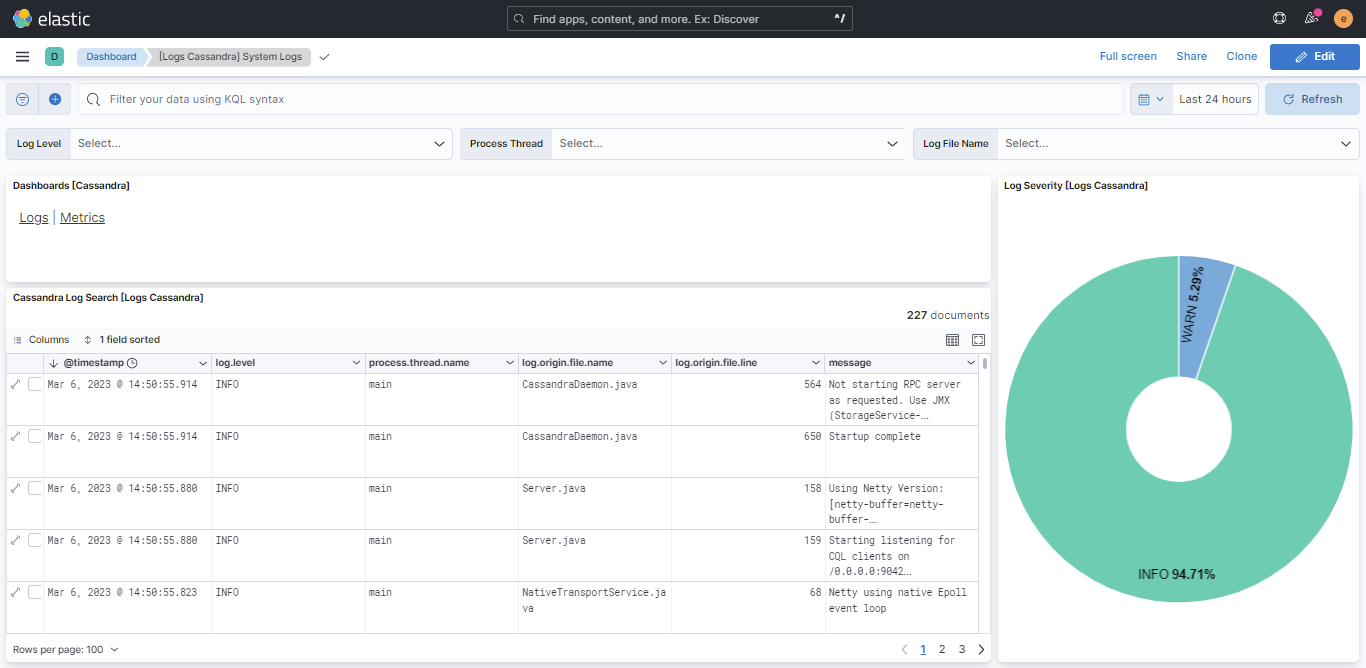
This integration includes one or more Kibana dashboards that visualizes the data collected by the integration. The screenshots below illustrate how the ingested data is displayed.
Changelog
| Version | Details | Minimum Kibana version |
|---|---|---|
| 1.20.0 | Enhancement (View pull request) Improve documentation |
9.0.0 8.13.0 |
| 1.19.0 | Enhancement (View pull request) Use Links panel in dashboard. |
9.0.0 8.13.0 |
| 1.18.0 | Enhancement (View pull request) Add support for Kibana 9.0.0. |
9.0.0 8.13.0 |
| 1.17.0 | Enhancement (View pull request) Allow the usage of deprecated log input and support for stack 9.0 |
8.13.0 |
| 1.16.0 | Enhancement (View pull request) Allow @custom pipeline access to event.original without setting preserve_original_event. |
8.13.0 |
| 1.15.0 | Enhancement (View pull request) Add processor support for metrics data stream. |
8.13.0 |
| 1.14.0 | Enhancement (View pull request) ECS version updated to 8.11.0. Update the kibana constraint to ^8.13.0. Modified the field definitions to remove ECS fields made redundant by the ecs@mappings component template. |
8.13.0 |
| 1.13.0 | Enhancement (View pull request) Add global filter on data_stream.dataset to improve performance. |
8.12.0 |
| 1.12.2 | Enhancement (View pull request) Add documentation for setting up Jolokia to monitor Apache Cassandra. |
8.12.0 |
| 1.12.1 | Enhancement (View pull request) Update README with reindexing steps. |
8.12.0 |
| 1.12.0 | Enhancement (View pull request) Enable secrets for sensitive fields. For more details, refer https://www.elastic.co/guide/en/fleet/current/agent-policy.html#agent-policy-secret-values |
8.12.0 |
| 1.11.1 | Bug fix (View pull request) Disable secrets for older stack versions due to errors. |
8.8.0 |
| 1.11.0 | Enhancement (View pull request) Enable 'secret' for the sensitive fields, supported from 8.12. |
8.8.0 |
| 1.10.1 | Bug fix (View pull request) Update the link to the correct reindexing procedure. |
8.8.0 |
| 1.10.0 | Enhancement (View pull request) Update the package format_version to 3.0.0. |
8.8.0 |
| 1.9.2 | Bug fix (View pull request) Fix the type for log.flags field. |
8.8.0 |
| 1.9.1 | Bug fix (View pull request) Add null check and ignore_missing check to the rename processor |
8.8.0 |
| 1.9.0 | Enhancement (View pull request) Enable time series data streams for the metrics datasets. This dramatically reduces storage for metrics and is expected to progressively improve query performance. For more details, see https://www.elastic.co/guide/en/elasticsearch/reference/current/tsds.html. |
8.8.0 |
| 1.8.1 | Enhancement (View pull request) Add metric_type mapping for the fields of metrics datastream. |
8.3.0 |
| 1.8.0 | Enhancement (View pull request) Add dimension fields for metrics datastream for TSDB enablement. |
8.3.0 |
| 1.7.0 | Enhancement (View pull request) Rename ownership from obs-service-integrations to obs-infraobs-integrations |
8.3.0 |
| 1.6.0 | Enhancement (View pull request) Migrate System Logs dashboard visualizations to lens. |
8.3.0 |
| 1.5.0 | Enhancement (View pull request) Migrate Overview dashboard visualizations to lens. |
8.3.0 |
| 1.4.1 | Enhancement (View pull request) Added categories and/or subcategories. |
8.0.0 7.15.0 |
| 1.4.0 | Enhancement (View pull request) Update ECS version to 8.5.1 |
8.0.0 7.15.0 |
| 1.3.0 | Enhancement (View pull request) Update cassandra package as per best practices. |
8.0.0 7.15.0 |
| 1.2.3 | Bug fix (View pull request) Fix dashboard issues. |
8.0.0 7.15.0 |
| 1.2.2 | Bug fix (View pull request) Fix typo in config template for ignoring host enrichment |
— |
| 1.2.1 | Enhancement (View pull request) Add documentation for multi-fields |
— |
| 1.2.0 | Enhancement (View pull request) Update to ECS 8.0 |
— |
| 1.1.0 | Enhancement (View pull request) Release cassandra package for v8.0.0 |
8.0.0 7.15.0 |
| 1.0.0 | Enhancement (View pull request) GA Release |
— |
| 0.0.1 | Enhancement (View pull request) Initial draft of the package |
— |