Cisco Nexus Integration for Elastic
Elastic Cloud Serverless projects are autoscaled environments, fully managed by Elastic and available on Elastic Cloud. Availability This functionality is generally available and ready for production usage. Elastic Cloud Serverless projects are autoscaled environments, fully managed by Elastic and available on Elastic Cloud. Availability This functionality is generally available and ready for production usage. The Elastic Stack includes Elastic's core products such as Elasticsearch, Kibana, Logstash, and Beats. Availability This functionality is generally available and ready for production usage. Unless stated otherwise on the page, this functionality is available when your Elastic Stack is deployed on Elastic Cloud Hosted, Elastic Cloud Enterprise, Elastic Cloud on Kubernetes, and self-managed environments. This documentation corresponds to the latest patch available for each minor version. If you're not using the latest patch, check the release notes for changes.
Serverless Observability
Generally available
Serverless Security
Generally available
Stack
9.0+
Generally available since 9.0
| Version | 1.8.0 (View all) |
| Subscription level What's this? |
Basic |
| Developed by What's this? |
Elastic |
| Ingestion method(s) | File, Network Protocol |
| Minimum Kibana version(s) | 9.0.0 8.11.0 |
The Cisco Nexus integration for Elastic enables you to collect and parse system messages and error logs from Cisco Nexus series switches running NX-OS. These modular and fixed-port network switches are designed for data center environments, and this integration provides critical visibility into the operational health and security status of your networking infrastructure.
This integration is compatible with the following Cisco Nexus products and operating systems:
- Cisco Nexus series switches: Tested against 9000 Series, 3172T, and 3048 models.
- Cisco NX-OS: Verified against NX-OS Release 6.x and is expected to work with later versions.
- Virtual Routing and Forwarding (VRF): Supports management and default VRF instances for log forwarding.
This integration collects data from your switches by receiving syslog messages over the network using UDP or TCP, or by reading from local log files. You'll deploy an Elastic Agent on a host that's configured as a syslog receiver or has access to the log files. The agent ingests the raw data, parses it into Elastic Common Schema (ECS) fields, and forwards it to your Elastic deployment where you can monitor, search, and visualize it.
The Cisco Nexus integration collects log messages of the following types:
- System messages: High-level operational logs including system start up information, module status, and process events.
- Error logs: Detailed error messages categorized by severity levels 0 through 7, which cover everything from emergency system failures to informational debugging data.
- Configuration events: Logs capturing when you enter configuration mode and any specific changes you've made to the switch running configuration.
Logs are primarily collected in Syslog format using RFC 3164 or RFC 5424.
Integrating Cisco Nexus logs with the Elastic Stack helps you monitor your network infrastructure more effectively. Key use cases include:
- System health monitoring to track module status and system processes.
- Troubleshooting and diagnostics using error logs across all severity levels to resolve issues quickly.
- Audit and compliance by monitoring configuration changes to maintain a record of switch modifications.
- Operational visibility to gain a centralized view of network events and correlate data with other system logs.
Before you can collect data, ensure your environment meets these requirements:
To collect logs from your Cisco Nexus devices, you'll need to ensure:
- You have administrative access with
network-adminor equivalent CLI access to the Cisco Nexus switch using SSH or console. - The switch has a network path to the Elastic Agent. If you're using a management VRF, you'll need to ensure routing is correctly configured.
- Your firewalls permit traffic on the configured port, which defaults to
9506. - You've synchronized switch clocks using NTP to ensure log timestamps are accurate for correlation in Kibana.
- Basic system management features are available, which are typically included in standard NX-OS images.
On the Elastic side, you'll need the following:
- An active Elastic Agent installed and enrolled in Fleet.
- An Elastic Stack deployment running Kibana version
8.11.0or higher. - Connectivity between the Elastic Agent and the Cisco Nexus switch over the designated syslog port using TCP or UDP.
Elastic Agent must be installed on a host that can receive syslog data or has access to the log files from the Cisco Nexus switch. For details on installation, check the Elastic Agent installation instructions. You can install only one Elastic Agent per host.
Elastic Agent is required to stream data from the syslog or log file receiver and ship the data to Elastic, where the events are processed using the integration's ingest pipelines.
You can configure your Cisco Nexus switch to send logs to the Elastic Agent using syslog (UDP or TCP) or by writing messages to a local file.
To configure syslog for UDP or TCP collection, follow these steps:
- Log in to the Cisco Nexus switch CLI using SSH or console.
- Enter global configuration mode:
Shell switch# configure terminal - Set the timestamp granularity to milliseconds:
Shell switch(config)# logging timestamp milliseconds - Configure the remote logging server pointing to the Elastic Agent IP:
- For UDP (Standard):
Shell switch(config)# logging server <ELASTIC_AGENT_IP> 6 use-vrf <vrf_name> - For Secure TCP/TLS (NX-OS 9.2(1) and later):
Shell switch(config)# logging server <ELASTIC_AGENT_IP> 6 port 6514 secure use-vrf <vrf_name>NoteNX-OS does not support standard (unencrypted) TCP syslog. The
securekeyword enables TLS-encrypted syslog on port6514. Ensure SSL is configured on the Elastic Agent TCP input to accept TLS connections, and update the integration's listen port to6514accordingly.
- For UDP (Standard):
- Specify the source interface for syslog traffic:
Shell switch(config)# logging source-interface loopback 0 - Verify the logging configuration:
Shell switch(config)# show logging server - Save the configuration:
Shell switch(config)# copy running-config startup-config
To configure log file collection, follow these steps:
- Log in to the Cisco Nexus switch CLI.
- Configure the switch to write system messages to a local file:
Shell switch# configure terminal switch(config)# logging logfile <FILENAME> <SEVERITY_LEVEL> - Ensure the Elastic Agent has file system access to the directory where the log file is stored.
For more information, refer to the Cisco documentation:
To set up the integration in Kibana, follow these steps:
- In Kibana, navigate to Management > Integrations.
- Search for Cisco Nexus and select the integration.
- Click Add Cisco Nexus.
- Configure the integration by selecting an input type and providing the necessary settings. This integration supports
TCP,UDP, andLog fileinputs.
Choose the setup instructions below that match your configuration:
This input collects logs over a TCP socket. Configure the following settings:
Listen Address(listen_address): The bind address to listen for TCP connections. Set to0.0.0.0to bind to all available interfaces. Default:localhost.Listen Port(listen_port): The TCP port number to listen on. Default:9506.Timezone Map(tz_map): A collection of timezones found in Cisco Nexus logs (as defined in eachtz_short), and the replacement value (as defined in eachtz_long) which should be the full proper IANA Timezone format. This is used to override vendor-provided timezone formats not supported by Elasticsearch Date Processors.Timezone Offset(tz_offset): When interpreting syslog timestamps without a time zone, use this timezone offset. Datetimes recorded in logs are by default interpreted in relation to the timezone set up on the host where the agent is operating.Preserve original event(preserve_original_event): Preserves a raw copy of the original event, added to the fieldevent.original. Default:false.Custom TCP Options(tcp_options): Specify custom configuration options for the TCP input, such asframing,max_message_size, ormax_connections.SSL Configuration(ssl): SSL configuration options for secure transmission. Refer to the SSL documentation for details.Tags(tags): Custom tags to add to the events. Default:['forwarded', 'cisco_nexus-log'].Preserve duplicate custom fields(preserve_duplicate_custom_fields): Preservecisco_nexus.logfields that were copied to Elastic Common Schema (ECS) fields. Default:false.Processors(processors): Processors are used to reduce the number of fields in the exported event or to enhance the event with metadata. Refer to Processors for details.
This input collects logs over a UDP socket. Configure the following settings:
Listen Address(listen_address): The bind address to listen for UDP connections. Set to0.0.0.0to bind to all available interfaces. Default:localhost.Listen Port(listen_port): The UDP port number to listen on. Default:9506.Timezone Map(tz_map): A collection of timezones found in Cisco Nexus logs, and the replacement value which should be the full proper IANA Timezone format.Timezone Offset(tz_offset): When interpreting syslog timestamps without a time zone, use this timezone offset.Preserve original event(preserve_original_event): Preserves a raw copy of the original event inevent.original. Default:false.Custom UDP Options(udp_options): Specify custom configuration options for the UDP input, such asmax_message_sizeandtimeout.Tags(tags): Custom tags to add to the events. Default:['forwarded', 'cisco_nexus-log'].Preserve duplicate custom fields(preserve_duplicate_custom_fields): Preservecisco_nexus.logfields that were copied to ECS fields. Default:false.Processors(processors): Processors used for agent-side filtering and metadata enhancement. Refer to Processors for details.
This input collects logs directly from files using the filestream input. Configure the following settings:
Paths(paths): A list of glob-based file paths to monitor.Timezone Map(tz_map): A collection of timezones found in Cisco Nexus logs, and the replacement value which should be the full proper IANA Timezone format.Timezone Offset(tz_offset): When interpreting syslog timestamps without a time zone, use this timezone offset.Preserve original event(preserve_original_event): Preserves a raw copy of the original event inevent.original. Default:false.Tags(tags): Custom tags to add to the events. Default:['forwarded', 'cisco_nexus-log'].Preserve duplicate custom fields(preserve_duplicate_custom_fields): Preservecisco_nexus.logfields that were copied to ECS fields. Default:false.Processors(processors): Define agent-side processing rules. Refer to Processors for details.
After configuring the input, click Save and continue to deploy the integration.
To verify that the integration is working and data is flowing, follow these steps:
- Trigger data flow on the Cisco Nexus device using one of the following methods:
- Configuration event: Enter and exit global configuration mode by running
configure terminalfollowed byexitto generate aSYS-5-CONFIG_Ilog message. - Interface event: Perform a
shutdownandno shutdowncommand on a test interface (for example,interface Ethernet1/1) to generate interface status change logs. - Authentication event: Log out of the current SSH session and log back in to generate an AAA/User login message.
- Configuration event: Enter and exit global configuration mode by running
- In Kibana, navigate to Analytics > Discover.
- Select the
logs-*data view. - Enter the following KQL filter in the search bar:
data_stream.dataset : "cisco_nexus.log" - Verify that logs appear in the results with recent timestamps. Expand a log entry and confirm the presence of these fields:
event.dataset(should becisco_nexus.log)source.ip(should match the management IP of the Nexus switch)event.code(the NX-OS mnemonic, for example,VSHD_SYSLOG_CONFIG_IorIF_UP)message(the raw log payload)
- Navigate to Analytics > Dashboards and search for "Cisco Nexus" to view the pre-built dashboards and confirm visualization of the events.
For help with Elastic ingest tools, check the Common problems documentation.
You can resolve common connectivity and parsing issues by following these troubleshooting steps:
- No data is being collected:
- Verify that the port specified in the integration (default
9506) isn't being used by another service on the Elastic Agent host. You can check for active listeners on Linux using a command likenetstat -ano | grep 9506. - Confirm that local firewalls on the Elastic Agent host, such as
iptablesorfirewalld, and network access control lists (ACLs) allow traffic on the configured TCP or UDP port. - Ensure the Cisco Nexus switch has a valid network path to the Elastic Agent IP address.
- Verify that the port specified in the integration (default
- Virtual Routing and Forwarding (VRF) configuration issues:
- On Cisco Nexus switches, logging often occurs over a specific VRF instance, such as the
managementVRF. If the switch can't reach the agent, ensure you've specified the correct VRF in the logging command. - Update the logging command on the switch to include the VRF, for example:
logging server <ELASTIC_AGENT_IP> 6 use-vrf management.
- On Cisco Nexus switches, logging often occurs over a specific VRF instance, such as the
- TCP connection failures:
- NX-OS doesn't support standard unencrypted TCP syslog. The
securekeyword is required on the switch to enable TLS-encrypted syslog, which typically uses port6514. - If you're using TCP, ensure you have configured SSL/TLS settings in the integration and that the switch is configured with the
secureparameter:logging server <ELASTIC_AGENT_IP> 6 port 6514 secure use-vrf <vrf_name>.
- NX-OS doesn't support standard unencrypted TCP syslog. The
- Timestamp and timezone parsing errors:
- If events appear with the wrong time or fail to parse, verify that the switch is configured for millisecond precision using the command
logging timestamp milliseconds. - Check the switch's system time and NTP synchronization settings.
- Use the
Timezone OffsetorTimezone Mapparameters in the integration settings to align the switch's local time with the Elastic Stack.
- If events appear with the wrong time or fail to parse, verify that the switch is configured for millisecond precision using the command
- Ingestion and field mapping errors:
- Check the
error.messagefield in Kibana Discover for specific details about parsing failures. - Verify the switch is using the standard NX-OS logging format, as custom log formats might not be compatible with the integration's processors.
- Avoid forwarding debug-level logs (level 7) unless necessary, as these can vary significantly in format and volume, potentially causing mapping issues.
- Check the
For more information about configuring and troubleshooting Cisco Nexus logging, refer to the following vendor documentation:
- Cisco Nexus 9000 Series NX-OS System Management Configuration Guide - Configuring System Message Logging
- Cisco Nexus Series Switches Support Home
- Cisco NX-OS System Message Guides
For more information on architectures that can be used for scaling this integration, check the Ingest Architectures documentation.
To ensure optimal performance in high-volume data center environments, you should consider the following configuration and deployment factors:
- While UDP's faster for syslog transmission, you should use TCP for Cisco Nexus logs in environments where you need delivery guarantees. TCP ensures you don't lose log messages due to network congestion, though it introduces slightly higher overhead on the switch's control plane.
- Configure your Cisco Nexus appliance to forward only necessary events by setting the
logging levelat the source. It's recommended to use level5(Notifications) or level6(Informational) for production monitoring. You should avoid forwarding debug-level logs (level7) unless you're troubleshooting specific issues, as they can significantly increase CPU load on the switch and ingest volume in the Elastic Stack. - For high-throughput environments with hundreds of switches, you can deploy multiple Elastic Agents behind a network load balancer to distribute the
logdata stream traffic evenly across instances. Place your agents close to the data source within the same management VRF to minimize latency and potential packet loss.
These inputs can be used with this integration:
filestream
For more details about the Filestream input settings, check the Filebeat documentation.
To collect logs via Filestream, select Collect logs via Filestream and configure the following parameters:
- Filestream paths: The full path to the related log file.
tcp
For more details about the TCP input settings, check the Filebeat documentation.
To collect logs via TCP, select Collect logs via TCP and configure the following parameters:
Required Settings:
- Host
- Port
Common Optional Settings:
- Max Message Size - Maximum size of incoming messages
- Max Connections - Maximum number of concurrent connections
- Timeout - How long to wait for data before closing idle connections
- Line Delimiter - Character(s) that separate log messages
To enable encrypted connections, configure the following SSL settings:
SSL Settings:
- Enable SSL - Toggle to enable SSL/TLS encryption
- Certificate - Path to the SSL certificate file (
.crtor.pem) - Certificate Key - Path to the private key file (
.key) - Certificate Authorities - Path to CA certificate file for client certificate validation (optional)
- Client Authentication - Require client certificates (
none,optional, orrequired) - Supported Protocols - TLS versions to support (e.g.,
TLSv1.2,TLSv1.3)
Example SSL Configuration:
ssl.enabled: true
ssl.certificate: "/path/to/server.crt"
ssl.key: "/path/to/server.key"
ssl.certificate_authorities: ["/path/to/ca.crt"]
ssl.client_authentication: "optional"
udp
For more details about the UDP input settings, check the Filebeat documentation.
To collect logs via UDP, select Collect logs via UDP and configure the following parameters:
Required Settings:
- Host
- Port
Common Optional Settings:
- Max Message Size - Maximum size of UDP packets to accept (default: 10KB, max: 64KB)
- Read Buffer - UDP socket read buffer size for handling bursts of messages
- Read Timeout - How long to wait for incoming packets before checking for shutdown
The Cisco Nexus integration includes the following data stream:
The log data stream collects system messages and operational logs from Cisco Nexus switches. These logs provide information about device status, configuration changes, interface states, and other network events handled by the NX-OS software.
The following fields are exported by this data stream:
Exported fields
| Field | Description | Type |
|---|---|---|
| @timestamp | Event timestamp. | date |
| cisco_nexus.log.command | keyword | |
| cisco_nexus.log.description | keyword | |
| cisco_nexus.log.euid | keyword | |
| cisco_nexus.log.facility | keyword | |
| cisco_nexus.log.interface.mode | keyword | |
| cisco_nexus.log.interface.name | keyword | |
| cisco_nexus.log.ip_address | ip | |
| cisco_nexus.log.line_protocol_state | keyword | |
| cisco_nexus.log.logname | keyword | |
| cisco_nexus.log.network.egress_interface | keyword | |
| cisco_nexus.log.network.ingress_interface | keyword | |
| cisco_nexus.log.operating_value | keyword | |
| cisco_nexus.log.operational.duplex_mode | keyword | |
| cisco_nexus.log.operational.receive_flow_control_state | keyword | |
| cisco_nexus.log.operational.speed | keyword | |
| cisco_nexus.log.operational.transmit_flow_control_state | keyword | |
| cisco_nexus.log.priority_number | long | |
| cisco_nexus.log.pwd | keyword | |
| cisco_nexus.log.rhost | keyword | |
| cisco_nexus.log.ruser | keyword | |
| cisco_nexus.log.sequence_number | long | |
| cisco_nexus.log.severity | long | |
| cisco_nexus.log.slot_number | long | |
| cisco_nexus.log.standby | keyword | |
| cisco_nexus.log.state | keyword | |
| cisco_nexus.log.switch_name | keyword | |
| cisco_nexus.log.syslog_time | date | |
| cisco_nexus.log.terminal | keyword | |
| cisco_nexus.log.threshold_value | keyword | |
| cisco_nexus.log.time | date | |
| cisco_nexus.log.timezone | keyword | |
| cisco_nexus.log.tty | keyword | |
| cisco_nexus.log.type | keyword | |
| cisco_nexus.log.uid | keyword | |
| data_stream.dataset | Data stream dataset. | constant_keyword |
| data_stream.namespace | Data stream namespace. | constant_keyword |
| data_stream.type | Data stream type. | constant_keyword |
| event.action | The action captured by the event. This describes the information in the event. It is more specific than event.category. Examples are group-add, process-started, file-created. The value is normally defined by the implementer. |
keyword |
| event.category | This is one of four ECS Categorization Fields, and indicates the second level in the ECS category hierarchy. event.category represents the "big buckets" of ECS categories. For example, filtering on event.category:process yields all events relating to process activity. This field is closely related to event.type, which is used as a subcategory. This field is an array. This will allow proper categorization of some events that fall in multiple categories. |
keyword |
| event.code | Identification code for this event, if one exists. Some event sources use event codes to identify messages unambiguously, regardless of message language or wording adjustments over time. An example of this is the Windows Event ID. | keyword |
| event.dataset | Event dataset. | constant_keyword |
| event.kind | This is one of four ECS Categorization Fields, and indicates the highest level in the ECS category hierarchy. event.kind gives high-level information about what type of information the event contains, without being specific to the contents of the event. For example, values of this field distinguish alert events from metric events. The value of this field can be used to inform how these kinds of events should be handled. They may warrant different retention, different access control, it may also help understand whether the data is coming in at a regular interval or not. |
keyword |
| event.module | Event module. | constant_keyword |
| event.original | Raw text message of entire event. Used to demonstrate log integrity or where the full log message (before splitting it up in multiple parts) may be required, e.g. for reindex. This field is not indexed and doc_values are disabled. It cannot be searched, but it can be retrieved from _source. If users wish to override this and index this field, please see Field data types in the Elasticsearch Reference. |
keyword |
| event.outcome | This is one of four ECS Categorization Fields, and indicates the lowest level in the ECS category hierarchy. event.outcome simply denotes whether the event represents a success or a failure from the perspective of the entity that produced the event. Note that when a single transaction is described in multiple events, each event may populate different values of event.outcome, according to their perspective. Also note that in the case of a compound event (a single event that contains multiple logical events), this field should be populated with the value that best captures the overall success or failure from the perspective of the event producer. Further note that not all events will have an associated outcome. For example, this field is generally not populated for metric events, events with event.type:info, or any events for which an outcome does not make logical sense. |
keyword |
| event.sequence | Sequence number of the event. The sequence number is a value published by some event sources, to make the exact ordering of events unambiguous, regardless of the timestamp precision. | long |
| event.severity | The numeric severity of the event according to your event source. What the different severity values mean can be different between sources and use cases. It's up to the implementer to make sure severities are consistent across events from the same source. The Syslog severity belongs in log.syslog.severity.code. event.severity is meant to represent the severity according to the event source (e.g. firewall, IDS). If the event source does not publish its own severity, you may optionally copy the log.syslog.severity.code to event.severity. |
long |
| event.timezone | This field should be populated when the event's timestamp does not include timezone information already (e.g. default Syslog timestamps). It's optional otherwise. Acceptable timezone formats are: a canonical ID (e.g. "Europe/Amsterdam"), abbreviated (e.g. "EST") or an HH:mm differential (e.g. "-05:00"). | keyword |
| event.type | This is one of four ECS Categorization Fields, and indicates the third level in the ECS category hierarchy. event.type represents a categorization "sub-bucket" that, when used along with the event.category field values, enables filtering events down to a level appropriate for single visualization. This field is an array. This will allow proper categorization of some events that fall in multiple event types. |
keyword |
| host.hostname | Hostname of the host. It normally contains what the hostname command returns on the host machine. |
keyword |
| input.type | Type of Filebeat input. | keyword |
| log.file.device_id | ID of the device containing the filesystem where the file resides. | keyword |
| log.file.fingerprint | The sha256 fingerprint identity of the file when fingerprinting is enabled. | keyword |
| log.file.idxhi | The high-order part of a unique identifier that is associated with a file. (Windows-only) | keyword |
| log.file.idxlo | The low-order part of a unique identifier that is associated with a file. (Windows-only) | keyword |
| log.file.inode | Inode number of the log file. | keyword |
| log.file.vol | The serial number of the volume that contains a file. (Windows-only) | keyword |
| log.level | Original log level of the log event. If the source of the event provides a log level or textual severity, this is the one that goes in log.level. If your source doesn't specify one, you may put your event transport's severity here (e.g. Syslog severity). Some examples are warn, err, i, informational. |
keyword |
| log.offset | Log offset. | long |
| log.source.address | Source address from which the log event was read / sent from. | keyword |
| log.syslog.facility.code | The Syslog numeric facility of the log event, if available. According to RFCs 5424 and 3164, this value should be an integer between 0 and 23. | long |
| log.syslog.priority | Syslog numeric priority of the event, if available. According to RFCs 5424 and 3164, the priority is 8 * facility + severity. This number is therefore expected to contain a value between 0 and 191. | long |
| log.syslog.severity.code | The Syslog numeric severity of the log event, if available. If the event source publishing via Syslog provides a different numeric severity value (e.g. firewall, IDS), your source's numeric severity should go to event.severity. If the event source does not specify a distinct severity, you can optionally copy the Syslog severity to event.severity. |
long |
| message | For log events the message field contains the log message, optimized for viewing in a log viewer. For structured logs without an original message field, other fields can be concatenated to form a human-readable summary of the event. If multiple messages exist, they can be combined into one message. | match_only_text |
| network.protocol | In the OSI Model this would be the Application Layer protocol. For example, http, dns, or ssh. The field value must be normalized to lowercase for querying. |
keyword |
| observer.ip | IP addresses of the observer. | ip |
| observer.name | Custom name of the observer. This is a name that can be given to an observer. This can be helpful for example if multiple firewalls of the same model are used in an organization. If no custom name is needed, the field can be left empty. | keyword |
| observer.product | The product name of the observer. | keyword |
| observer.type | The type of the observer the data is coming from. There is no predefined list of observer types. Some examples are forwarder, firewall, ids, ips, proxy, poller, sensor, APM server. |
keyword |
| observer.vendor | Vendor name of the observer. | keyword |
| process.pid | Process id. | long |
| related.ip | All of the IPs seen on your event. | ip |
| related.user | All the user names or other user identifiers seen on the event. | keyword |
| source.ip | IP address of the source (IPv4 or IPv6). | ip |
| source.mac | MAC address of the source. The notation format from RFC 7042 is suggested: Each octet (that is, 8-bit byte) is represented by two [uppercase] hexadecimal digits giving the value of the octet as an unsigned integer. Successive octets are separated by a hyphen. | keyword |
| source.port | Port of the source. | long |
| tags | User defined tags. | keyword |
| user.name | Short name or login of the user. | keyword |
| user.name.text | Multi-field of user.name. |
match_only_text |
A sample event for this data stream is as follows:
Example
{
    "@timestamp": "2023-04-26T09:08:48.000Z",
    "agent": {
        "ephemeral_id": "859a182d-25f0-4bff-8d64-bbe7d1c1c2b9",
        "id": "d9d5eaa8-aac8-45a1-a54d-ea6891eb16e2",
        "name": "elastic-agent-82566",
        "type": "filebeat",
        "version": "9.3.3"
    },
    "cisco_nexus": {
        "log": {
            "description": "last message repeated 3 time",
            "priority_number": 187,
            "switch_name": "switchname",
            "time": "2023-04-26T09:08:48.000Z",
            "timezone": "UTC"
        }
    },
    "data_stream": {
        "dataset": "cisco_nexus.log",
        "namespace": "98346",
        "type": "logs"
    },
    "ecs": {
        "version": "8.17.0"
    },
    "elastic_agent": {
        "id": "d9d5eaa8-aac8-45a1-a54d-ea6891eb16e2",
        "snapshot": false,
        "version": "9.3.3"
    },
    "event": {
        "agent_id_status": "verified",
        "dataset": "cisco_nexus.log",
        "ingested": "2026-05-21T14:51:59Z",
        "kind": "event",
        "module": "cisco_nexus",
        "original": "<187>switchname: 2023 Apr 26 09:08:48 UTC: last message repeated 3 time",
        "timezone": "UTC"
    },
    "host": {
        "hostname": "switchname"
    },
    "input": {
        "type": "tcp"
    },
    "log": {
        "source": {
            "address": "172.22.0.3:40564"
        },
        "syslog": {
            "priority": 187
        }
    },
    "message": "last message repeated 3 time",
    "observer": {
        "name": "switchname",
        "product": "Nexus",
        "type": "switches",
        "vendor": "Cisco"
    },
    "related": {
        "hosts": [
            "switchname"
        ]
    },
    "tags": [
        "preserve_original_event",
        "preserve_duplicate_custom_fields",
        "forwarded",
        "cisco_nexus-log"
    ]
}
You can find more information about Cisco Nexus logs and system messages in the following resources:
- Cisco Nexus Series Switches Support Home
- Cisco NX-OS System Message Guides
- Configuring System Message Logging
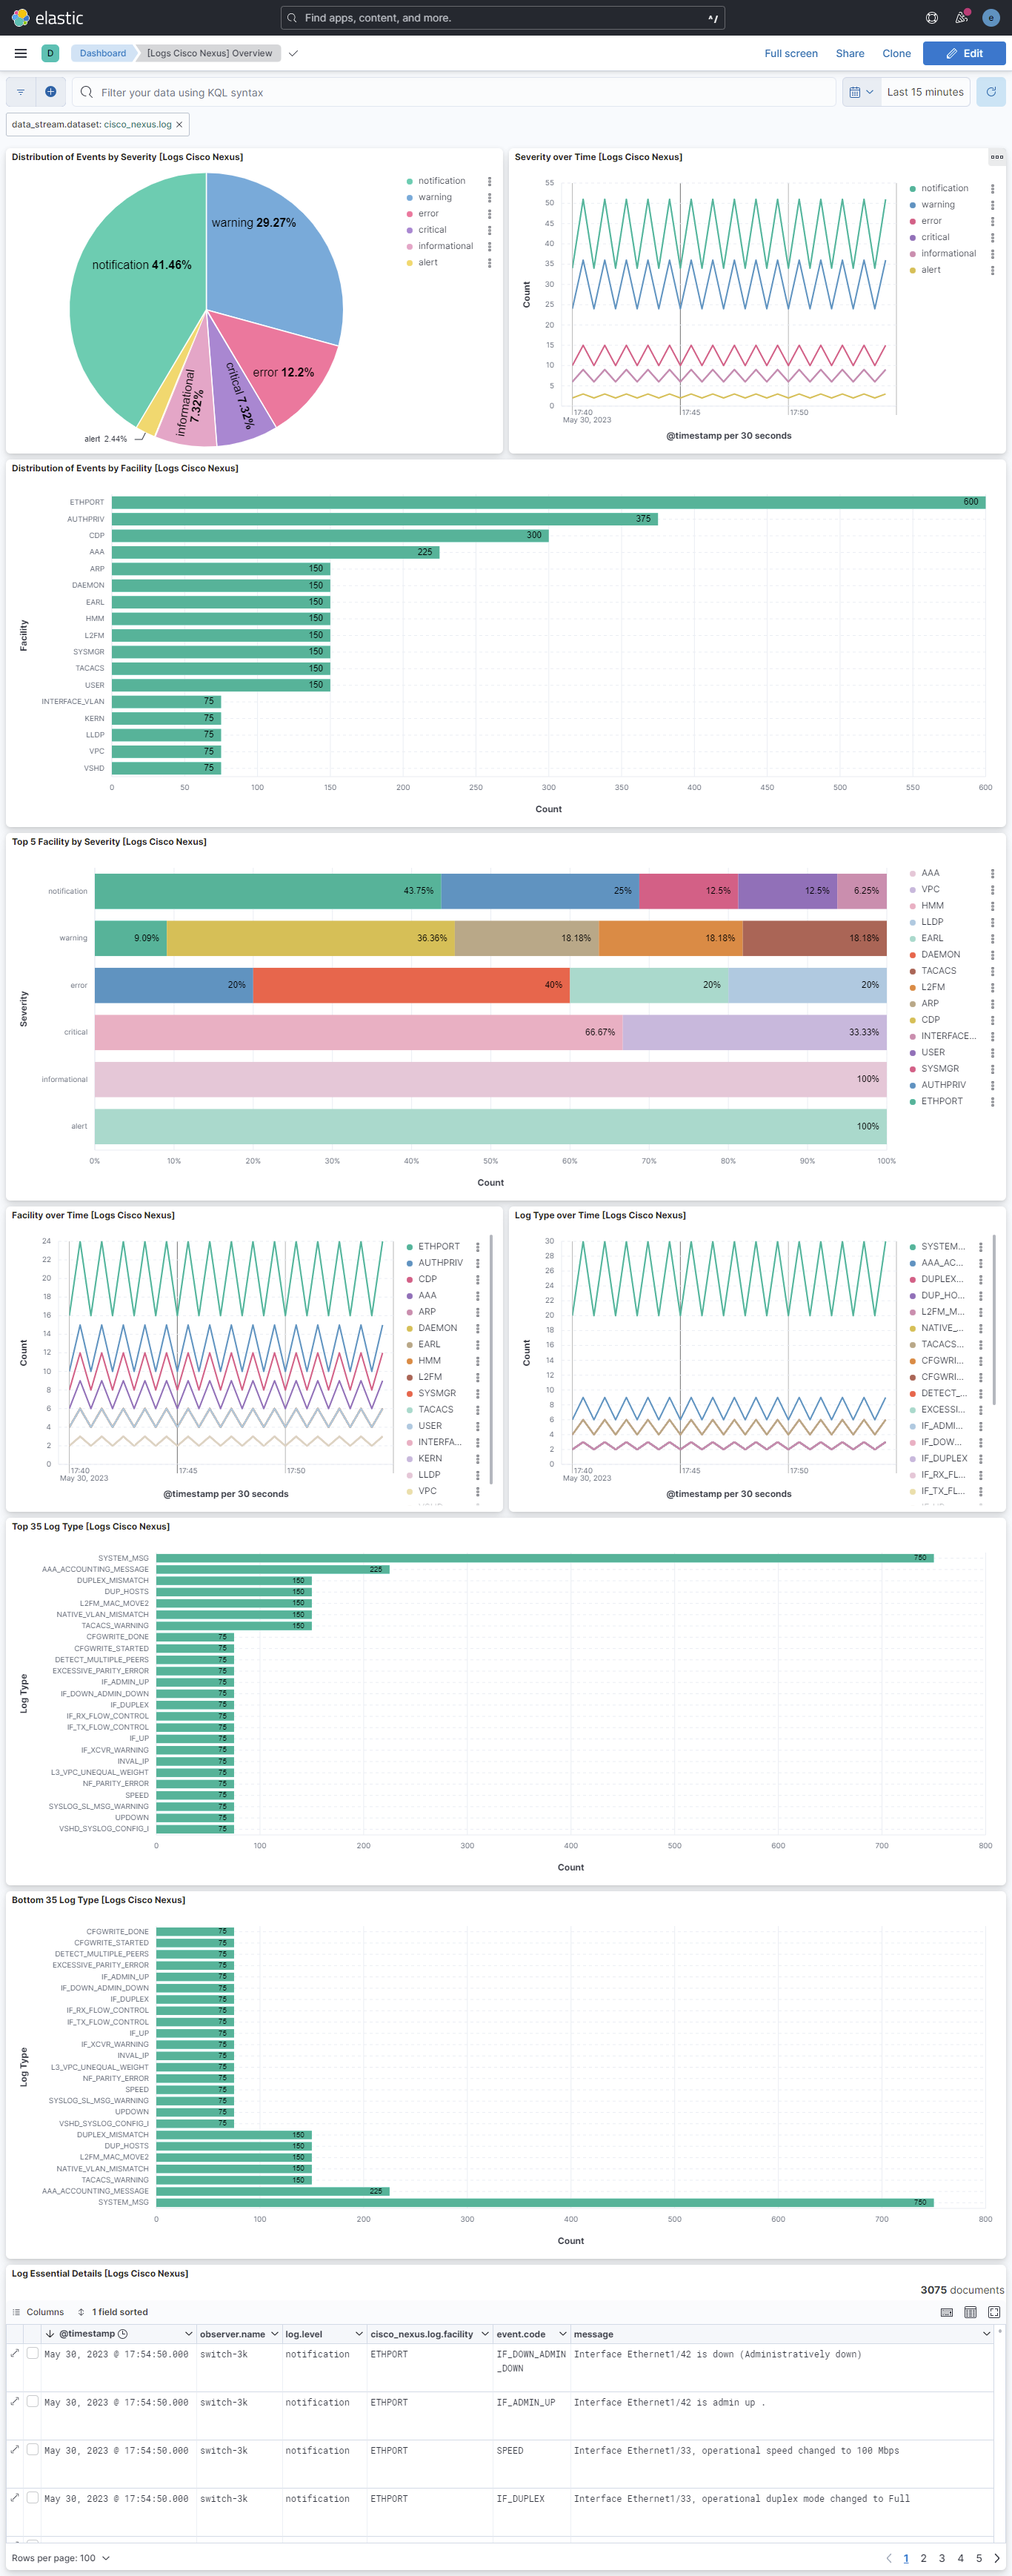
This integration includes one or more Kibana dashboards that visualizes the data collected by the integration. The screenshots below illustrate how the ingested data is displayed.
Changelog
| Version | Details | Minimum Kibana version |
|---|---|---|
| 1.8.0 | Enhancement (View pull request) Changed owners. |
9.0.0 8.11.0 |
| 1.7.0 | Enhancement (View pull request) Add ECS event.action, host.hostname, and fill event.category/type/outcome gaps for all event codes. |
9.0.0 8.11.0 |
| 1.6.1 | Bug fix (View pull request) Remove top level note from docs |
9.0.0 8.11.0 |
| 1.6.0 | Enhancement (View pull request) Update documentation for the integration. |
9.0.0 8.11.0 |
| 1.5.0 | Enhancement (View pull request) Preserve event.original on pipeline error. |
9.0.0 8.11.0 |
| 1.4.4 | Enhancement (View pull request) Generate processor tags and normalize error handler. |
9.0.0 8.11.0 |
| 1.4.3 | Bug fix (View pull request) Fix whitespace issue with grok pattern. |
9.0.0 8.11.0 |
| 1.4.2 | Enhancement (View pull request) Changed owners. |
9.0.0 8.11.0 |
| 1.4.1 | Bug fix (View pull request) Fix bug that did not recognize timestamps to use tz_map override. |
9.0.0 8.11.0 |
| 1.4.0 | Enhancement (View pull request) Support stack version 9.0. |
9.0.0 8.11.0 |
| 1.3.1 | Bug fix (View pull request) Updated SSL description to be uniform and to include links to documentation. |
8.11.0 |
| 1.3.0 | Enhancement (View pull request) ECS version updated to 8.17.0. |
8.11.0 |
| 1.2.0 | Enhancement (View pull request) Allow @custom pipeline access to event.original without setting preserve_original_event. |
8.11.0 |
| 1.1.1 | Bug fix (View pull request) Fix ingest pipeline warnings |
8.7.0 |
| 1.1.0 | Enhancement (View pull request) Update package spec to 3.0.3. |
8.7.0 |
| 1.0.1 | Enhancement (View pull request) Changed owners |
8.7.0 |
| 1.0.0 | Enhancement (View pull request) Release package as GA. |
8.7.0 |
| 0.21.1 | Bug fix (View pull request) Fix exclude_files pattern. |
8.7.0 |
| 0.21.0 | Enhancement (View pull request) ECS version updated to 8.11.0. |
8.7.0 |
| 0.20.0 | Enhancement (View pull request) Improve 'event.original' check to avoid errors if set. |
8.7.0 |
| 0.19.0 | Enhancement (View pull request) Adapt fields for changes in file system info |
8.7.0 |
| 0.18.0 | Enhancement (View pull request) ECS version updated to 8.10.0. |
8.7.0 |
| 0.17.0 | Enhancement (View pull request) The format_version in the package manifest changed from 2.11.0 to 3.0.0. Removed dotted YAML keys from package manifest. Added 'owner.type: elastic' to package manifest. |
8.7.0 |
| 0.16.0 | Enhancement (View pull request) Add tags.yml file so that integration's dashboards and saved searches are tagged with "Security Solution" and displayed in the Security Solution UI. |
8.7.0 |
| 0.15.0 | Enhancement (View pull request) Update package to ECS 8.9.0. |
8.7.0 |
| 0.14.2 | Bug fix (View pull request) Remove confusing error message tag prefix. |
8.7.0 |
| 0.14.1 | Enhancement (View pull request) Add support for new log format. |
8.7.0 |
| 0.14.0 | Enhancement (View pull request) Ensure event.kind is correctly set for pipeline errors. |
8.7.0 |
| 0.13.0 | Enhancement (View pull request) Replace RSA2ELK with Syslog integration. |
8.7.0 |
| 0.12.0 | Enhancement (View pull request) Update package to ECS 8.8.0. |
8.0.0 7.16.0 |
| 0.11.0 | Enhancement (View pull request) Update package-spec version to 2.7.0. |
8.0.0 7.16.0 |
| 0.10.0 | Enhancement (View pull request) Update package to ECS 8.7.0. |
— |
| 0.9.0 | Enhancement (View pull request) Update package to ECS 8.6.0. |
— |
| 0.8.0 | Enhancement (View pull request) Update package to ECS 8.5.0. |
— |
| 0.7.3 | Bug fix (View pull request) Remove duplicate fields. |
— |
| 0.7.2 | Bug fix (View pull request) Remove duplicate field. |
— |
| 0.7.1 | Enhancement (View pull request) Use ECS geo.location definition. |
— |
| 0.7.0 | Enhancement (View pull request) Update package to ECS 8.4.0 |
— |
| 0.6.0 | Enhancement (View pull request) Update package to ECS 8.3.0. |
— |
| 0.5.1 | Enhancement (View pull request) Updated readme file |
— |
| 0.5.0 | Enhancement (View pull request) Update to ECS 8.2.0 |
— |
| 0.4.1 | Enhancement (View pull request) Add documentation for multi-fields |
— |
| 0.4.0 | Enhancement (View pull request) Update to ECS 8.0.0 |
— |
| 0.3.1 | Bug fix (View pull request) Regenerate test files using the new GeoIP database |
— |
| 0.3.0 | Enhancement (View pull request) Add 8.0.0 version constraint |
— |
| 0.2.3 | Enhancement (View pull request) Update Title and Description. |
— |
| 0.2.2 | Bug fix (View pull request) Fixed a bug that prevents the package from working in 7.16. |
— |
| 0.2.1 | Bug fix (View pull request) Fix logic that checks for the 'forwarded' tag |
— |
| 0.2.0 | Enhancement (View pull request) Update to ECS 1.12.0 |
— |
| 0.1.0 | Enhancement (View pull request) Initial implementation for splitting Cisco nexus from Cisco package |
— |