Keeper Security Integration
Elastic Cloud Serverless projects are autoscaled environments, fully managed by Elastic and available on Elastic Cloud. Availability This functionality is in technical preview and is ready for evaluation. Use with caution in production; it is not recommended for mission-critical workloads. Elastic will work to fix any issues, but features in technical preview are not subject to the support SLA of official GA features. Specific Support terms apply. Elastic Cloud Serverless projects are autoscaled environments, fully managed by Elastic and available on Elastic Cloud. Availability This functionality is in technical preview and is ready for evaluation. Use with caution in production; it is not recommended for mission-critical workloads. Elastic will work to fix any issues, but features in technical preview are not subject to the support SLA of official GA features. Specific Support terms apply. The Elastic Stack includes Elastic's core products such as Elasticsearch, Kibana, Logstash, and Beats. Availability This functionality is in technical preview and is ready for evaluation. Use with caution in production; it is not recommended for mission-critical workloads. Elastic will work to fix any issues, but features in technical preview are not subject to the support SLA of official GA features. Specific Support terms apply. Unless stated otherwise on the page, this functionality is available when your Elastic Stack is deployed on Elastic Cloud Hosted, Elastic Cloud Enterprise, Elastic Cloud on Kubernetes, and self-managed environments. This documentation corresponds to the latest patch available for each minor version. If you're not using the latest patch, check the release notes for changes.
Serverless Observability
Preview
Preview
Serverless Security
Preview
Preview
Stack
Preview
9.1+
Preview since 9.1
| Version | 0.2.0 Availability Preview This functionality is in technical preview and is ready for evaluation. Use with caution in production; it is not recommended for mission-critical workloads. Elastic will work to fix any issues, but features in technical preview are not subject to the support SLA of official GA features. Specific Support terms apply. (View all) |
| Subscription level What's this? |
Basic |
| Developed by What's this? |
Partner |
| Minimum Kibana version(s) | 9.1.0 8.19.0 |
To use pre-release integrations, go to the Integrations page in Kibana, scroll down, and toggle on the Display beta integrations option.
The Keeper Security integration provides truly agentless data collection by allowing Keeper to push audit events directly to Elasticsearch via the Bulk API. This integration enables seamless monitoring and analysis of Keeper Security platform activities without requiring any Elastic Agent installation.
This integration is compatible with:
- Keeper Security Enterprise Platform (all versions that support audit event streaming)
- Elasticsearch 8.0+ with Bulk API access
- Kibana 9.0+ for dashboard visualization
- Self-managed and Elastic Cloud deployments
The Keeper Security integration uses a direct push architecture where:
- Keeper Security Platform generates audit events for user activities and administrative actions
- Direct API Push: Keeper pushes events directly to Elasticsearch using the Bulk API
- Ingest Pipeline: Events are processed through the
logs-keeper.audit-1.0.0ingest pipeline - ECS Mapping: Data is automatically mapped to Elastic Common Schema (ECS) fields
- Index Storage: Processed events are stored in
logs-keeper.audit-*indices - Visualization: Pre-built dashboards provide immediate insights into Keeper activities
This architecture provides real-time event processing with minimal latency and eliminates the need for intermediate collection agents.
The Keeper Security integration collects comprehensive audit events including:
- Authentication Events: Two-factor authentication changes, login activities
- Security Actions: Master password changes, security policy modifications
- Administrative Operations: User management, role assignments, policy updates
- Record Access: Password retrievals, file access, sharing activities
- Enterprise Management: Organization settings, compliance actions
- Security Monitoring: Track unauthorized access attempts and security policy violations
- Compliance Reporting: Generate audit trails for regulatory requirements (SOX, HIPAA, PCI-DSS)
- User Activity Analysis: Monitor user behavior patterns and identify anomalies
- Incident Response: Investigate security incidents with detailed audit trails
- Risk Assessment: Analyze access patterns and identify potential security risks
- Elasticsearch Cluster: Self-managed (8.0+) or Elastic Cloud deployment
- Kibana Access: Version 9.0+ for dashboard and configuration management
- API Permissions: Ability to create API keys with index write privileges
- GeoIP Database: Recommended for IP geolocation enrichment
- Keeper Enterprise Account: Active enterprise subscription
- Administrative Access: Enterprise admin privileges to configure audit streaming
- Network Connectivity: Outbound HTTPS access from Keeper to your Elasticsearch cluster
- API Integration: Keeper platform configured for external audit streaming
For complete deployment instructions, refer to the Observability Getting Started guide for foundational setup steps.
1. Install Integration Assets
In Kibana:
- Navigate to Management > Integrations
- Search for "Keeper Security"
- Click Add Keeper Security
- Click Install assets only (no agent policy needed)
- Confirm installation
This installs:
- Index templates for
logs-keeper.audit-* - Ingest pipeline
logs-keeper.audit-1.0.0 - Pre-built dashboards and visualizations
- Field mappings and ECS compliance
2. Create API Key
In Kibana Dev Tools, execute:
POST /_security/api_key
{
  "name": "keeper-integration",
  "expiration": "365d",
  "role_descriptors": {
    "keeper-writer": {
      "cluster": ["monitor"],
      "indices": [
        {
          "names": ["logs-keeper.audit-*"],
          "privileges": ["auto_configure", "create_doc"]
        }
      ]
    }
  }
}
Copy the Base64 encoded API key for Keeper configuration.
3. Enable GeoIP Enrichment (Recommended)
Enable GeoIP database for IP geolocation:
PUT /_cluster/settings
{
  "persistent": {
    "ingest.geoip.downloader.enabled": true,
    "ingest.geoip.downloader.poll.interval": "3d"
  }
}
4. Configure Keeper Security Platform
Contact your Keeper Security administrator to:
- Configure audit event streaming to your Elasticsearch endpoint
- Provide the API key and endpoint URL (
https://YOUR_HOST/logs-keeper.audit-1.0.0/_bulk) - Verify network connectivity between Keeper and Elasticsearch
Test API Endpoint:
curl --location 'https://YOUR_HOST/logs-keeper.audit-1.0.0/_bulk' \
--header 'Authorization: ApiKey YOUR_API_KEY' \
--header 'Content-Type: application/x-ndjson' \
--data-raw '{"create":{}}
{"test_event":"validation_test"}
'
Verify Data Ingestion:
- Go to Discover in Kibana
- Select index pattern:
logs-keeper.audit-* - Verify events appear with proper ECS field mapping
Check Dashboard:
- Navigate to Analytics > Dashboard
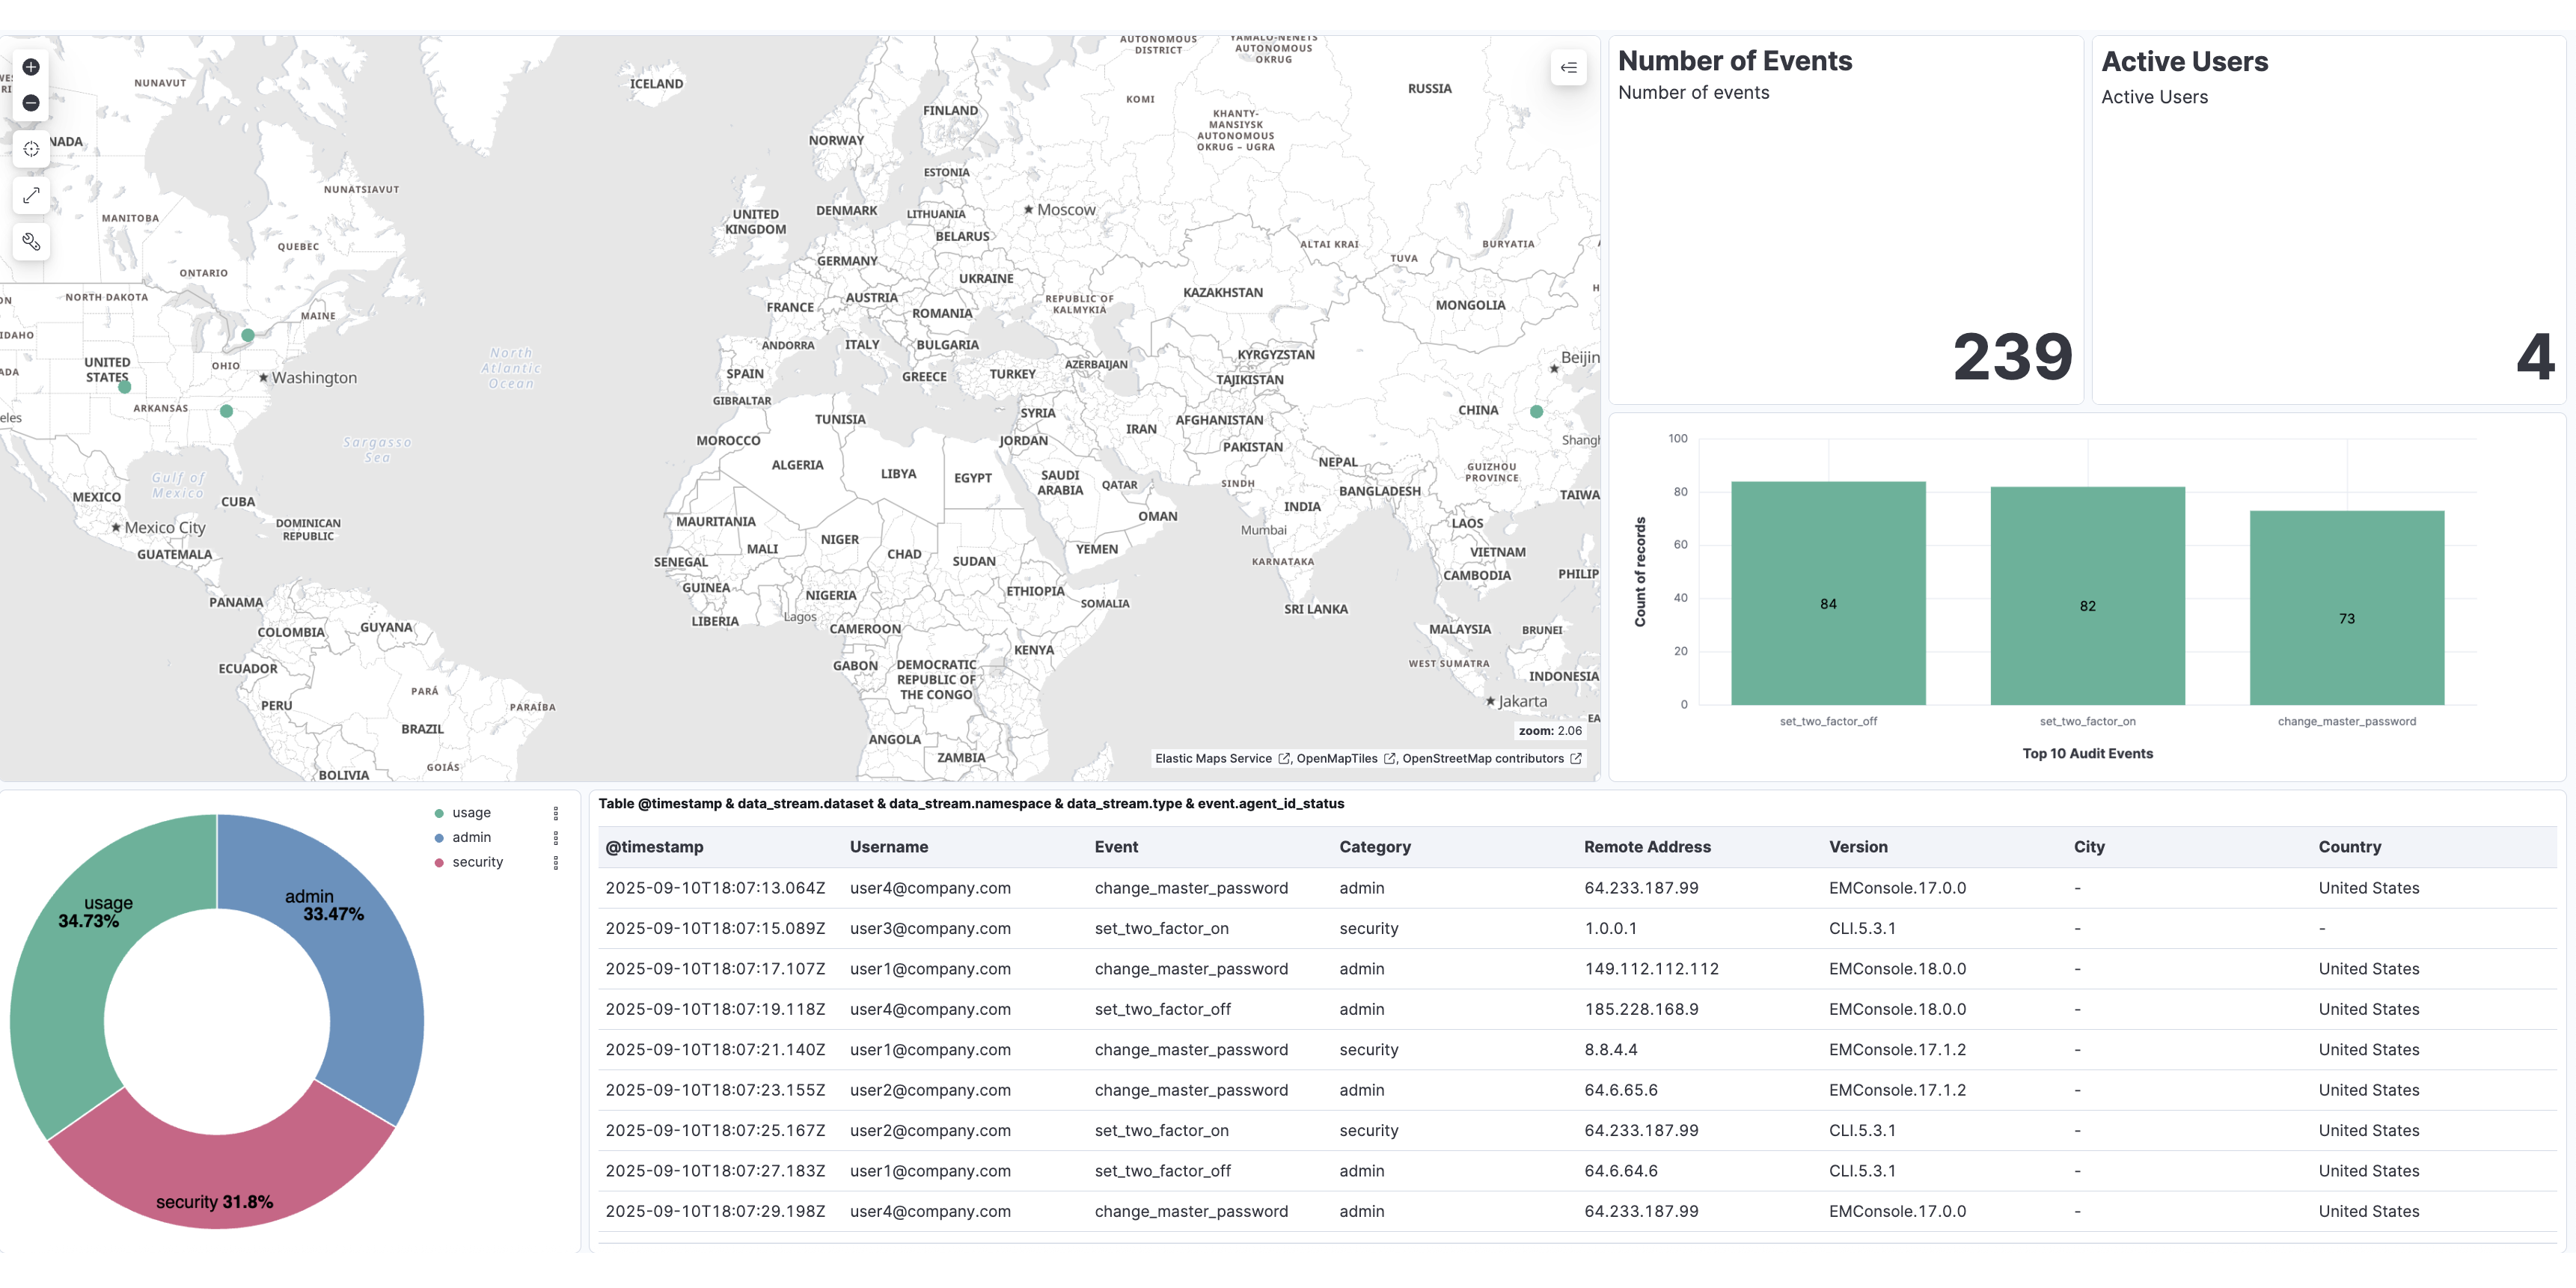
- Open "Keeper SIEM Integration - Dashboard"
- Confirm visualizations populate with incoming data
No Data Appearing
- Verify API key permissions using the test curl command
- Check Keeper Security platform audit streaming configuration
- Confirm network connectivity between Keeper and Elasticsearch
- Review Elasticsearch logs for ingestion errors
Missing GeoIP Data
- Verify GeoIP downloader is enabled:
GET /_ingest/geoip/stats - Check that public IP addresses are being processed (private IPs won't have geo data)
- Allow time for GeoIP database download (initial setup can take several minutes)
Field Mapping Issues
- Ensure integration assets were installed properly
- Verify ingest pipeline
logs-keeper.audit-1.0.0exists:GET /_ingest/pipeline/logs-keeper.audit-1.0.0 - Check index template mapping:
GET /_index_template/logs-keeper.audit
Dashboard Not Loading
- Confirm Kibana version compatibility (9.0+)
- Verify integration installation completed successfully
- Check that data is present in the
logs-keeper.audit-*indices
For additional troubleshooting, consult the Elastic Security documentation and Keeper Security platform documentation.
Single Instance Deployment:
- Suitable for small to medium enterprises (<1000 events/hour)
- Single Elasticsearch node with adequate storage
- Basic monitoring and alerting
High-Volume Deployment:
- Recommended for large enterprises (>1000 events/hour)
- Multi-node Elasticsearch cluster with dedicated data nodes
- Index lifecycle management (ILM) for automated data retention
- Monitoring with dedicated monitoring cluster
Event Volume: Keeper audit events are typically low-volume but burst during peak activity periods. Plan for 10x normal volume during security incidents or mass administrative actions.
Storage Planning: Each audit event averages 1-2KB after processing. Estimate storage needs based on retention requirements and event frequency.
Index Management: Implement ILM policies to automatically manage index size and retention:
PUT /_ilm/policy/keeper-audit-policy
{
  "policy": {
    "phases": {
      "hot": {
        "actions": {
          "rollover": {
            "max_size": "10GB",
            "max_age": "30d"
          }
        }
      },
      "warm": {
        "min_age": "30d",
        "actions": {
          "allocate": {
            "number_of_replicas": 0
          }
        }
      },
      "delete": {
        "min_age": "365d"
      }
    }
  }
}
The Keeper Security integration processes audit events from the Keeper Security platform and maps them to ECS-compliant fields for analysis and visualization.
Example
{
    "@timestamp": "2025-09-26T15:13:31.915Z",
    "audit_event": "change_master_password",
    "category": "security",
    "client_version": "CLI.5.3.1",
    "data_stream": {
        "dataset": "keeper.audit",
        "namespace": "default",
        "type": "logs"
    },
    "ecs": {
        "version": "8.17.0"
    },
    "enterprise_id": 1666,
    "event": {
        "action": "change_master_password",
        "category": [
            "authentication",
            "web"
        ],
        "dataset": "keeper.audit",
        "kind": "event",
        "module": "keeper",
        "outcome": "success",
        "type": [
            "access",
            "info"
        ]
    },
    "organization": {
        "id": "1666"
    },
    "related": {
        "ip": [
            "203.0.113.10"
        ],
        "user": [
            "user1@example.com"
        ]
    },
    "remote_address": "203.0.113.10",
    "source": {
        "geo": {
            "city_name": "Madrid",
            "continent_name": "Europe",
            "country_iso_code": "ES",
            "country_name": "Spain",
            "location": {
                "lat": 40.41639,
                "lon": -3.7025
            },
            "region_iso_code": "ES-M",
            "region_name": "Madrid"
        },
        "ip": "203.0.113.10"
    },
    "user": {
        "email": "user1@example.com",
        "name": "user1@example.com"
    },
    "user_agent": {
        "original": "Keeper/CLI.5.3.1"
    },
    "username": "user1@example.com"
}
Exported fields
| Field | Description | Type |
|---|---|---|
| @timestamp | Date/time when the event originated. This is the date/time extracted from the event, typically representing when the event was generated by the source. If the event source has no original timestamp, this value is typically populated by the first time the event was received by the pipeline. Required field for all events. | date |
| audit_event | Type of audit event performed | keyword |
| category | Category of the audit event | keyword |
| client_version | Version of the Keeper client used | keyword |
| data_stream.dataset | The field can contain anything that makes sense to signify the source of the data. Examples include nginx.access, prometheus, endpoint etc. For data streams that otherwise fit, but that do not have dataset set we use the value "generic" for the dataset value. event.dataset should have the same value as data_stream.dataset. Beyond the Elasticsearch data stream naming criteria noted above, the dataset value has additional restrictions: * Must not contain - * No longer than 100 characters |
constant_keyword |
| data_stream.namespace | A user defined namespace. Namespaces are useful to allow grouping of data. Many users already organize their indices this way, and the data stream naming scheme now provides this best practice as a default. Many users will populate this field with default. If no value is used, it falls back to default. Beyond the Elasticsearch index naming criteria noted above, namespace value has the additional restrictions: * Must not contain - * No longer than 100 characters |
constant_keyword |
| data_stream.type | An overarching type for the data stream. Currently allowed values are "logs" and "metrics". We expect to also add "traces" and "synthetics" in the near future. | constant_keyword |
| enterprise_id | Enterprise identifier | long |
| event.dataset | Name of the dataset. If an event source publishes more than one type of log or events (e.g. access log, error log), the dataset is used to specify which one the event comes from. It's recommended but not required to start the dataset name with the module name, followed by a dot, then the dataset name. | constant_keyword |
| event.module | Name of the module this data is coming from. If your monitoring agent supports the concept of modules or plugins to process events of a given source (e.g. Apache logs), event.module should contain the name of this module. |
constant_keyword |
| organization.id | Organization identifier | keyword |
| organization.name | Organization name | constant_keyword |
| related.ip | Related IP addresses | ip |
| related.user | Related usernames | keyword |
| remote_address | IP address from which the action was performed | ip |
| source.geo.city_name | City name. | keyword |
| source.geo.continent_name | Name of the continent. | keyword |
| source.geo.country_iso_code | Country ISO code. | keyword |
| source.geo.country_name | Country name. | keyword |
| source.geo.location | Longitude/latitude (for maps & geo queries). | geo_point |
| source.geo.region_iso_code | Region ISO code. | keyword |
| source.geo.region_name | Region/state/province name. | keyword |
| source.geo.timezone | Time zone. | keyword |
| source.ip | Source IP address | ip |
| timestamp | Timestamp of the audit event | date |
| user.email | User email address | keyword |
| user.name | Username | keyword |
| user_agent.original | Original user agent string | keyword |
| username | Username that performed the action | keyword |
This integration uses the following APIs:
- Elasticsearch Bulk API: For direct event ingestion
- Elasticsearch Index Templates API: For field mapping configuration
- Elasticsearch Ingest Pipeline API: For event processing and enrichment
- Keeper Security Audit Streaming API: For event delivery (configured on Keeper side)
The integration uses the logs-keeper.audit-1.0.0 ingest pipeline which:
- Maps Keeper-specific fields to ECS schema
- Enriches IP addresses with geographic information (when GeoIP is enabled)
- Processes timestamps and ensures proper field types
- Adds correlation fields for security analysis
Currently, no machine learning modules are included with this integration. Custom ML jobs can be created to detect:
- Anomalous authentication patterns
- Unusual access times or locations
- Bulk administrative actions
- Suspicious user behavior patterns
Refer to the CHANGELOG.md for version history and updates.
This integration includes one or more Kibana dashboards that visualizes the data collected by the integration. The screenshots below illustrate how the ingested data is displayed.
Changelog
| Version | Details | Minimum Kibana version |
|---|---|---|
| 0.2.0 | Enhancement (View pull request) Add tags to ingest pipeline processors. |
9.1.0 8.19.0 |
| 0.1.0 | Enhancement (View pull request) Initial release of Keeper Security agentless integration |
9.1.0 8.19.0 |