Elastic Agent Integration
Elastic Cloud Serverless projects are autoscaled environments, fully managed by Elastic and available on Elastic Cloud. Availability This functionality is generally available and ready for production usage. Elastic Cloud Serverless projects are autoscaled environments, fully managed by Elastic and available on Elastic Cloud. Availability This functionality is generally available and ready for production usage. The Elastic Stack includes Elastic's core products such as Elasticsearch, Kibana, Logstash, and Beats. Availability This functionality is generally available and ready for production usage. Unless stated otherwise on the page, this functionality is available when your Elastic Stack is deployed on Elastic Cloud Hosted, Elastic Cloud Enterprise, Elastic Cloud on Kubernetes, and self-managed environments. This documentation corresponds to the latest patch available for each minor version. If you're not using the latest patch, check the release notes for changes.
Serverless Observability
Generally available
Serverless Security
Generally available
Stack
9.0+
Generally available since 9.0
| Version | 2.9.6 (View all) |
| Subscription level What's this? |
Basic |
| Developed by What's this? |
Elastic |
| Minimum Kibana version(s) | 9.0.0 8.15.0 |
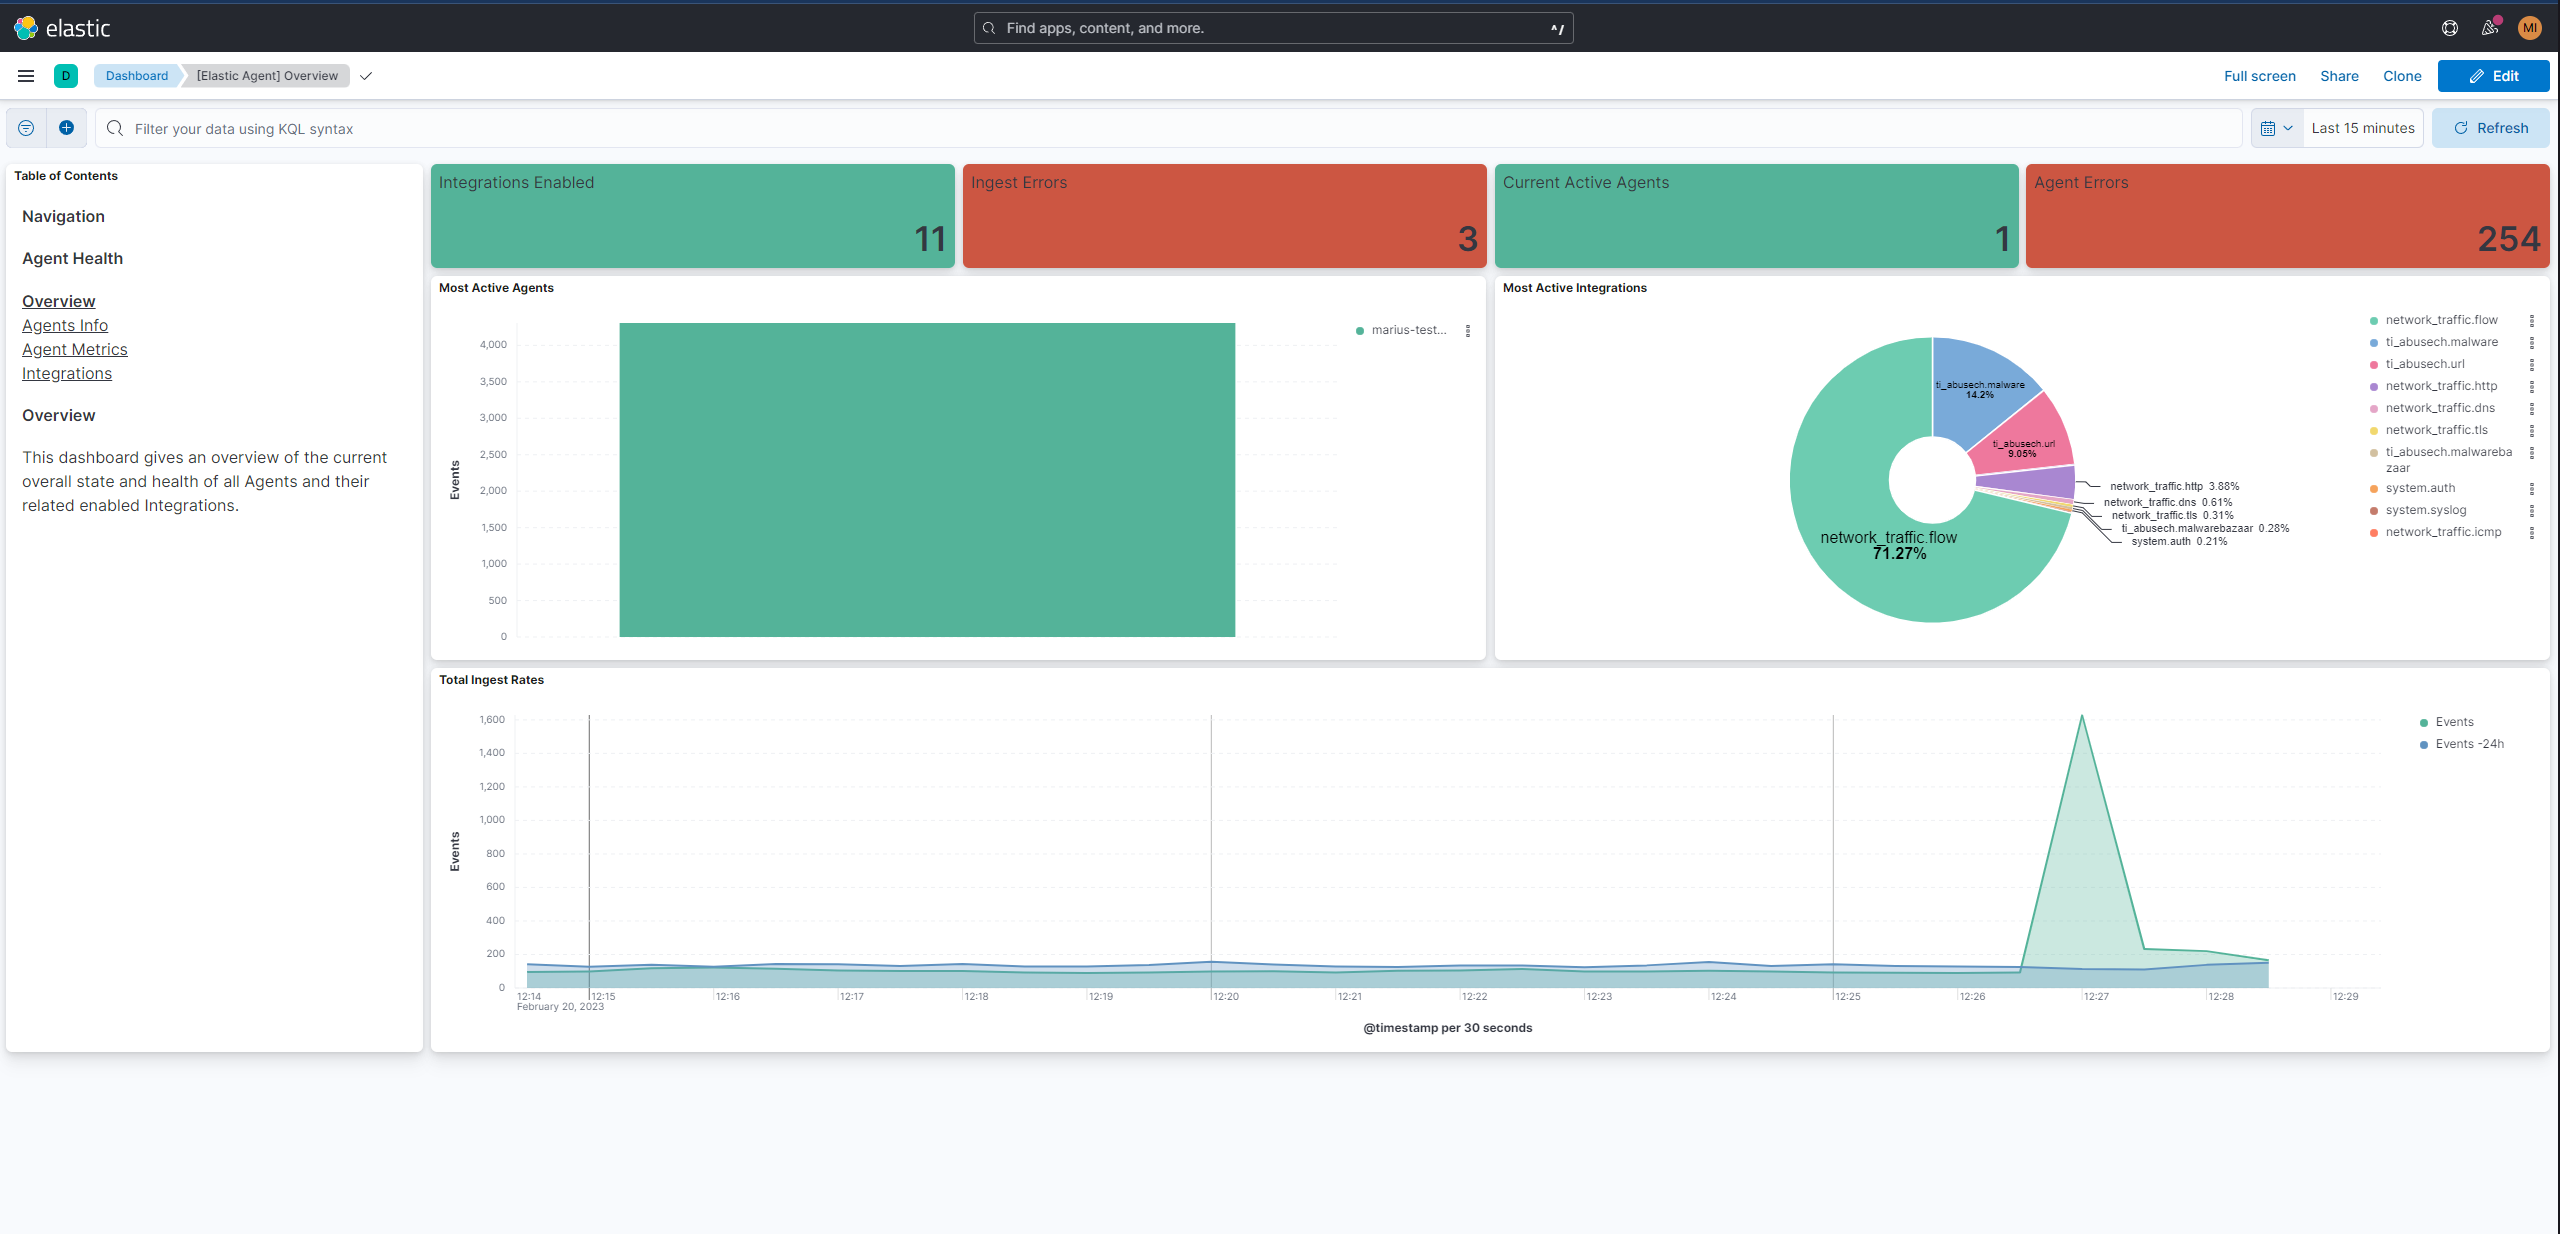
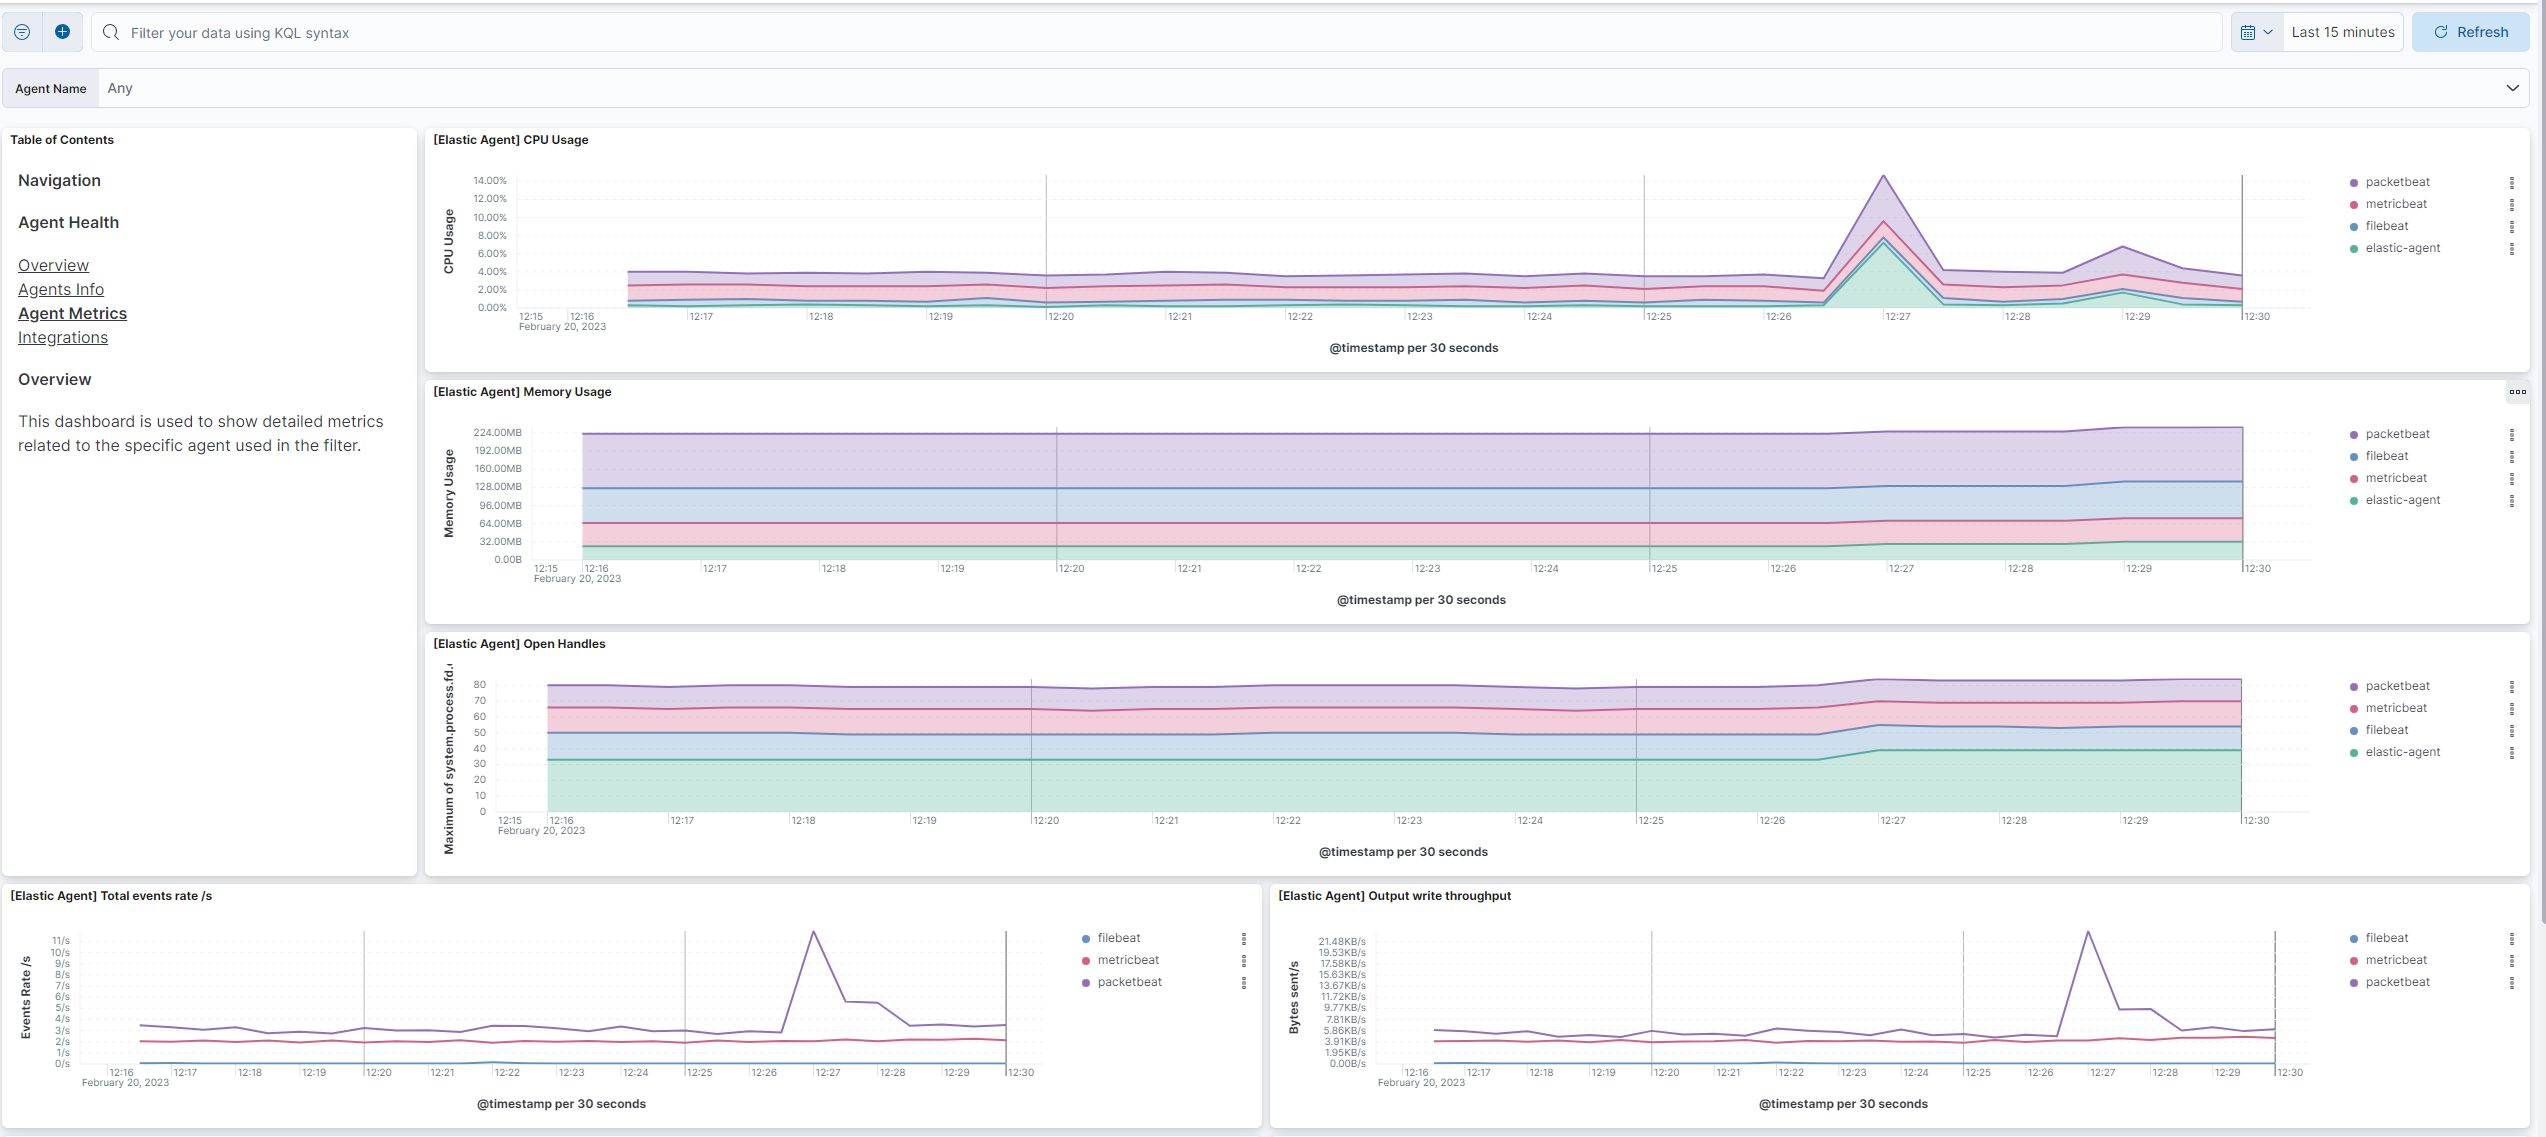
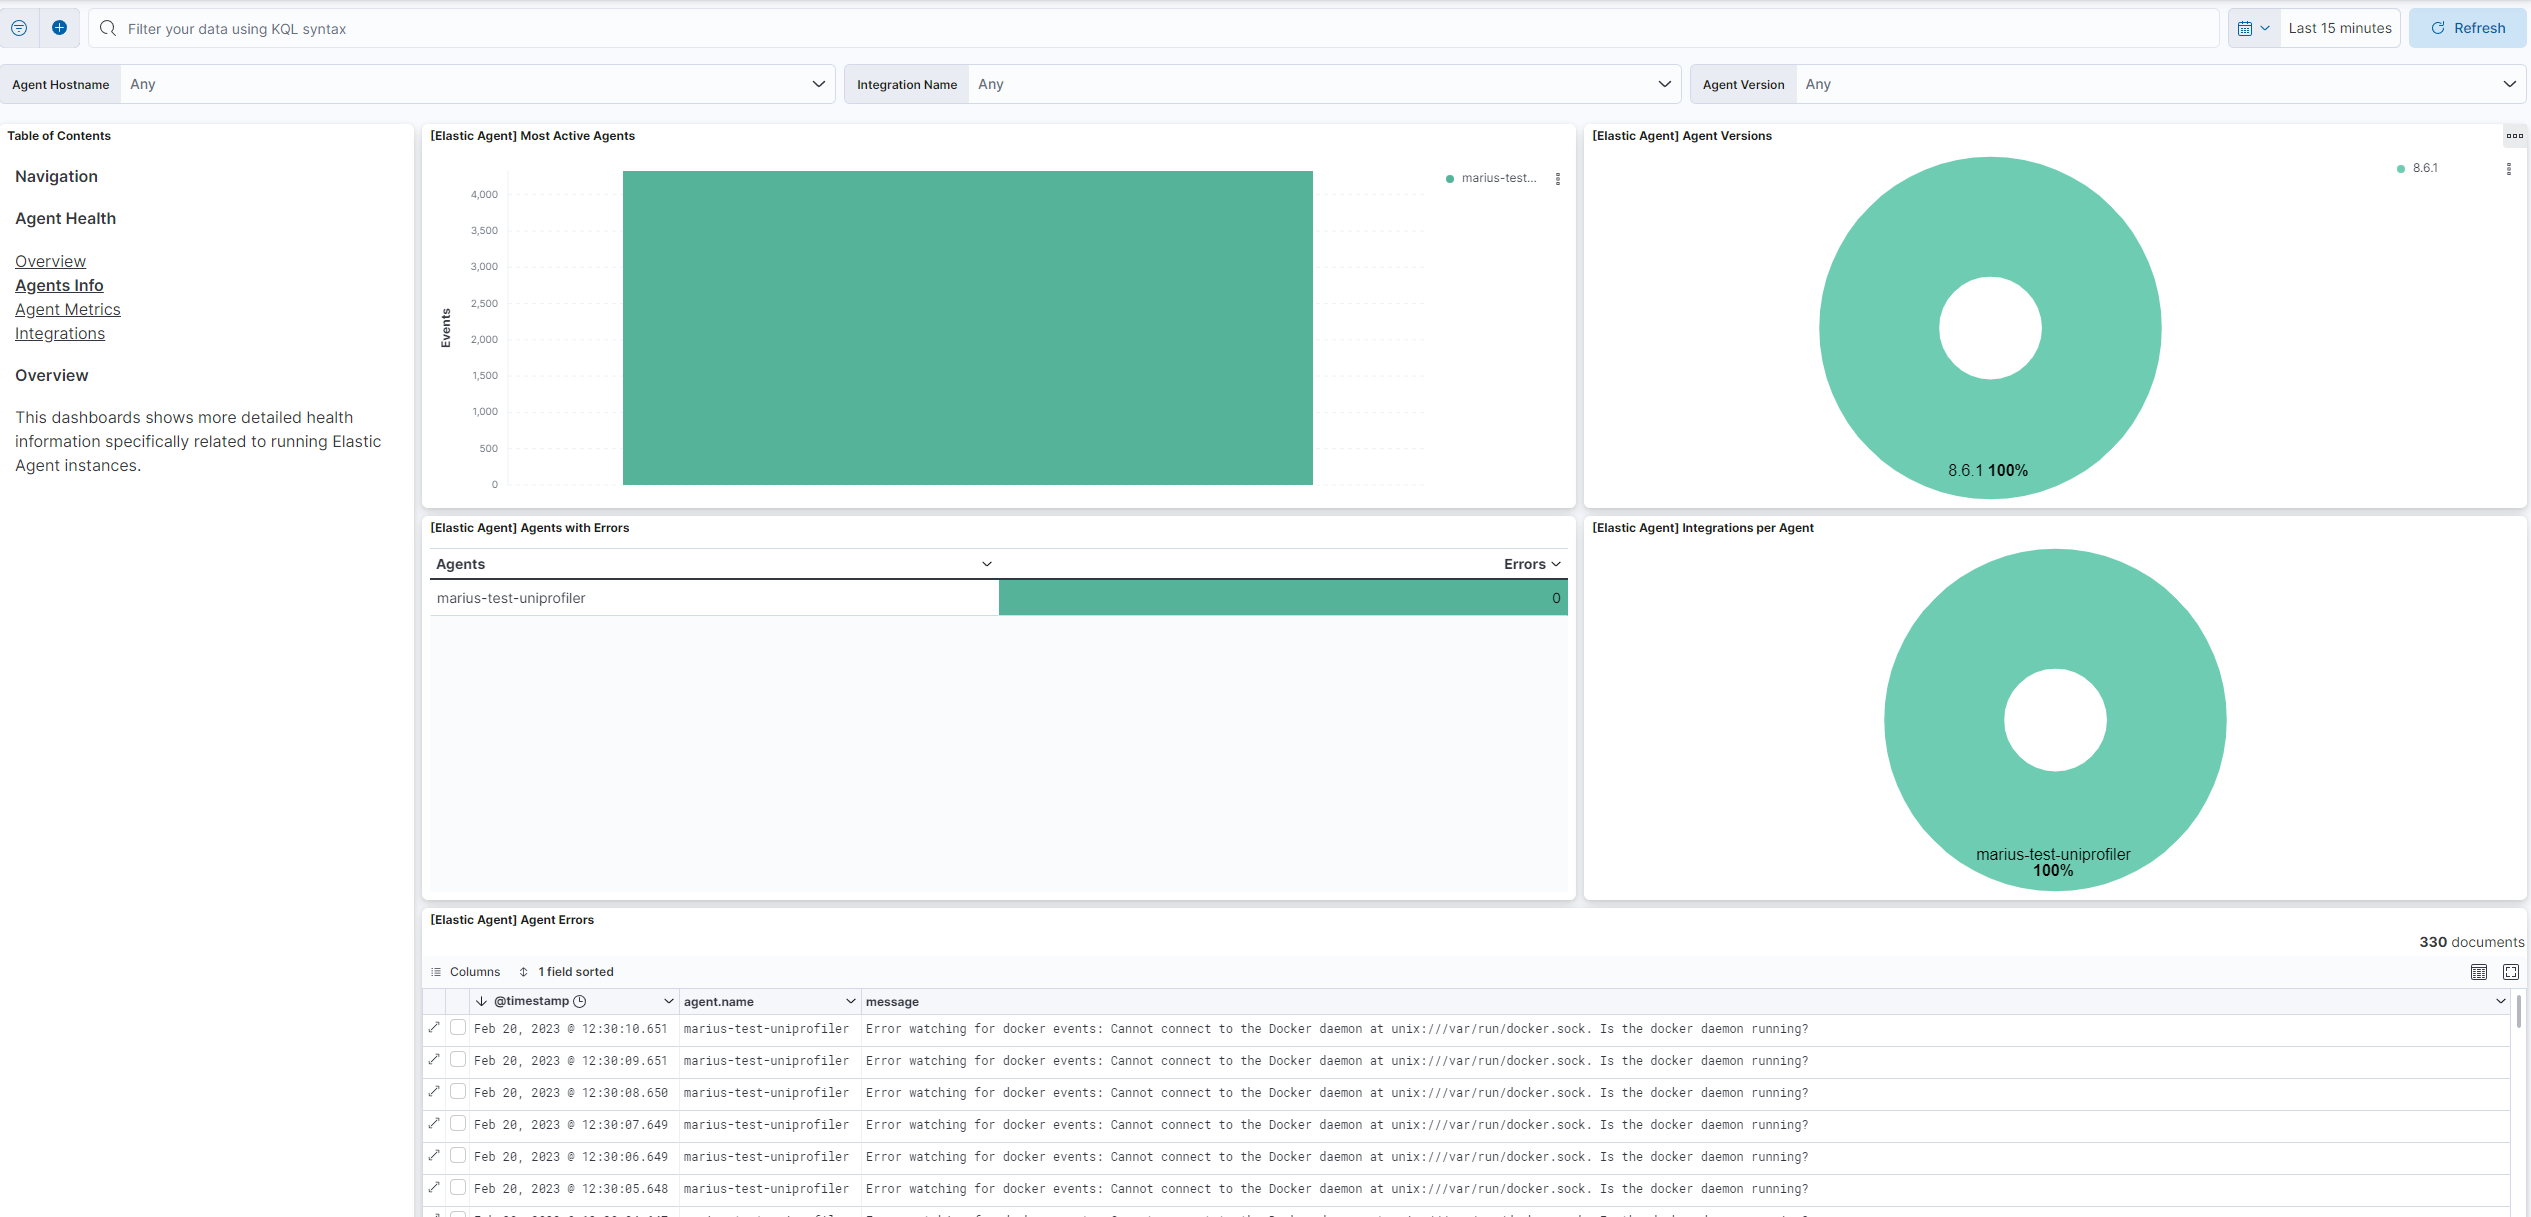
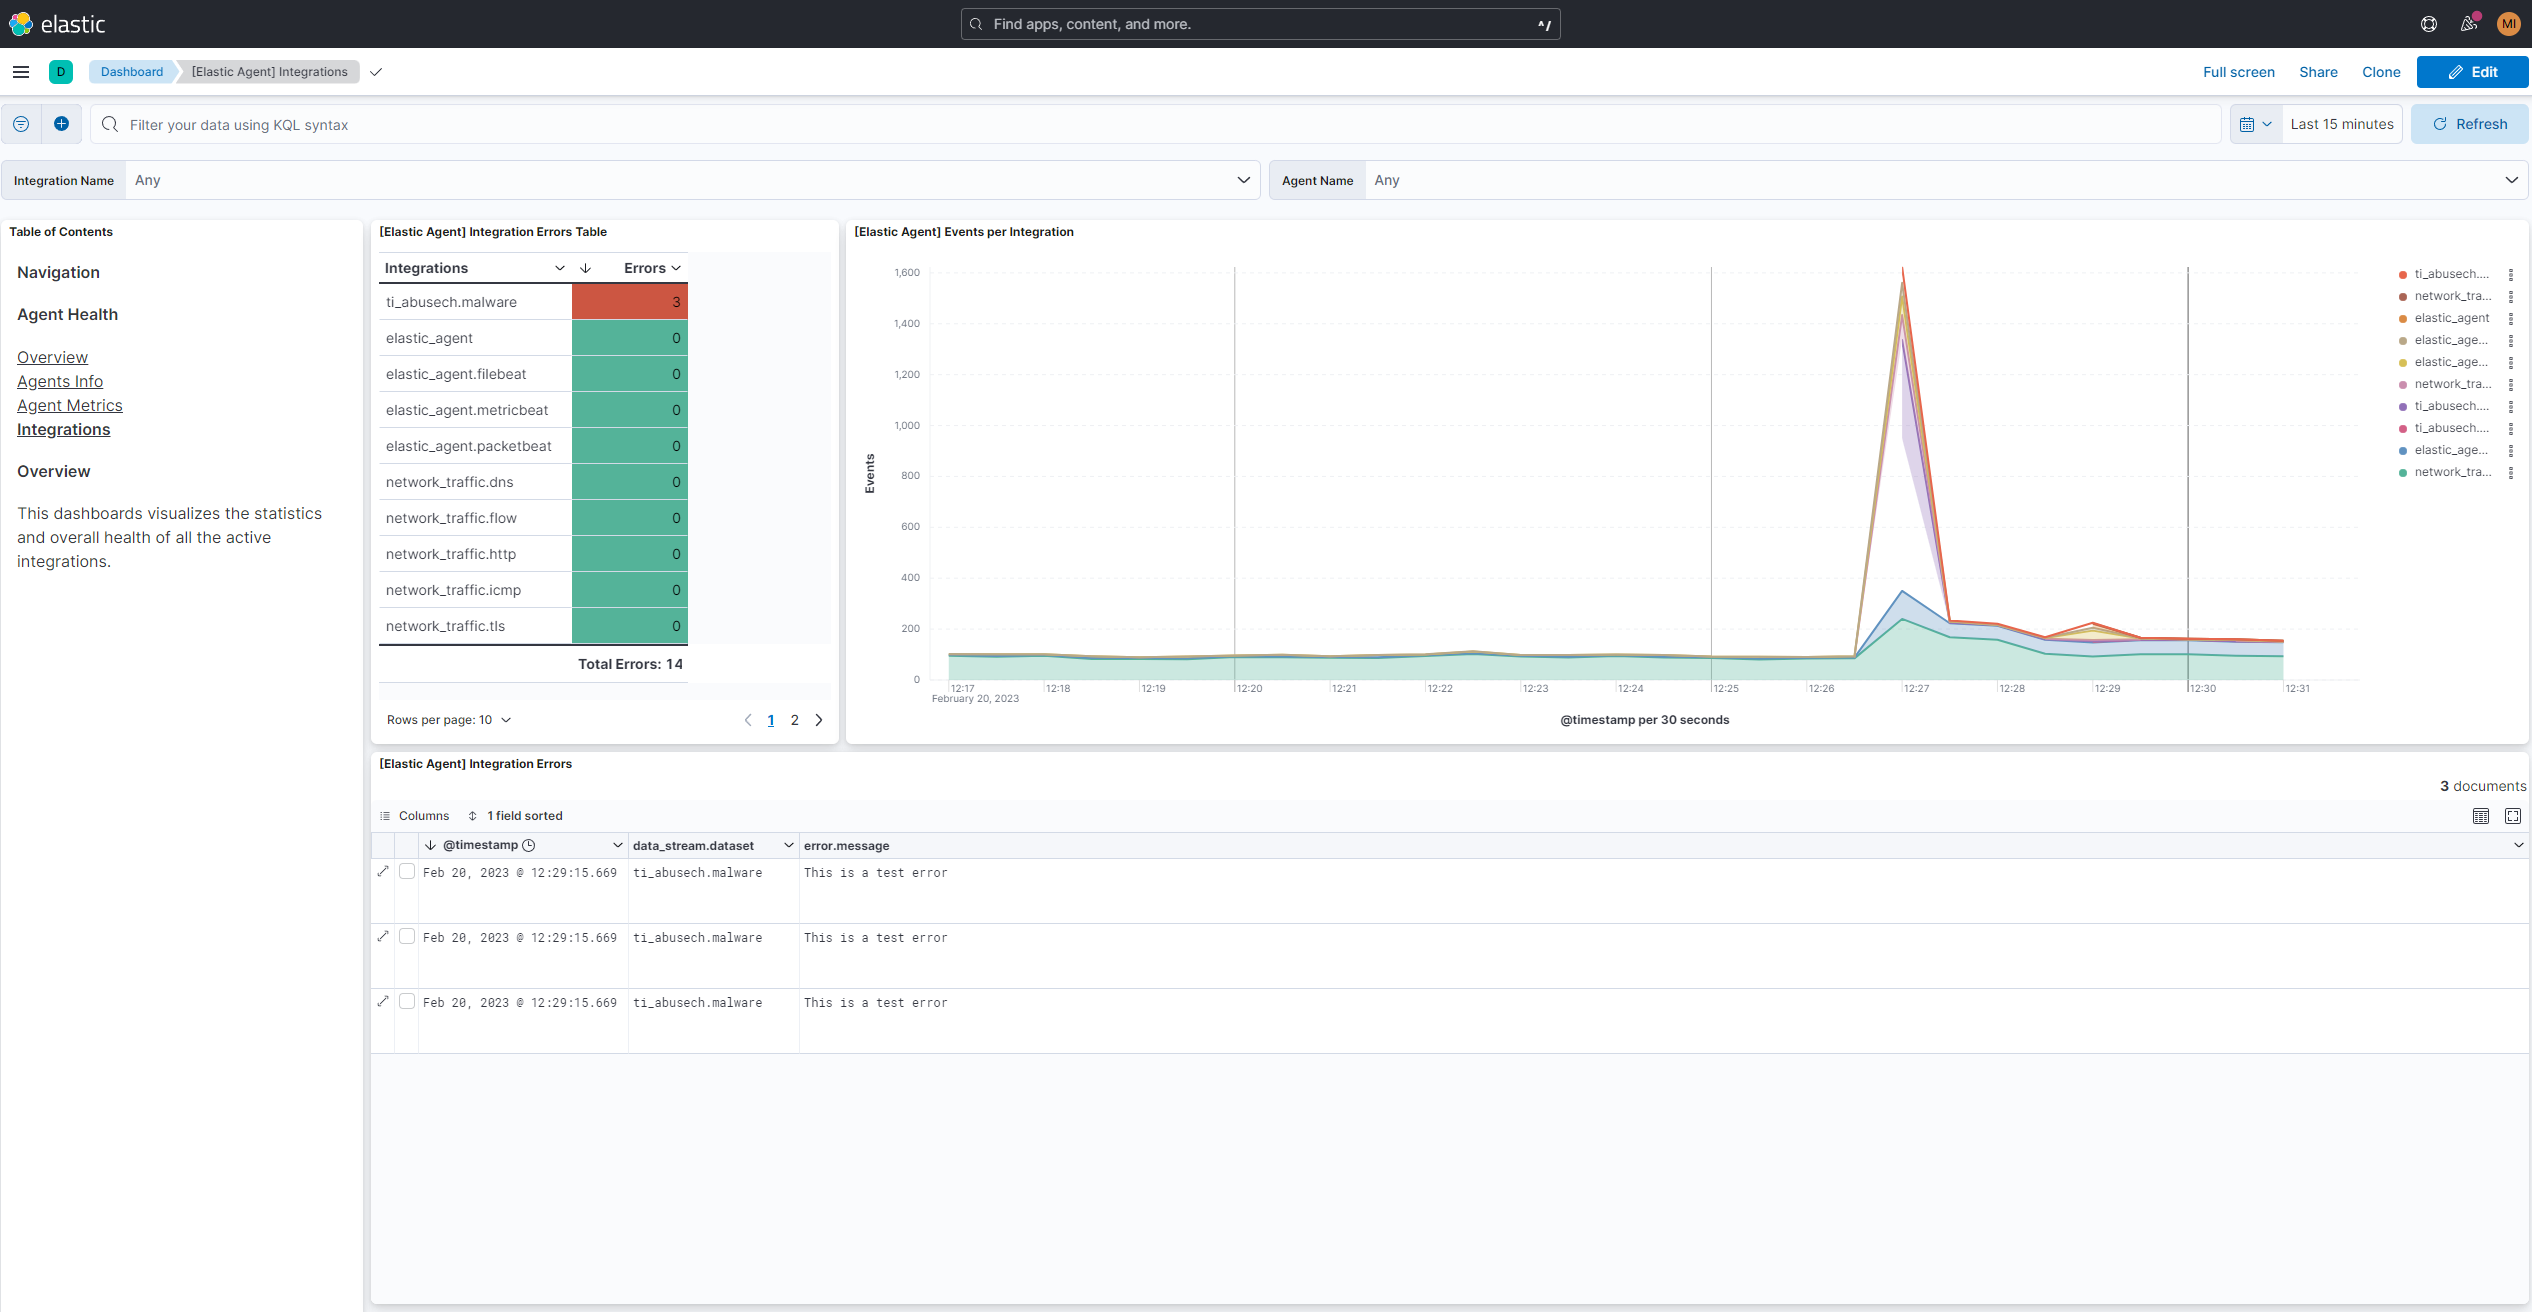
This integration provides observability for Elastic Agent metrics. It provides a dashboard to visualize the status of your agents so you can troubleshoot problems and determine when to add capacity.
You can enable or disable agent monitoring in the agent policy settings.
Exported fields
| Field | Description | Type |
|---|---|---|
| @timestamp | Event timestamp. | date |
| cloud.account.id | The cloud account or organization id used to identify different entities in a multi-tenant environment. Examples: AWS account id, Google Cloud ORG Id, or other unique identifier. | keyword |
| cloud.availability_zone | Availability zone in which this host is running. | keyword |
| cloud.image.id | Image ID for the cloud instance. | keyword |
| cloud.instance.id | Instance ID of the host machine. | keyword |
| cloud.instance.name | Instance name of the host machine. | keyword |
| cloud.machine.type | Machine type of the host machine. | keyword |
| cloud.project.id | Name of the project in Google Cloud. | keyword |
| cloud.provider | Name of the cloud provider. Example values are aws, azure, gcp, or digitalocean. | keyword |
| cloud.region | Region in which this host is running. | keyword |
| container.id | Unique container id. | keyword |
| container.image.name | Name of the image the container was built on. | keyword |
| container.labels | Image labels. | object |
| container.name | Container name. | keyword |
| data_stream.dataset | Data stream dataset. | constant_keyword |
| data_stream.namespace | Data stream namespace. | constant_keyword |
| data_stream.type | Data stream type. | constant_keyword |
| host.architecture | Operating system architecture. | keyword |
| host.containerized | If the host is a container. | boolean |
| host.domain | Name of the domain of which the host is a member. For example, on Windows this could be the host's Active Directory domain or NetBIOS domain name. For Linux this could be the domain of the host's LDAP provider. | keyword |
| host.hostname | Hostname of the host. It normally contains what the hostname command returns on the host machine. |
keyword |
| host.id | Unique host id. As hostname is not always unique, use values that are meaningful in your environment. Example: The current usage of beat.name. |
keyword |
| host.ip | Host ip address. | ip |
| host.mac | Host mac address. | keyword |
| host.name | Name of the host. It can contain what hostname returns on Unix systems, the fully qualified domain name, or a name specified by the user. The sender decides which value to use. |
keyword |
| host.os.build | OS build information. | keyword |
| host.os.codename | OS codename, if any. | keyword |
| host.os.family | OS family (such as redhat, debian, freebsd, windows). | keyword |
| host.os.full | Operating system name, including the version or code name. | keyword |
| host.os.kernel | Operating system kernel version as a raw string. | keyword |
| host.os.name | Operating system name, without the version. | keyword |
| host.os.platform | Operating system platform (such centos, ubuntu, windows). | keyword |
| host.os.version | Operating system version as a raw string. | keyword |
| host.type | Type of host. | keyword |
| elastic_agent.id | Elastic agent id. | |
| elastic_agent.process | Elastic agent process (elastic-agent, metricbeat, ...). | |
| elastic_agent.version | Elastic version as a raw string. |
The Elastic Agent process dataset provides process statistics about Elastic Agent processes. One document is
provided for each process.
| Field | Description | Type |
|---|---|---|
| system.process.cpu.total.ticks | Number of CPU ticks consumed by the process in both user and kernel space | long |
| system.process.cpu.system.ticks | Number of CPU ticks consumed by the process in kernel space | long |
| system.process.cpu.user.ticks | Number of CPU ticks consumed by the process in user space | long |
| system.process.cpu.total.value | The value of CPU usage since starting the process. | long |
| system.process.cpu.total.pct | The percentage of CPU time spent in states other than Idle and IOWait. | scaled_float |
| system.process.cpu.total.time.ms | The time when the process was started. | date |
| system.process.cpu.system.time.ms | The time when the process was started. | date |
| system.process.cpu.user.time.ms | The time when the process was started. | date |
| system.process.env | The environment variables used to start the process. The data is available on FreeBSD, Linux, and OS X. | object |
| system.process.fd.limit.soft | The soft limit on the number of file descriptors opened by the process. The soft limit can be changed by the process at any time. | long |
| system.process.fd.open | The number of file descriptors open by the process. | long |
| system.process.memory.size | The total virtual memory the process has. On Windows this represents the Commit Charge (the total amount of memory that the memory manager has committed for a running process) value in bytes for this process. | long |
| system.process.cgroup.blkio.id | ID of the cgroup. | keyword |
| system.process.cgroup.blkio.path | Path to the cgroup relative to the cgroup subsystems mountpoint. | keyword |
| system.process.cgroup.blkio.total.bytes | Total number of bytes transferred to and from all block devices by processes in the cgroup. | long |
| system.process.cgroup.blkio.total.ios | Total number of I/O operations performed on all devices by processes in the cgroup as seen by the throttling policy. | long |
| system.process.cgroup.cpu.cfs.period.us | Period of time in microseconds for how regularly a cgroup's access to CPU resources should be reallocated. | long |
| system.process.cgroup.cpu.cfs.quota.us | Total amount of time in microseconds for which all tasks in a cgroup can run during one period (as defined by cfs.period.us). | long |
| system.process.cgroup.cpu.cfs.shares | An integer value that specifies a relative share of CPU time available to the tasks in a cgroup. The value specified in the cpu.shares file must be 2 or higher. | long |
| system.process.cgroup.cpu.id | ID of the cgroup. | keyword |
| system.process.cgroup.cpu.path | Path to the cgroup relative to the cgroup subsystem's mountpoint. | keyword |
| system.process.cgroup.cpu.rt.period.us | Period of time in microseconds for how regularly a cgroup's access to CPU resources is reallocated. | long |
| system.process.cgroup.cpu.rt.runtime.us | Period of time in microseconds for the longest continuous period in which the tasks in a cgroup have access to CPU resources. | long |
| system.process.cgroup.cpu.stats.periods | Number of period intervals (as specified in cpu.cfs.period.us) that have elapsed. | long |
| system.process.cgroup.cpu.stats.throttled.ns | The total time duration (in nanoseconds) for which tasks in a cgroup have been throttled. | long |
| system.process.cgroup.cpu.stats.throttled.periods | Number of times tasks in a cgroup have been throttled (that is, not allowed to run because they have exhausted all of the available time as specified by their quota). | long |
| system.process.cgroup.cpuacct.id | ID of the cgroup. | keyword |
| system.process.cgroup.cpuacct.path | Path to the cgroup relative to the cgroup subsystem's mountpoint. | keyword |
| system.process.cgroup.cpuacct.percpu | CPU time (in nanoseconds) consumed on each CPU by all tasks in this cgroup. | object |
| system.process.cgroup.cpuacct.stats.system.ns | CPU time consumed by tasks in user (kernel) mode. | long |
| system.process.cgroup.cpuacct.stats.user.ns | CPU time consumed by tasks in user mode. | long |
| system.process.cgroup.cpuacct.total.ns | Total CPU time in nanoseconds consumed by all tasks in the cgroup. | long |
| system.process.cgroup.id | The ID common to all cgroups associated with this task. If there isn't a common ID used by all cgroups this field will be absent. | keyword |
| system.process.cgroup.memory.id | ID of the cgroup. | keyword |
| system.process.cgroup.memory.kmem.failures | The number of times that the memory limit (kmem.limit.bytes) was reached. | long |
| system.process.cgroup.memory.kmem.limit.bytes | The maximum amount of kernel memory that tasks in the cgroup are allowed to use. | long |
| system.process.cgroup.memory.kmem.usage.bytes | Total kernel memory usage by processes in the cgroup (in bytes). | long |
| system.process.cgroup.memory.kmem.usage.max.bytes | The maximum kernel memory used by processes in the cgroup (in bytes). | long |
| system.process.cgroup.memory.kmem_tcp.failures | The number of times that the memory limit (kmem_tcp.limit.bytes) was reached. | long |
| system.process.cgroup.memory.kmem_tcp.limit.bytes | The maximum amount of memory for TCP buffers that tasks in the cgroup are allowed to use. | long |
| system.process.cgroup.memory.kmem_tcp.usage.bytes | Total memory usage for TCP buffers in bytes. | long |
| system.process.cgroup.memory.kmem_tcp.usage.max.bytes | The maximum memory used for TCP buffers by processes in the cgroup (in bytes). | long |
| system.process.cgroup.memory.mem.failures | The number of times that the memory limit (mem.limit.bytes) was reached. | long |
| system.process.cgroup.memory.mem.limit.bytes | The maximum amount of user memory in bytes (including file cache) that tasks in the cgroup are allowed to use. | long |
| system.process.cgroup.memory.mem.usage.bytes | Total memory usage by processes in the cgroup (in bytes). | long |
| system.process.cgroup.memory.mem.usage.max.bytes | The maximum memory used by processes in the cgroup (in bytes). | long |
| system.process.cgroup.memory.memsw.failures | The number of times that the memory plus swap space limit (memsw.limit.bytes) was reached. | long |
| system.process.cgroup.memory.memsw.limit.bytes | The maximum amount for the sum of memory and swap usage that tasks in the cgroup are allowed to use. | long |
| system.process.cgroup.memory.memsw.usage.bytes | The sum of current memory usage plus swap space used by processes in the cgroup (in bytes). | long |
| system.process.cgroup.memory.memsw.usage.max.bytes | The maximum amount of memory and swap space used by processes in the cgroup (in bytes). | long |
| system.process.cgroup.memory.path | Path to the cgroup relative to the cgroup subsystem's mountpoint. | keyword |
| system.process.cgroup.memory.stats.active_anon.bytes | Anonymous and swap cache on active least-recently-used (LRU) list, including tmpfs (shmem), in bytes. | long |
| system.process.cgroup.memory.stats.active_file.bytes | File-backed memory on active LRU list, in bytes. | long |
| system.process.cgroup.memory.stats.cache.bytes | Page cache, including tmpfs (shmem), in bytes. | long |
| system.process.cgroup.memory.stats.hierarchical_memory_limit.bytes | Memory limit for the hierarchy that contains the memory cgroup, in bytes. | long |
| system.process.cgroup.memory.stats.hierarchical_memsw_limit.bytes | Memory plus swap limit for the hierarchy that contains the memory cgroup, in bytes. | long |
| system.process.cgroup.memory.stats.inactive_anon.bytes | Anonymous and swap cache on inactive LRU list, including tmpfs (shmem), in bytes | long |
| system.process.cgroup.memory.stats.inactive_file.bytes | File-backed memory on inactive LRU list, in bytes. | long |
| system.process.cgroup.memory.stats.major_page_faults | Number of times that a process in the cgroup triggered a major fault. "Major" faults happen when the kernel actually has to read the data from disk. | long |
| system.process.cgroup.memory.stats.mapped_file.bytes | Size of memory-mapped mapped files, including tmpfs (shmem), in bytes. | long |
| system.process.cgroup.memory.stats.page_faults | Number of times that a process in the cgroup triggered a page fault. | long |
| system.process.cgroup.memory.stats.pages_in | Number of pages paged into memory. This is a counter. | long |
| system.process.cgroup.memory.stats.pages_out | Number of pages paged out of memory. This is a counter. | long |
| system.process.cgroup.memory.stats.rss.bytes | Anonymous and swap cache (includes transparent hugepages), not including tmpfs (shmem), in bytes. | long |
| system.process.cgroup.memory.stats.rss_huge.bytes | Number of bytes of anonymous transparent hugepages. | long |
| system.process.cgroup.memory.stats.swap.bytes | Swap usage, in bytes. | long |
| system.process.cgroup.memory.stats.unevictable.bytes | Memory that cannot be reclaimed, in bytes. | long |
| system.process.cgroup.path | The path to the cgroup relative to the cgroup subsystem's mountpoint. If there isn't a common path used by all cgroups this field will be absent. | keyword |
This integration includes one or more Kibana dashboards that visualizes the data collected by the integration. The screenshots below illustrate how the ingested data is displayed.
Changelog
| Version | Details | Minimum Kibana version | ||
|---|---|---|---|---|
| 2.9.6 | Enhancement (View pull request) Add policy_namespace field mapping to status_change_logs data stream. |
9.0.0 8.15.0 |
||
| 2.9.5 | Bug fix (View pull request) Rename the osquerybeat string component field to log.logger to prevent mapping conflicts. |
9.0.0 8.15.0 |
||
| 2.9.4 | Enhancement (View pull request) Add system.cpu.cores to fields and CPU utilization calculations |
9.0.0 8.15.0 |
||
| 2.9.3 | Bug fix (View pull request) Restore deleted apm-server metrics mappings |
9.0.0 8.15.0 |
||
| 2.9.2 | Bug fix (View pull request) Add otelcol.* field mapping to fix mapping conflicts on dotted field names in affected _logs data streams. |
9.0.0 8.15.0 |
||
| 2.9.1 | Bug fix (View pull request) Fix Overview dashboard hiding data due to an unintended default filter. |
9.0.0 8.15.0 |
||
| 2.9.0 | Enhancement (View pull request) Add TSDB dimensions and complete/fix metric_type declarations across elastic_agent metrics data streams. |
9.0.0 8.15.0 |
||
| 2.8.0 | Enhancement (View pull request) Replace markdown navigation links with Links panels for space-aware dashboard navigation |
9.0.0 8.15.0 |
||
| 2.7.6 | Bug fix (View pull request) Add auto-expand-replicas setting |
9.0.0 8.15.0 |
||
| 2.7.5 | Bug fix (View pull request) Fix OS type counts in the Overview dashboard by using host.os.type instead of host.os.family. |
9.0.0 8.15.0 |
||
| 2.7.4 | Bug fix (View pull request) Enable dynamic mapping for APM Server logs |
9.0.0 8.15.0 |
||
| 2.7.3 | Bug fix (View pull request) Fix missing mapping for APM Server metrics, and add new TBS metrics. |
9.0.0 8.15.0 |
||
| 2.7.2 | Bug fix (View pull request) Fix excessive restarts rule to monitor only elastic agent process. Bug fix (View pull request) Fix hardcoding of default namespace in alerting rules. |
9.0.0 8.15.0 |
||
| 2.7.1 | Bug fix (View pull request) Fix the components shown by queue and output widgets from [Elastic Agent] Agent Metrics dashboard. |
9.0.0 8.15.0 |
||
| 2.7.0 | Enhancement (View pull request) Enable time series data streams for the metrics datastreams for endpoint security metrics and filebeat input metrics. This improves storage usage and query performance. For more details, see https://www.elastic.co/guide/en/elasticsearch/reference/current/tsds.html. |
9.0.0 8.15.0 |
||
| 2.6.13 | Bug fix (View pull request) Standardize system.process.[cpu\|memory].* and component.* mapping on all metrics data streams and for filebeat_input_logs.Bug fix (View pull request) Fixes "[Elastic Agent] Agent metrics" CPU visualizations. |
9.0.0 8.15.0 |
||
| 2.6.11 | Bug fix (View pull request) Removes ccs index patterns from rule templates for broad compatibility. |
9.0.0 8.15.0 |
||
| 2.6.10 | Enhancement (View pull request) Add file name and line number mappings for log fields for elastic agent logs. |
9.0.0 8.15.0 |
||
| 2.6.9 | Enhancement (View pull request) Document that Open Handles dashboards are Linux only |
9.0.0 8.15.0 |
||
| 2.6.8 | Enhancement (View pull request) Adds processor for health_status field to status change logs data stream Enhancement (View pull request) Add new alerting rules for agent health status changes Enhancement (View pull request) Use more specifc index and remove RLIKE usage for system metrics alerting rules Bug fix (View pull request) Use system.process.cpu.total.normalized.pct for CPU usage alerting rule |
9.0.0 8.15.0 |
||
| 2.6.7 | Enhancement (View pull request) Add mapping for error fields for beats logs. |
9.0.0 8.15.0 |
||
| 2.6.6 | Bug fix (View pull request) Fixes Unhealthy Elastic Agent alert rule to include degraded status |
9.0.0 8.15.0 |
||
| 2.6.5 | Bug fix (View pull request) Parse log level from Elastic Defend installation command output to address incorrect labeling where all stderr output appears as log.level: error. |
9.0.0 8.15.0 |
||
| 2.6.4 | Enhancement (View pull request) Adds alerting rule templates |
9.0.0 8.15.0 |
||
| 2.6.3 | Enhancement (View pull request) Elastic Agent memory charts now prioritise RSS memory for more accurate usage reporting. |
9.0.0 8.15.0 |
||
| 2.6.2 | Enhancement (View pull request) Add retention limit for status change logs data stream |
9.0.0 8.15.0 |
||
| 2.6.1 | Bug fix (View pull request) Remove otelconsumer from Agent metrics dashboard |
9.0.0 8.15.0 |
||
| 2.6.0 | Enhancement (View pull request) Update version requirements due to the breaking change in metric names |
9.0.0 8.15.0 |
||
| 2.5.2 | Enhancement (View pull request) Update queue.filled.pct.events to queue.filled.pct metric name |
9.0.0 8.11.2 |
||
| 2.5.1 | Enhancement (View pull request) Change Agent metrics dashboard memory source fields |
9.0.0 8.11.2 |
||
| 2.5.0 | Enhancement (View pull request) Enhance filestream, cel and httpjson dashboards |
9.0.0 8.11.2 |
||
| 2.4.0 | Enhancement (View pull request) Add input metrics dashboards for Azure Blob Storage, Azure Eventhub, Entity Analytics, ETW, GCP Pub Sub, Google Cloud Storage, Lumberjack, Streaming, Unified Logs and Unix. |
9.0.0 8.11.2 |
||
| 2.3.1 | Bug fix (View pull request) Fix Elastic Agent metrics dashboard to include Elastic Defend |
9.0.0 8.11.2 |
||
| 2.3.0 | Enhancement (View pull request) Add data stream for status change logs |
9.0.0 8.11.2 |
||
| 2.2.1 | Bug fix (View pull request) Remove hardcoded agent.name filter |
9.0.0 8.11.2 |
||
| 2.2.0 | Enhancement (View pull request) Enable Elastic Agent integration to run on 9.0.0 |
9.0.0 8.11.2 |
||
| 2.1.1 | Bug fix (View pull request) Small dashboard fixes for Elastic Agent metrics |
8.11.2 | ||
| 2.1.0 | Bug fix (View pull request) Fix queue metrics and update dashboards for Elastic Agent |
8.11.2 | ||
| 2.0.4 | Bug fix (View pull request) Add missing apm-server tail sampling monitoring metrics mappings |
8.11.2 | ||
| 2.0.3 | Bug fix (View pull request) Restore Agent errors visualisation to Elastic-Agent agent info dashboard |
8.11.2 | ||
| 2.0.2 | Bug fix (View pull request) Restore Agent errors visualisation |
8.11.2 | ||
| 2.0.1 | Bug fix (View pull request) Add back apm-server metrics dropped due to TSDB |
8.11.2 | ||
| 2.0.0 | Enhancement (View pull request) Update package spec to 3.1.4 |
8.11.2 | ||
| 1.20.0 | Enhancement (View pull request) Change aggregations on elastic agent dashboards |
8.11.2 | ||
| 1.19.2 | Enhancement (View pull request) Add all process values to endpoint metrics |
8.11.2 | ||
| 1.19.1 | Enhancement (View pull request) component values to endpoint metrics |
8.11.2 | ||
| 1.19.0 | Enhancement (View pull request) Add queue full percentage fields |
8.11.2 | ||
| 1.18.0 | Enhancement (View pull request) Add metrics dashboard for httpjson, http_endpoint, filestream and CEL, fix decimal numbers on certain counters, add field mappings for filebeat_input.id, and component fields to filebeat_input logs |
8.11.2 | ||
| 1.17.0 | Enhancement (View pull request) Exposing beat.stats.libbeat.pipeline.queue.max_events metrics. |
8.9.0 | ||
| 1.16.0 | Bug fix (View pull request) Improve and unify dimensions for Elastic-Agent and Beats metrics, this avoids duplicated TSDB entries. |
8.9.0 | ||
| 1.15.0 | Enhancement (View pull request) Add data stream for logs of Universal Profiling services. |
8.9.0 | ||
| 1.14.0 | Enhancement (View pull request) Modify field mappings to reference ECS fields where possible and remove duplicate field declarations. |
8.9.0 | ||
| 1.13.1 | Bug fix (View pull request) Fix mapping and description for the system.process.cpu.{system,user,total}.time.ms fields.Bug fix (View pull request) Align mapping for the beat.stats.libbeat.config.{running,starts,stops} fields with the beat integration.Bug fix (View pull request) For the message field, consistently use the ECS defined mapping type of match_only_text. |
8.9.0 | ||
| 1.13.0 | Enhancement (View pull request) Remove metric mappings from the filebeat_input_logs data stream |
8.9.0 | ||
| 1.12.1 | Enhancement (View pull request) Add a new dataset to include both metrics and logs for the active integrations and agent charts |
8.9.0 | ||
| 1.12.0 | Enhancement (View pull request) Add metrics for queue depth, output batch size and output batch rate. |
8.9.0 | ||
| 1.11.2 | Enhancement (View pull request) Adding hyperlinks that works when installed on different spaces. |
8.9.0 | ||
| 1.11.1 | Bug fix (View pull request) Fix agent health dashboard links to work when installed in other spaces. |
8.9.0 | ||
| 1.11.0 | Enhancement (View pull request) Enable time series data streams for the metrics datastreams except for endpoint security metrics and filebeat input metrics. This improves storage usage and query performance. For more details, see https://www.elastic.co/guide/en/elasticsearch/reference/current/tsds.html. |
8.9.0 | ||
| 1.10.1 | Enhancement (View pull request) Set metric type for all metric fields. |
8.9.0 | ||
| 1.10.0 | Enhancement (View pull request) Set dimension fields for metrics data streams APM Server, Auditbeat, Cloudbeat, Elastic Agent, Heartbeat, Filebeat, Metricbeat, Osquery and Packetbeat. |
8.7.1 | ||
| 1.9.1 | Bug fix (View pull request) For the filebeat_input metrics data stream, prevent dynamic mapping rules designed for long values from matching objects. This fixes mapping issues for the 'filebeat_input.httpjson_interval_pages_total' histogram. |
8.7.1 | ||
| 1.9.0 | Enhancement (View pull request) Add fleet-server attributes to log. |
8.7.1 | ||
| 1.8.0 | Enhancement (View pull request) Added new Health dashboards for Input Metrics |
8.7.1 | ||
| 1.7.0 | Enhancement (View pull request) Added agent. field mappings and updated filters on certain dashboards |
8.6.1 | ||
| 1.6.0 | Enhancement (View pull request) Adding new Agent Health dashboards, and remaking Agent Metrics. |
8.6.1 | ||
| 1.5.2 | Enhancement (View pull request) Add datastreams for cloud_defend service logs |
8.0.0 7.16.0 |
||
| 1.5.1 | Bug fix (View pull request) Add dataset filters for agent metrics |
8.0.0 7.16.0 |
||
| 1.5.0 | Enhancement (View pull request) Add filebeat input metrics |
8.0.0 7.16.0 |
||
| 1.4.1 | Enhancement (View pull request) Cloudbeat decision logs support |
8.0.0 7.16.0 |
||
| 1.4.0 | Enhancement (View pull request) Add new fields for Elastic Agent v2 components and units |
8.0.0 7.16.0 |
||
| 1.3.5 | Bug fix (View pull request) Fix the external ECS fields not being properly resolved during the package build |
8.0.0 7.16.0 |
||
| 1.3.4 | Enhancement (View pull request) Cloudbeat logs search support |
8.0.0 7.16.0 |
||
| 1.3.3 | Enhancement (View pull request) Add configuration for cloudbeat logs and metrics. |
8.0.0 7.16.0 |
||
| 1.3.2 | Bug fix (View pull request) Fix some CPU elastic_agent_metrics mapping from date to long |
— | ||
| 1.3.1 | Bug fix (View pull request) Fix missing ecs.version mapping |
8.0.0 7.16.0 |
||
| 1.3.0 | Enhancement (View pull request) Update compatibility of package to be compatible with 8.0.x |
8.0.0 7.16.0 |
||
| 1.2.2 | Enhancement (View pull request) Uniform with guidelines |
— | ||
| 1.2.1 | Bug fix (View pull request) Fix dashboard default filter |
7.15.0 | ||
| 1.2.0 | Enhancement (View pull request) Update dashboard to CGroup CPU usage and events rates visualization and add Elastic Agent logo |
7.15.0 | ||
| 1.1.1 | Bug fix (View pull request) Fix missing support for heartbeat metrics and logs |
7.15.0 | ||
| 1.1.0 | Enhancement (View pull request) Add mappings for all metrics and logs shipped by Elastic Agent and its sub processes. |
— | ||
| 1.0.0 | Enhancement (View pull request) Make integration GA. |
7.14.0 | ||
| 0.1.0 | Enhancement (View pull request) Update integration description |
— | ||
| 0.0.7 | Bug fix (View pull request) Fix typo in dashboard |
— | ||
| 0.0.6 | Bug fix (View pull request) Fix README, icons and add screenshot |
— | ||
| 0.0.5 | Enhancement (View pull request) initial release |
— |