Azure Monitor Integration
Elastic Cloud Serverless projects are autoscaled environments, fully managed by Elastic and available on Elastic Cloud. Availability This functionality is generally available and ready for production usage. Elastic Cloud Serverless projects are autoscaled environments, fully managed by Elastic and available on Elastic Cloud. Availability This functionality is generally available and ready for production usage. The Elastic Stack includes Elastic's core products such as Elasticsearch, Kibana, Logstash, and Beats. Availability This functionality is generally available and ready for production usage. Unless stated otherwise on the page, this functionality is available when your Elastic Stack is deployed on Elastic Cloud Hosted, Elastic Cloud Enterprise, Elastic Cloud on Kubernetes, and self-managed environments. This documentation corresponds to the latest patch available for each minor version. If you're not using the latest patch, check the release notes for changes.
Serverless Observability
Generally available
Serverless Security
Generally available
Stack
9.1+
Generally available since 9.1
| Version | 1.16.0 (View all) |
| Managed integration release status | Availability Beta This functionality is in beta and is not ready for production usage. For beta features, the design and code is less mature than official GA features and is being provided as-is with no warranties. Beta features are not subject to the support SLA of official GA features. Specific Support terms apply. |
| Subscription level What's this? |
Basic |
| Ingestion method(s) | API |
| Minimum Kibana version(s) | 9.1.5 9.0.8 8.19.5 8.18.8 |
You can use this integration as an Elastic Managed integration on Elastic Cloud Hosted deployments running this version or later.
The Azure Monitor feature collects and aggregates logs and metrics from a variety of sources into a common data platform where it can be used for analysis, visualization, and alerting.
The Azure Monitor metrics are numerical values that describe some aspect of a system at a particular point in time. They are collected at regular intervals and are identified with a timestamp, a name, a value, and one or more defining labels.
The Azure Resource Metrics will periodically retrieve the Azure Monitor metrics using the Azure REST APIs as MetricList. Additional Azure API calls will be executed to retrieve information regarding the resources targeted by the user.
Before you start, check the Authentication and costs section.
Follow these step-by-step instructions on how to set up an Azure metrics integration.
Period:: (string) Reporting interval. Metrics will have a timegrain of 5 minutes, so the Period configuration option for monitor should have a value of 300s or multiple of 300sfor relevant results.
Resources:: (string) Contains following options:
resource_id:: ([]string) The fully qualified ID's of the resource, including the resource name and resource type. Has the format /subscriptions/{guid}/resourceGroups/{resource-group-name}/providers/{resource-provider-namespace}/{resource-type}/{resource-name}.
Should return a list of resources.
You can gather metrics from a large number of resources. To reduce verbosity, you can enter a resource group and filter by resource type, or type in a “resource_query” where you can filter resources inside your subscription. Check the following resources API:
resource_group:: ([]string) Using the resource_type configuration option as a filter is required for the resource groups entered. This option should return a list resources we want to apply our metric configuration options on.
resource_type:: (string) As mentioned above this will be a filter option for the resource group api, will check for all resources under the specified group that are the type under this configuration.
resource_query:: (string) Should contain a filter entered by the user, the output will be a list of resources.
metrics:: List of different metrics to collect information.
namespace:: (string) Namespaces are a way to categorize or group similar metrics together. By using namespaces, users can achieve isolation between groups of metrics that might collect different insights or performance indicators.
name:: ([]string) Name of the metrics that's being reported. Usually, the name is descriptive enough to help identify what's measured. A list of metric names can be entered as well.
aggregations:: ([]string) List of supported aggregations.
Azure Monitor stores all metrics at one-minute granularity intervals. During a given minute, a metric might need to be sampled several times or it might need to be measured for many discrete events.
To limit the number of raw values we have to emit and pay for in Azure Monitor, they will locally pre-aggregate and emit the values:
Minimum: The minimum observed value from all the samples and measurements during the minute.
Maximum: The maximum observed value from all the samples and measurements during the minute.
Sum: The summation of all the observed values from all the samples and measurements during the minute.
Count: The number of samples and measurements taken during the minute.
Total: The total number of all the observed values from all the samples and measurements during the minute.
If no aggregations are filled, the primary aggregation assigned for this metric will be considered.
dimensions:: List of metric dimensions. Dimensions are optional, not all metrics may have dimensions. A custom metric can have up to 10 dimensions.
A dimension is a key or value pair that helps describe additional characteristics about the metric being collected. By using the additional characteristics, you can collect more information about the metric, which allows for deeper insights.
By using this key, you can filter the metric to see how much memory specific processes use or to identify the top five processes by memory usage.
Metrics with dimensions are exported as flattened single dimensional metrics, aggregated across dimension values.
name:: Dimension key
value:: Dimension value. (Users can select * to return metric values for each dimension)
ignore_unsupported:: (bool) Namespaces can be unsupported by some resources and supported in some, this configuration option makes sure no error messages are returned if the namespace is unsupported.
The same will go for the metrics configured, some can be removed from Azure Monitor and it should not affect the state of the module.
Users can select the options to retrieve all metrics from a specific namespace using the following:
Example configuration:
- resource_query: "resourceType eq 'Microsoft.DocumentDb/databaseAccounts'"
  metrics:
  - name: ["DataUsage", "DocumentCount", "DocumentQuota"]
    namespace: "Microsoft.DocumentDb/databaseAccounts"
    ignore_unsupported: true
    dimensions:
    - name: "DatabaseName"
      value: "*"
Exported fields
| Field | Description | Type | Metric Type |
|---|---|---|---|
| @timestamp | Event timestamp. | date | |
| agent.id | Unique identifier of this agent (if one exists). Example: For Beats this would be beat.id. | keyword | |
| azure.application_id | The application ID | keyword | |
| azure.dimensions.* | Azure metric dimensions. | object | |
| azure.dimensions.fingerprint | Autogenerated ID representing the fingerprint of the azure.dimensions object | keyword | |
| azure.metrics.*.* | Metrics returned. | object | gauge |
| azure.namespace | The namespace selected | keyword | |
| azure.resource.group | The resource group | keyword | |
| azure.resource.id | The id of the resource | keyword | |
| azure.resource.name | The name of the resource | keyword | |
| azure.resource.tags.* | Azure resource tags. | object | |
| azure.resource.type | The type of the resource | keyword | |
| azure.subscription_id | The subscription ID | keyword | |
| azure.timegrain | The Azure metric timegrain | keyword | |
| cloud.account.id | The cloud account or organization id used to identify different entities in a multi-tenant environment. Examples: AWS account id, Google Cloud ORG Id, or other unique identifier. | keyword | |
| cloud.availability_zone | Availability zone in which this host is running. | keyword | |
| cloud.image.id | Image ID for the cloud instance. | keyword | |
| cloud.instance.id | Instance ID of the host machine. | keyword | |
| cloud.instance.name | Instance name of the host machine. | keyword | |
| cloud.machine.type | Machine type of the host machine. | keyword | |
| cloud.project.id | Name of the project in Google Cloud. | keyword | |
| cloud.provider | Name of the cloud provider. Example values are aws, azure, gcp, or digitalocean. | keyword | |
| cloud.region | Region in which this host is running. | keyword | |
| container.id | Unique container id. | keyword | |
| container.image.name | Name of the image the container was built on. | keyword | |
| container.labels | Image labels. | object | |
| container.name | Container name. | keyword | |
| container.runtime | Runtime managing this container. | keyword | |
| data_stream.dataset | Data stream dataset name. | constant_keyword | |
| data_stream.namespace | Data stream namespace. | constant_keyword | |
| data_stream.type | Data stream type. | constant_keyword | |
| dataset.name | Dataset name. | constant_keyword | |
| dataset.namespace | Dataset namespace. | constant_keyword | |
| dataset.type | Dataset type. | constant_keyword | |
| ecs.version | ECS version this event conforms to. ecs.version is a required field and must exist in all events. When querying across multiple indices -- which may conform to slightly different ECS versions -- this field lets integrations adjust to the schema version of the events. |
keyword | |
| host | A host is defined as a general computing instance. ECS host.* fields should be populated with details about the host on which the event happened, or from which the measurement was taken. Host types include hardware, virtual machines, Docker containers, and Kubernetes nodes. | group | |
| host.architecture | Operating system architecture. | keyword | |
| host.containerized | If the host is a container. | boolean | |
| host.domain | Name of the domain of which the host is a member. For example, on Windows this could be the host's Active Directory domain or NetBIOS domain name. For Linux this could be the domain of the host's LDAP provider. | keyword | |
| host.hostname | Hostname of the host. It normally contains what the hostname command returns on the host machine. |
keyword | |
| host.id | Unique host id. As hostname is not always unique, use values that are meaningful in your environment. Example: The current usage of beat.name. |
keyword | |
| host.ip | Host ip addresses. | ip | |
| host.mac | Host mac addresses. | keyword | |
| host.name | Name of the host. It can contain what hostname returns on Unix systems, the fully qualified domain name, or a name specified by the user. The sender decides which value to use. |
keyword | |
| host.os.build | OS build information. | keyword | |
| host.os.codename | OS codename, if any. | keyword | |
| host.os.family | OS family (such as redhat, debian, freebsd, windows). | keyword | |
| host.os.kernel | Operating system kernel version as a raw string. | keyword | |
| host.os.name | Operating system name, without the version. | keyword | |
| host.os.name.text | Multi-field of host.os.name. |
text | |
| host.os.platform | Operating system platform (such centos, ubuntu, windows). | keyword | |
| host.os.version | Operating system version as a raw string. | keyword | |
| host.type | Type of host. For Cloud providers this can be the machine type like t2.medium. If vm, this could be the container, for example, or other information meaningful in your environment. |
keyword | |
| service.address | Service address | keyword | |
| service.type | The type of the service data is collected from. The type can be used to group and correlate logs and metrics from one service type. Example: If logs or metrics are collected from Elasticsearch, service.type would be elasticsearch. |
keyword |
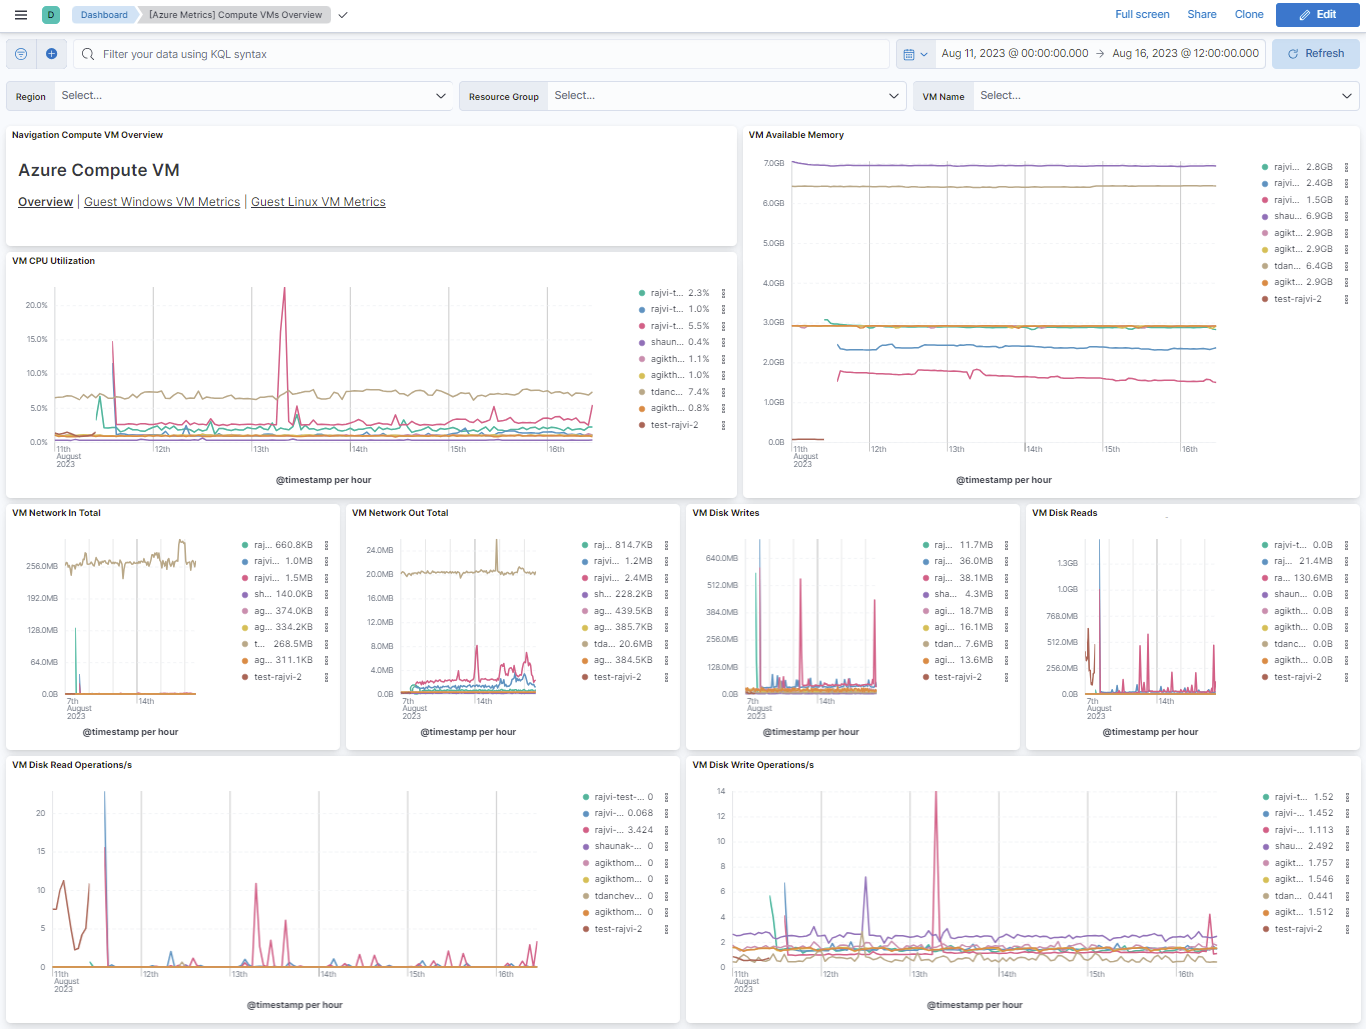
This integration includes one or more Kibana dashboards that visualizes the data collected by the integration. The screenshots below illustrate how the ingested data is displayed.
Changelog
| Version | Details | Minimum Kibana version |
|---|---|---|
| 1.16.0 | Enhancement (View pull request) Update Elastic Managed integration documentation to the current wording and docs links. |
9.1.5 9.0.8 8.19.5 8.18.8 |
| 1.15.0 | Enhancement (View pull request) Publish Agentless to Elastic Managed integrations name change. |
9.1.5 9.0.8 8.19.5 8.18.8 |
| 1.14.0 | Enhancement (View pull request) Add Available Memory Percentage metric to compute VM data streams. |
9.1.5 9.0.8 8.19.5 8.18.8 |
| 1.13.0 | Enhancement (View pull request) Use new release field for agentless deployment mode to establish as beta. |
9.1.5 9.0.8 8.19.5 8.18.8 |
| 1.12.0 | Enhancement (View pull request) Enable agentless deployment mode for the integration. |
9.1.5 9.0.8 8.19.5 8.18.8 |
| 1.11.1 | Bug fix (View pull request) Fix YAML indentation in compute_vm stream template so the rendered config parses under stricter YAML parsers (Kibana 9.5+). |
9.1.5 9.0.8 8.19.5 8.18.8 |
| 1.11.0 | Enhancement (View pull request) Add default_timegrain configuration option. |
9.1.5 9.0.8 8.19.5 8.18.8 |
| 1.10.1 | Enhancement (View pull request) Fix H1s for SEO purpose. |
9.0.2 8.18.2 8.17.7 |
| 1.10.0 | Enhancement (View pull request) Add a flag fips_compatible to control whether the package is allowed in the ECH FedRAMP High environment. |
9.0.2 8.18.2 8.17.7 |
| 1.9.0 | Enhancement (View pull request) Add latency configuration option. |
9.0.2 8.18.2 8.17.7 |
| 1.8.0 | Enhancement (View pull request) Add enable_batch_api option |
9.0.1 8.18.2 8.17.7 |
| 1.7.0 | Enhancement (View pull request) Add support for Kibana 9.0.0 |
9.0.0 8.12.0 |
| 1.6.9 | Bug fix (View pull request) Update links to getting started docs |
8.12.0 |
| 1.6.8 | Enhancement (View pull request) Add missing category. |
8.12.0 |
| 1.6.7 | Enhancement (View pull request) Clarify generic vs specialized integrations on Azure metrics pages. |
8.12.0 |
| 1.6.6 | Bug fix (View pull request) Fix capacity and count metrics visualizations in the overview, blob, table, and file storage dashboards. |
8.12.0 |
| 1.6.5 | Enhancement (View pull request) Consolidate content on Azure metrics pages. |
8.12.0 |
| 1.6.4 | Enhancement (View pull request) Consolidate content on Azure metrics pages. |
8.12.0 |
| 1.6.3 | Enhancement (View pull request) Consolidate content on the Azure Container Instance Metrics doc page. |
8.12.0 |
| 1.6.2 | Enhancement (View pull request) Consolidate content on the Azure Container Registry Metrics doc page. |
8.12.0 |
| 1.6.1 | Enhancement (View pull request) Consolidate content on the Azure Monitor Metrics doc page. |
8.12.0 |
| 1.6.0 | Enhancement (View pull request) Add support for integration secrets. |
8.12.0 |
| 1.5.0 | Enhancement (View pull request) Update visualizations of Queue Storage Overview, Table Storage Overview, File Storage Overview & Storage Overview dashboards. |
8.11.2 |
| 1.4.4 | Enhancement (View pull request) Migrate Blob Storage Overview dashboard to lens. |
8.11.2 |
| 1.4.3 | Enhancement (View pull request) Remove suffix from Compute VMs Overview dashboard. |
8.11.2 |
| 1.4.2 | Enhancement (View pull request) Apply documentation guidelines and add generic setup section to Azure Resource Metrics. |
8.11.2 |
| 1.4.1 | Enhancement (View pull request) Expand Azure guest metrics section. |
8.11.2 |
| 1.4.0 | Enhancement (View pull request) Enable time series data streams for all metrics dataset. This dramatically reduces storage for metrics and is expected to progressively improve query performance. For more details, see https://www.elastic.co/guide/en/elasticsearch/reference/current/tsds.html. |
8.11.2 |
| 1.3.0 | Enhancement (View pull request) Allow rerouting of Azure metrics events to a different data stream. |
8.10.2 |
| 1.2.1 | Bug fix (View pull request) Add missing dimension metadata to the database_account datastream; fix typo in the container_registry field definition |
8.10.2 |
| 1.2.0 | Enhancement (View pull request) Enable time series data streams for the storage_account metrics dataset. This dramatically reduces storage for metrics and is expected to progressively improve query performance. For more details, see https://www.elastic.co/guide/en/elasticsearch/reference/current/tsds.html. |
8.10.2 |
| 1.1.1 | Enhancement (View pull request) Add metric_type metadata to the storage_account datastream |
8.10.2 |
| 1.1.0 | Enhancement (View pull request) Add dimensions to the storage account datastream |
8.10.2 |
| 1.0.43 | Enhancement (View pull request) Migrate File Storage Overview dashboard to lens. |
8.9.0 |
| 1.0.42 | Enhancement (View pull request) Migrate Table Storage Overview dashboard to lens. |
8.9.0 |
| 1.0.41 | Enhancement (View pull request) Migrate Queue Storage Overview dashboard to lens. |
8.9.0 |
| 1.0.40 | Enhancement (View pull request) Add dimension and metric_type metadata to the database_account datastream |
8.9.0 |
| 1.0.39 | Bug fix (View pull request) Remove region dimension in the database_account datastream |
8.9.0 |
| 1.0.38 | Enhancement (View pull request) Migrate Compute VMs Overview dashboard to lens. |
8.9.0 |
| 1.0.37 | Enhancement (View pull request) Migrate Storage Overview dashboard to lens. |
8.9.0 |
| 1.0.36 | Enhancement (View pull request) Migrate Container Instance Overview dashboard to lens. |
8.9.0 |
| 1.0.35 | Bug fix (View pull request) Normalize the azure.dimentions.status field value to lowercase. Values from Azure come in lowercase and capitalized versions (e.g., True/true/False/false). |
8.9.0 |
| 1.0.34 | Enhancement (View pull request) Add dimension and metric_type metadata to the monitor datastream |
8.9.0 |
| 1.0.33 | Enhancement (View pull request) Add missing region dimension, remove outdated azure metrics for the database_account datastream |
8.9.0 |
| 1.0.32 | Enhancement (View pull request) Migrate Container Registry Overview dashboard to lens. |
8.9.0 |
| 1.0.31 | Enhancement (View pull request) Migrate Compute VM Guest Memory & Process Metrics Compute VM dashboard to lens. |
8.9.0 |
| 1.0.30 | Enhancement (View pull request) Migrate Compute VM Guest ASP.NET & Sql Server dashboard to lens. |
8.9.0 |
| 1.0.29 | Enhancement (View pull request) Migrate Compute VM Guest Linux Metrics Overview dashboard to lens. |
8.9.0 |
| 1.0.28 | Enhancement (View pull request) Add dimension and metric_type metadata to the compute_vm datastream |
8.9.0 |
| 1.0.27 | Enhancement (View pull request) Migrate Container Service Overview dashboard to lens. |
8.4.0 |
| 1.0.26 | Enhancement (View pull request) Migrate VM Scale Sets Overview dashboard to lens. |
8.4.0 |
| 1.0.25 | Enhancement (View pull request) Migrate Database Account Overview dashboard to lens. |
8.4.0 |
| 1.0.24 | Bug fix (View pull request) Fix the metrics field name in the container instance datastream. |
8.3.0 |
| 1.0.23 | Enhancement (View pull request) Add dimension and metric_type metadata to the compute_vm_scaleset datastream |
8.3.0 |
| 1.0.22 | Enhancement (View pull request) Add dimension and metric_type metadata to the container_registry datastream |
8.3.0 |
| 1.0.21 | Enhancement (View pull request) Migrate the visualizations to by value in dashboards to minimize the saved object clutter and reduce time to load. |
8.3.0 |
| 1.0.20 | Enhancement (View pull request) Add missing azure dimensions to the container_registry and compute_vm_scaleset datastreams |
8.0.0 7.14.0 |
| 1.0.19 | Enhancement (View pull request) Add dimension and metric_type metadata to the container_service datastream |
8.0.0 7.14.0 |
| 1.0.18 | Enhancement (View pull request) Add missing azure dimensions to the kube_pod_status_phase and kube_pod_status_ready metrics |
8.0.0 7.14.0 |
| 1.0.17 | Enhancement (View pull request) Add dimension and metric_type metadata to the container_instance datastream |
8.0.0 7.14.0 |
| 1.0.16 | Enhancement (View pull request) Added categories and/or subcategories. |
8.0.0 7.14.0 |
| 1.0.15 | Bug fix (View pull request) Fix dimensions for CassandraConnectionClosures metric configuration |
8.0.0 7.14.0 |
| 1.0.14 | Bug fix (View pull request) Fix CassandraConnectionClosures metric configuration |
8.0.0 7.14.0 |
| 1.0.13 | Bug fix (View pull request) Replace the link to Indonesian docs with English docs |
8.0.0 7.14.0 |
| 1.0.12 | Enhancement (View pull request) Add container_instance pipeline test |
8.0.0 7.14.0 |
| 1.0.11 | Enhancement (View pull request) Add compute_vm_scaleset pipeline test |
8.0.0 7.14.0 |
| 1.0.10 | Enhancement (View pull request) Add compute_vm pipeline test |
8.0.0 7.14.0 |
| 1.0.9 | Enhancement (View pull request) Move database_account metrics config from beats to integrations |
8.0.0 7.14.0 |
| 1.0.8 | Enhancement (View pull request) Move container_registry metrics config from beats to integrations |
— |
| 1.0.7 | Enhancement (View pull request) Move container_service metrics config from beats to integrations |
— |
| 1.0.6 | Enhancement (View pull request) Move container_instance metrics config from beats to integrations |
— |
| 1.0.5 | Enhancement (View pull request) Fix doc build |
8.0.0 7.14.0 |
| 1.0.4 | Enhancement (View pull request) Update Readme |
— |
| 1.0.3 | Enhancement (View pull request) Add documentation for multi-fields |
8.0.0 7.14.0 |
| 1.0.2 | Enhancement (View pull request) Update documentation |
— |
| 1.0.1 | Enhancement (View pull request) Remove beta release tag from data streams |
8.0.0 7.14.0 |
| 1.0.0 | Enhancement (View pull request) Move azure_metrics package to GA |
8.0.0 7.14.0 |
| 0.5.1 | Enhancement (View pull request) Update to ECS 8.0 |
— |
| 0.5.0 | Enhancement (View pull request) Release package for v8.0.0 |
— |
| 0.4.1 | Enhancement (View pull request) Uniform with guidelines |
— |
| 0.4.0 | Enhancement (View pull request) Update to ECS 1.12.0 |
— |
| 0.3.2 | Enhancement (View pull request) Add/update configuration options definitions in the docs + add additional option for storage account |
7.14.0 |
| 0.3.1 | Enhancement (View pull request) Clean up text and fix dashboards |
7.14.0 |
| 0.3.0 | Enhancement (View pull request) Add guest metrics |
— |
| 0.2.0 | Enhancement (View pull request) Update integration description |
— |
| 0.1.0 | Enhancement (View pull request) Update dashboards, doc, ecs schema |
— |
| 0.0.1 | Enhancement (View pull request) Create package |
— |