Apache Spark Integration
Elastic Cloud Serverless projects are autoscaled environments, fully managed by Elastic and available on Elastic Cloud. Availability This functionality is generally available and ready for production usage. Elastic Cloud Serverless projects are autoscaled environments, fully managed by Elastic and available on Elastic Cloud. Availability This functionality is generally available and ready for production usage. The Elastic Stack includes Elastic's core products such as Elasticsearch, Kibana, Logstash, and Beats. Availability This functionality is generally available and ready for production usage. Unless stated otherwise on the page, this functionality is available when your Elastic Stack is deployed on Elastic Cloud Hosted, Elastic Cloud Enterprise, Elastic Cloud on Kubernetes, and self-managed environments. This documentation corresponds to the latest patch available for each minor version. If you're not using the latest patch, check the release notes for changes.
Serverless Observability
Generally available
Serverless Security
Generally available
Stack
9.0+
Generally available since 9.0
| Version | 1.5.2 (View all) |
| Subscription level What's this? |
Basic |
| Developed by What's this? |
Elastic |
| Ingestion method(s) | Jolokia |
| Minimum Kibana version(s) | 9.0.0 8.13.0 |
Apache Spark is an open-source, distributed computing system that provides a fast and general-purpose cluster-computing framework. It offers in-memory data processing capabilities, which significantly enhances the performance of big data analytics applications. Spark provides support for a variety of programming languages including Scala, Python, Java, and R, and comes with built-in modules for SQL, streaming, machine learning, and graph processing. This makes it a versatile tool for a wide range of data processing and analysis tasks.
Use the Apache Spark integration to:
- Collect metrics related to the application, driver, executor and node.
- Create visualizations to monitor, measure, and analyze usage trends and key data, deriving business insights.
- Create alerts to reduce the MTTD and MTTR by referencing relevant logs when troubleshooting an issue.
This integration has been tested against Apache Spark version 3.5.0.
The Apache Spark integration collects metrics data.
Metrics provide insight into the statistics of Apache Spark. The Metric data streams collected by the Apache Spark integration include application, driver, executor, and node, allowing users to monitor and troubleshoot the performance of their Apache Spark instance.
Data streams:
application: Collects information related to the number of cores used, application name, runtime in milliseconds and current status of the application.driver: Collects information related to the driver details, job durations, task execution, memory usage, executor status and JVM metrics.executor: Collects information related to the operations, memory usage, garbage collection, file handling, and threadpool activity.node: Collects information related to the application count, waiting applications, worker metrics, executor count, core usage and memory usage.
Note:
- Users can monitor and view the metrics inside the ingested documents for Apache Spark under the
metrics-*index pattern inDiscover.
You need Elasticsearch for storing and searching your data and Kibana for visualizing and managing it. You can use our hosted Elasticsearch Service on Elastic Cloud, which is recommended, or self-manage the Elastic Stack on your own hardware.
To ingest data from Apache Spark, you must know the full hosts for the Main and Worker nodes.
To proceed with the Jolokia setup, Apache Spark should be installed as a standalone setup. Make sure that the spark folder is installed in the /usr/local path. If not, then specify the path of spark folder in the further steps. You can install the standalone setup from the official download page of Apache Spark.
To gather Spark statistics, we need to download and enable Jolokia JVM Agent.
cd /usr/share/java/
wget -O jolokia-agent.jar http://search.maven.org/remotecontent?filepath=org/jolokia/jolokia-jvm/1.3.6/jolokia-jvm-1.3.6-agent.jar
As far, as Jolokia JVM Agent is downloaded, we should configure Apache Spark, to use it as JavaAgent and expose metrics via HTTP/JSON. Edit spark-env.sh. It should be in /usr/local/spark/conf and add following parameters (Assuming that spark install folder is /usr/local/spark, if not change the path to one on which Spark is installed):
export SPARK_MASTER_OPTS="$SPARK_MASTER_OPTS -javaagent:/usr/share/java/jolokia-agent.jar=config=/usr/local/spark/conf/jolokia-master.properties"
Now, create /usr/local/spark/conf/jolokia-master.properties file with following content:
host=0.0.0.0
port=7777
agentContext=/jolokia
backlog=100

policyLocation=file:///usr/local/spark/conf/jolokia.policy
historyMaxEntries=10
debug=false
debugMaxEntries=100
maxDepth=15
maxCollectionSize=1000
maxObjects=0
Now we need to create /usr/local/spark/conf/jolokia.policy with following content:
<?xml version="1.0" encoding="utf-8"?>
<restrict>
  <http>
    <method>get</method>
    <method>post</method>
  </http>
  <commands>
    <command>read</command>
  </commands>
</restrict>
Configure Agent with following in conf/bigdata.ini file:
[Spark-Master]
stats: http://127.0.0.1:7777/jolokia/read
Restart Spark master.
Follow the same set of steps for Spark Worker, Driver and Executor.
For step-by-step instructions on how to set up an integration, refer to the Getting Started.
After the integration is successfully configured, click on the Assets tab of the Apache Spark Integration to display the available dashboards. Select the dashboard for your configured data stream, which should be populated with the required data.
If host.ip appears conflicted under the metrics-* data view, this issue can be resolved by reindexing the Application, Driver, Executor and Node data stream.
The application data stream collects metrics related to the number of cores used, application name, runtime in milliseconds, and current status of the application.
Example
{
    "@timestamp": "2023-09-28T09:24:33.812Z",
    "agent": {
        "ephemeral_id": "20d060ec-da41-4f14-a187-d020b9fbec7d",
        "id": "a6bdbb4a-4bac-4243-83cb-dba157f24987",
        "name": "docker-fleet-agent",
        "type": "metricbeat",
        "version": "8.8.0"
    },
    "apache_spark": {
        "application": {
            "cores": 8,
            "mbean": "metrics:name=application.PythonWordCount.1695893057562.cores,type=gauges",
            "name": "PythonWordCount.1695893057562"
        }
    },
    "data_stream": {
        "dataset": "apache_spark.application",
        "namespace": "ep",
        "type": "metrics"
    },
    "ecs": {
        "version": "8.11.0"
    },
    "elastic_agent": {
        "id": "a6bdbb4a-4bac-4243-83cb-dba157f24987",
        "snapshot": false,
        "version": "8.8.0"
    },
    "event": {
        "agent_id_status": "verified",
        "dataset": "apache_spark.application",
        "duration": 23828342,
        "ingested": "2023-09-28T09:24:37Z",
        "kind": "metric",
        "module": "apache_spark",
        "type": [
            "info"
        ]
    },
    "host": {
        "architecture": "x86_64",
        "containerized": true,
        "hostname": "docker-fleet-agent",
        "id": "e8978f2086c14e13b7a0af9ed0011d19",
        "ip": [
            "172.20.0.7"
        ],
        "mac": [
            "02-42-C0-A8-F5-07"
        ],
        "name": "docker-fleet-agent",
        "os": {
            "codename": "focal",
            "family": "debian",
            "kernel": "3.10.0-1160.90.1.el7.x86_64",
            "name": "Ubuntu",
            "platform": "ubuntu",
            "type": "linux",
            "version": "20.04.6 LTS (Focal Fossa)"
        }
    },
    "metricset": {
        "name": "jmx",
        "period": 60000
    },
    "service": {
        "address": "http://apache-spark-main:7777/jolokia/%3FignoreErrors=true&canonicalNaming=false",
        "type": "jolokia"
    }
}
ECS Field Reference
Refer to the following document for detailed information on ECS fields.
Exported fields
| Field | Description | Type | Metric Type |
|---|---|---|---|
| @timestamp | Event timestamp. | date | |
| agent.id | Unique identifier of this agent (if one exists). Example: For Beats this would be beat.id. | keyword | |
| apache_spark.application.cores | Number of cores. | long | gauge |
| apache_spark.application.mbean | The name of the jolokia mbean. | keyword | |
| apache_spark.application.name | Name of the application. | keyword | |
| apache_spark.application.runtime.ms | Time taken to run the application (ms). | long | gauge |
| apache_spark.application.status | Current status of the application. | keyword | |
| cloud.account.id | The cloud account or organization id used to identify different entities in a multi-tenant environment. Examples: AWS account id, Google Cloud ORG Id, or other unique identifier. | keyword | |
| cloud.availability_zone | Availability zone in which this host, resource, or service is located. | keyword | |
| cloud.instance.id | Instance ID of the host machine. | keyword | |
| cloud.provider | Name of the cloud provider. Example values are aws, azure, gcp, or digitalocean. | keyword | |
| cloud.region | Region in which this host, resource, or service is located. | keyword | |
| container.id | Unique container id. | keyword | |
| data_stream.dataset | Data stream dataset. | constant_keyword | |
| data_stream.namespace | Data stream namespace. | constant_keyword | |
| data_stream.type | Data stream type. | constant_keyword | |
| host.name | Name of the host. It can contain what hostname returns on Unix systems, the fully qualified domain name (FQDN), or a name specified by the user. The recommended value is the lowercase FQDN of the host. | keyword | |
| service.address | Address where data about this service was collected from. This should be a URI, network address (ipv4:port or [ipv6]:port) or a resource path (sockets). | keyword |
The driver data stream collects metrics related to the driver details, job durations, task execution, memory usage, executor status, and JVM metrics.
Example
{
    "@timestamp": "2023-09-29T12:04:40.050Z",
    "agent": {
        "ephemeral_id": "e3534e18-b92f-4b1b-bd39-43ff9c8849d4",
        "id": "a76f5e50-2a98-4b96-80f6-026ad822e3e8",
        "name": "docker-fleet-agent",
        "type": "metricbeat",
        "version": "8.8.0"
    },
    "apache_spark": {
        "driver": {
            "application_name": "app-20230929120427-0000",
            "jvm": {
                "cpu": {
                    "time": 25730000000
                }
            },
            "mbean": "metrics:name=app-20230929120427-0000.driver.JVMCPU.jvmCpuTime,type=gauges"
        }
    },
    "data_stream": {
        "dataset": "apache_spark.driver",
        "namespace": "ep",
        "type": "metrics"
    },
    "ecs": {
        "version": "8.11.0"
    },
    "elastic_agent": {
        "id": "a76f5e50-2a98-4b96-80f6-026ad822e3e8",
        "snapshot": false,
        "version": "8.8.0"
    },
    "event": {
        "agent_id_status": "verified",
        "dataset": "apache_spark.driver",
        "duration": 177706950,
        "ingested": "2023-09-29T12:04:41Z",
        "kind": "metric",
        "module": "apache_spark",
        "type": [
            "info"
        ]
    },
    "host": {
        "architecture": "x86_64",
        "containerized": true,
        "hostname": "docker-fleet-agent",
        "id": "e8978f2086c14e13b7a0af9ed0011d19",
        "ip": [
            "172.26.0.7"
        ],
        "mac": [
            "02-42-AC-1A-00-07"
        ],
        "name": "docker-fleet-agent",
        "os": {
            "codename": "focal",
            "family": "debian",
            "kernel": "3.10.0-1160.90.1.el7.x86_64",
            "name": "Ubuntu",
            "platform": "ubuntu",
            "type": "linux",
            "version": "20.04.6 LTS (Focal Fossa)"
        }
    },
    "metricset": {
        "name": "jmx",
        "period": 60000
    },
    "service": {
        "address": "http://apache-spark-main:7779/jolokia/%3FignoreErrors=true&canonicalNaming=false",
        "type": "jolokia"
    }
}
ECS Field Reference
Refer to the following document for detailed information on ECS fields.
Exported fields
| Field | Description | Type | Metric Type |
|---|---|---|---|
| @timestamp | Event timestamp. | date | |
| agent.id | Unique identifier of this agent (if one exists). Example: For Beats this would be beat.id. | keyword | |
| apache_spark.driver.application_name | Name of the application. | keyword | |
| apache_spark.driver.dag_scheduler.job.active | Number of active jobs. | long | gauge |
| apache_spark.driver.dag_scheduler.job.all | Total number of jobs. | long | gauge |
| apache_spark.driver.dag_scheduler.stages.failed | Number of failed stages. | long | gauge |
| apache_spark.driver.dag_scheduler.stages.running | Number of running stages. | long | gauge |
| apache_spark.driver.dag_scheduler.stages.waiting | Number of waiting stages | long | gauge |
| apache_spark.driver.disk.space_used | Amount of the disk space utilized in MB. | long | gauge |
| apache_spark.driver.executor_metrics.gc.major.count | Total major GC count. For example, the garbage collector is one of MarkSweepCompact, PS MarkSweep, ConcurrentMarkSweep, G1 Old Generation and so on. | long | gauge |
| apache_spark.driver.executor_metrics.gc.major.time | Elapsed total major GC time. The value is expressed in milliseconds. | long | gauge |
| apache_spark.driver.executor_metrics.gc.minor.count | Total minor GC count. For example, the garbage collector is one of Copy, PS Scavenge, ParNew, G1 Young Generation and so on. | long | gauge |
| apache_spark.driver.executor_metrics.gc.minor.time | Elapsed total minor GC time. The value is expressed in milliseconds. | long | gauge |
| apache_spark.driver.executor_metrics.heap_memory.off.execution | Peak off heap execution memory in use, in bytes. | long | gauge |
| apache_spark.driver.executor_metrics.heap_memory.off.storage | Peak off heap storage memory in use, in bytes. | long | gauge |
| apache_spark.driver.executor_metrics.heap_memory.off.unified | Peak off heap memory (execution and storage). | long | gauge |
| apache_spark.driver.executor_metrics.heap_memory.on.execution | Peak on heap execution memory in use, in bytes. | long | gauge |
| apache_spark.driver.executor_metrics.heap_memory.on.storage | Peak on heap storage memory in use, in bytes. | long | gauge |
| apache_spark.driver.executor_metrics.heap_memory.on.unified | Peak on heap memory (execution and storage). | long | gauge |
| apache_spark.driver.executor_metrics.memory.direct_pool | Peak memory that the JVM is using for direct buffer pool. | long | gauge |
| apache_spark.driver.executor_metrics.memory.jvm.heap | Peak memory usage of the heap that is used for object allocation. | long | counter |
| apache_spark.driver.executor_metrics.memory.jvm.off_heap | Peak memory usage of non-heap memory that is used by the Java virtual machine. | long | counter |
| apache_spark.driver.executor_metrics.memory.mapped_pool | Peak memory that the JVM is using for mapped buffer pool | long | gauge |
| apache_spark.driver.executor_metrics.process_tree.jvm.rss_memory | Resident Set Size: number of pages the process has in real memory. This is just the pages which count toward text, data, or stack space. This does not include pages which have not been demand-loaded in, or which are swapped out. | long | gauge |
| apache_spark.driver.executor_metrics.process_tree.jvm.v_memory | Virtual memory size in bytes. | long | gauge |
| apache_spark.driver.executor_metrics.process_tree.other.rss_memory | long | gauge | |
| apache_spark.driver.executor_metrics.process_tree.other.v_memory | long | gauge | |
| apache_spark.driver.executor_metrics.process_tree.python.rss_memory | long | gauge | |
| apache_spark.driver.executor_metrics.process_tree.python.v_memory | long | gauge | |
| apache_spark.driver.executors.all | Total number of executors. | long | gauge |
| apache_spark.driver.executors.decommission_unfinished | Total number of decommissioned unfinished executors. | long | counter |
| apache_spark.driver.executors.exited_unexpectedly | Total number of executors exited unexpectedly. | long | counter |
| apache_spark.driver.executors.gracefully_decommissioned | Total number of executors gracefully decommissioned. | long | counter |
| apache_spark.driver.executors.killed_by_driver | Total number of executors killed by driver. | long | counter |
| apache_spark.driver.executors.max_needed | Maximum number of executors needed. | long | gauge |
| apache_spark.driver.executors.pending_to_remove | Total number of executors pending to be removed. | long | gauge |
| apache_spark.driver.executors.target | Total number of target executors. | long | gauge |
| apache_spark.driver.executors.to_add | Total number of executors to be added. | long | gauge |
| apache_spark.driver.hive_external_catalog.file_cache_hits | Total number of file cache hits. | long | counter |
| apache_spark.driver.hive_external_catalog.files_discovered | Total number of files discovered. | long | counter |
| apache_spark.driver.hive_external_catalog.hive_client_calls | Total number of Hive Client calls. | long | counter |
| apache_spark.driver.hive_external_catalog.parallel_listing_job.count | Number of jobs running parallely. | long | counter |
| apache_spark.driver.hive_external_catalog.partitions_fetched | Number of partitions fetched. | long | counter |
| apache_spark.driver.job_duration | Duration of the job. | long | gauge |
| apache_spark.driver.jobs.failed | Number of failed jobs. | long | counter |
| apache_spark.driver.jobs.succeeded | Number of successful jobs. | long | counter |
| apache_spark.driver.jvm.cpu.time | Elapsed CPU time the JVM spent. | long | gauge |
| apache_spark.driver.mbean | The name of the jolokia mbean. | keyword | |
| apache_spark.driver.memory.max_mem | Maximum amount of memory available for storage, in MB. | long | gauge |
| apache_spark.driver.memory.off_heap.max | Maximum amount of off heap memory available, in MB. | long | gauge |
| apache_spark.driver.memory.off_heap.remaining | Remaining amount of off heap memory, in MB. | long | gauge |
| apache_spark.driver.memory.off_heap.used | Total amount of off heap memory used, in MB. | long | gauge |
| apache_spark.driver.memory.on_heap.max | Maximum amount of on heap memory available, in MB. | long | gauge |
| apache_spark.driver.memory.on_heap.remaining | Remaining amount of on heap memory, in MB. | long | gauge |
| apache_spark.driver.memory.on_heap.used | Total amount of on heap memory used, in MB. | long | gauge |
| apache_spark.driver.memory.remaining | Remaining amount of storage memory, in MB. | long | gauge |
| apache_spark.driver.memory.used | Total amount of memory used for storage, in MB. | long | gauge |
| apache_spark.driver.spark.streaming.event_time.watermark | long | gauge | |
| apache_spark.driver.spark.streaming.input_rate.total | Total rate of the input. | double | gauge |
| apache_spark.driver.spark.streaming.latency | long | gauge | |
| apache_spark.driver.spark.streaming.processing_rate.total | Total rate of processing. | double | gauge |
| apache_spark.driver.spark.streaming.states.rows.total | Total number of rows. | long | gauge |
| apache_spark.driver.spark.streaming.states.used_bytes | Total number of bytes utilized. | long | gauge |
| apache_spark.driver.stages.completed_count | Total number of completed stages. | long | counter |
| apache_spark.driver.stages.failed_count | Total number of failed stages. | long | counter |
| apache_spark.driver.stages.skipped_count | Total number of skipped stages. | long | counter |
| apache_spark.driver.tasks.completed | Number of completed tasks. | long | counter |
| apache_spark.driver.tasks.executors.black_listed | Number of blacklisted executors for the tasks. | long | counter |
| apache_spark.driver.tasks.executors.excluded | Number of excluded executors for the tasks. | long | counter |
| apache_spark.driver.tasks.executors.unblack_listed | Number of unblacklisted executors for the tasks. | long | counter |
| apache_spark.driver.tasks.executors.unexcluded | Number of unexcluded executors for the tasks. | long | counter |
| apache_spark.driver.tasks.failed | Number of failed tasks. | long | counter |
| apache_spark.driver.tasks.killed | Number of killed tasks. | long | counter |
| apache_spark.driver.tasks.skipped | Number of skipped tasks. | long | counter |
| cloud.account.id | The cloud account or organization id used to identify different entities in a multi-tenant environment. Examples: AWS account id, Google Cloud ORG Id, or other unique identifier. | keyword | |
| cloud.availability_zone | Availability zone in which this host, resource, or service is located. | keyword | |
| cloud.instance.id | Instance ID of the host machine. | keyword | |
| cloud.provider | Name of the cloud provider. Example values are aws, azure, gcp, or digitalocean. | keyword | |
| cloud.region | Region in which this host, resource, or service is located. | keyword | |
| container.id | Unique container id. | keyword | |
| data_stream.dataset | Data stream dataset. | constant_keyword | |
| data_stream.namespace | Data stream namespace. | constant_keyword | |
| data_stream.type | Data stream type. | constant_keyword | |
| host.name | Name of the host. It can contain what hostname returns on Unix systems, the fully qualified domain name (FQDN), or a name specified by the user. The recommended value is the lowercase FQDN of the host. | keyword | |
| service.address | Address where data about this service was collected from. This should be a URI, network address (ipv4:port or [ipv6]:port) or a resource path (sockets). | keyword |
The executor data stream collects metrics related to the operations, memory usage, garbage collection, file handling, and threadpool activity.
Example
{
    "@timestamp": "2023-09-28T09:26:45.771Z",
    "agent": {
        "ephemeral_id": "3a3db920-eb4b-4045-b351-33526910ae8a",
        "id": "a6bdbb4a-4bac-4243-83cb-dba157f24987",
        "name": "docker-fleet-agent",
        "type": "metricbeat",
        "version": "8.8.0"
    },
    "apache_spark": {
        "executor": {
            "application_name": "app-20230928092630-0000",
            "id": "0",
            "jvm": {
                "cpu_time": 20010000000
            },
            "mbean": "metrics:name=app-20230928092630-0000.0.JVMCPU.jvmCpuTime,type=gauges"
        }
    },
    "data_stream": {
        "dataset": "apache_spark.executor",
        "namespace": "ep",
        "type": "metrics"
    },
    "ecs": {
        "version": "8.11.0"
    },
    "elastic_agent": {
        "id": "a6bdbb4a-4bac-4243-83cb-dba157f24987",
        "snapshot": false,
        "version": "8.8.0"
    },
    "event": {
        "agent_id_status": "verified",
        "dataset": "apache_spark.executor",
        "duration": 2849184715,
        "ingested": "2023-09-28T09:26:49Z",
        "kind": "metric",
        "module": "apache_spark",
        "type": [
            "info"
        ]
    },
    "host": {
        "architecture": "x86_64",
        "containerized": true,
        "hostname": "docker-fleet-agent",
        "id": "e8978f2086c14e13b7a0af9ed0011d19",
        "ip": [
            "172.20.0.7"
        ],
        "mac": [
            "02-42-AC-14-00-07"
        ],
        "name": "docker-fleet-agent",
        "os": {
            "codename": "focal",
            "family": "debian",
            "kernel": "3.10.0-1160.90.1.el7.x86_64",
            "name": "Ubuntu",
            "platform": "ubuntu",
            "type": "linux",
            "version": "20.04.6 LTS (Focal Fossa)"
        }
    },
    "metricset": {
        "name": "jmx",
        "period": 60000
    },
    "service": {
        "address": "http://apache-spark-main:7780/jolokia/%3FignoreErrors=true&canonicalNaming=false",
        "type": "jolokia"
    }
}
ECS Field Reference
Refer to the following document for detailed information on ECS fields.
Exported fields
| Field | Description | Type | Metric Type |
|---|---|---|---|
| @timestamp | Event timestamp. | date | |
| agent.id | Unique identifier of this agent (if one exists). Example: For Beats this would be beat.id. | keyword | |
| apache_spark.executor.application_name | Name of application. | keyword | |
| apache_spark.executor.bytes.read | Total number of bytes read. | long | counter |
| apache_spark.executor.bytes.written | Total number of bytes written. | long | counter |
| apache_spark.executor.disk_bytes_spilled | Total number of disk bytes spilled. | long | counter |
| apache_spark.executor.file_cache_hits | Total number of file cache hits. | long | counter |
| apache_spark.executor.files_discovered | Total number of files discovered. | long | counter |
| apache_spark.executor.filesystem.file.large_read_ops | Total number of large read operations from the files. | long | gauge |
| apache_spark.executor.filesystem.file.read_bytes | Total number of bytes read from the files. | long | gauge |
| apache_spark.executor.filesystem.file.read_ops | Total number of read operations from the files. | long | gauge |
| apache_spark.executor.filesystem.file.write_bytes | Total number of bytes written from the files. | long | gauge |
| apache_spark.executor.filesystem.file.write_ops | Total number of write operations from the files. | long | gauge |
| apache_spark.executor.filesystem.hdfs.large_read_ops | Total number of large read operations from HDFS. | long | gauge |
| apache_spark.executor.filesystem.hdfs.read_bytes | Total number of read bytes from HDFS. | long | gauge |
| apache_spark.executor.filesystem.hdfs.read_ops | Total number of read operations from HDFS. | long | gauge |
| apache_spark.executor.filesystem.hdfs.write_bytes | Total number of write bytes from HDFS. | long | gauge |
| apache_spark.executor.filesystem.hdfs.write_ops | Total number of write operations from HDFS. | long | gauge |
| apache_spark.executor.gc.major.count | Total major GC count. For example, the garbage collector is one of MarkSweepCompact, PS MarkSweep, ConcurrentMarkSweep, G1 Old Generation and so on. | long | gauge |
| apache_spark.executor.gc.major.time | Elapsed total major GC time. The value is expressed in milliseconds. | long | gauge |
| apache_spark.executor.gc.minor.count | Total minor GC count. For example, the garbage collector is one of Copy, PS Scavenge, ParNew, G1 Young Generation and so on. | long | gauge |
| apache_spark.executor.gc.minor.time | Elapsed total minor GC time. The value is expressed in milliseconds. | long | gauge |
| apache_spark.executor.heap_memory.off.execution | Peak off heap execution memory in use, in bytes. | long | gauge |
| apache_spark.executor.heap_memory.off.storage | Peak off heap storage memory in use, in bytes. | long | gauge |
| apache_spark.executor.heap_memory.off.unified | Peak off heap memory (execution and storage). | long | gauge |
| apache_spark.executor.heap_memory.on.execution | Peak on heap execution memory in use, in bytes. | long | gauge |
| apache_spark.executor.heap_memory.on.storage | Peak on heap storage memory in use, in bytes. | long | gauge |
| apache_spark.executor.heap_memory.on.unified | Peak on heap memory (execution and storage). | long | gauge |
| apache_spark.executor.hive_client_calls | Total number of Hive Client calls. | long | counter |
| apache_spark.executor.id | ID of executor. | keyword | |
| apache_spark.executor.jvm.cpu_time | Elapsed CPU time the JVM spent. | long | gauge |
| apache_spark.executor.jvm.gc_time | Elapsed time the JVM spent in garbage collection while executing this task. | long | counter |
| apache_spark.executor.mbean | The name of the jolokia mbean. | keyword | |
| apache_spark.executor.memory.direct_pool | Peak memory that the JVM is using for direct buffer pool. | long | gauge |
| apache_spark.executor.memory.jvm.heap | Peak memory usage of the heap that is used for object allocation. | long | gauge |
| apache_spark.executor.memory.jvm.off_heap | Peak memory usage of non-heap memory that is used by the Java virtual machine. | long | gauge |
| apache_spark.executor.memory.mapped_pool | Peak memory that the JVM is using for mapped buffer pool | long | gauge |
| apache_spark.executor.memory_bytes_spilled | The number of in-memory bytes spilled by this task. | long | counter |
| apache_spark.executor.parallel_listing_job_count | Number of jobs running parallely. | long | counter |
| apache_spark.executor.partitions_fetched | Number of partitions fetched. | long | counter |
| apache_spark.executor.process_tree.jvm.rss_memory | Resident Set Size: number of pages the process has in real memory. This is just the pages which count toward text, data, or stack space. This does not include pages which have not been demand-loaded in, or which are swapped out. | long | gauge |
| apache_spark.executor.process_tree.jvm.v_memory | Virtual memory size in bytes. | long | gauge |
| apache_spark.executor.process_tree.other.rss_memory | Resident Set Size for other kind of process. | long | gauge |
| apache_spark.executor.process_tree.other.v_memory | Virtual memory size for other kind of process in bytes. | long | gauge |
| apache_spark.executor.process_tree.python.rss_memory | Resident Set Size for Python. | long | gauge |
| apache_spark.executor.process_tree.python.v_memory | Virtual memory size for Python in bytes. | long | gauge |
| apache_spark.executor.records.read | Total number of records read. | long | counter |
| apache_spark.executor.records.written | Total number of records written. | long | counter |
| apache_spark.executor.result.serialization_time | Elapsed time spent serializing the task result. The value is expressed in milliseconds. | long | counter |
| apache_spark.executor.result.size | The number of bytes this task transmitted back to the driver as the TaskResult. | long | counter |
| apache_spark.executor.run_time | Elapsed time in the running this task | long | counter |
| apache_spark.executor.shuffle.bytes_written | Number of bytes written in shuffle operations. | long | counter |
| apache_spark.executor.shuffle.client.used.direct_memory | Amount of direct memory used by the shuffle client. | long | gauge |
| apache_spark.executor.shuffle.client.used.heap_memory | Amount of heap memory used by the shuffle client. | long | gauge |
| apache_spark.executor.shuffle.fetch_wait_time | Time the task spent waiting for remote shuffle blocks. | long | counter |
| apache_spark.executor.shuffle.local.blocks_fetched | Number of local (as opposed to read from a remote executor) blocks fetched in shuffle operations. | long | counter |
| apache_spark.executor.shuffle.local.bytes_read | Number of bytes read in shuffle operations from local disk (as opposed to read from a remote executor). | long | counter |
| apache_spark.executor.shuffle.records.read | Number of records read in shuffle operations. | long | counter |
| apache_spark.executor.shuffle.records.written | Number of records written in shuffle operations. | long | counter |
| apache_spark.executor.shuffle.remote.blocks_fetched | Number of remote blocks fetched in shuffle operations. | long | counter |
| apache_spark.executor.shuffle.remote.bytes_read | Number of remote bytes read in shuffle operations. | long | counter |
| apache_spark.executor.shuffle.remote.bytes_read_to_disk | Number of remote bytes read to disk in shuffle operations. Large blocks are fetched to disk in shuffle read operations, as opposed to being read into memory, which is the default behavior. | long | counter |
| apache_spark.executor.shuffle.server.used.direct_memory | Amount of direct memory used by the shuffle server. | long | gauge |
| apache_spark.executor.shuffle.server.used.heap_memory | Amount of heap memory used by the shuffle server. | long | counter |
| apache_spark.executor.shuffle.total.bytes_read | Number of bytes read in shuffle operations (both local and remote) | long | counter |
| apache_spark.executor.shuffle.write.time | Time spent blocking on writes to disk or buffer cache. The value is expressed in nanoseconds. | long | counter |
| apache_spark.executor.succeeded_tasks | The number of tasks succeeded. | long | counter |
| apache_spark.executor.threadpool.active_tasks | Number of tasks currently executing. | long | gauge |
| apache_spark.executor.threadpool.complete_tasks | Number of tasks that have completed in this executor. | long | gauge |
| apache_spark.executor.threadpool.current_pool_size | The size of the current thread pool of the executor. | long | gauge |
| apache_spark.executor.threadpool.max_pool_size | The maximum size of the thread pool of the executor. | long | counter |
| apache_spark.executor.threadpool.started_tasks | The number of tasks started in the thread pool of the executor. | long | counter |
| cloud.account.id | The cloud account or organization id used to identify different entities in a multi-tenant environment. Examples: AWS account id, Google Cloud ORG Id, or other unique identifier. | keyword | |
| cloud.availability_zone | Availability zone in which this host, resource, or service is located. | keyword | |
| cloud.instance.id | Instance ID of the host machine. | keyword | |
| cloud.provider | Name of the cloud provider. Example values are aws, azure, gcp, or digitalocean. | keyword | |
| cloud.region | Region in which this host, resource, or service is located. | keyword | |
| container.id | Unique container id. | keyword | |
| data_stream.dataset | Data stream dataset. | constant_keyword | |
| data_stream.namespace | Data stream namespace. | constant_keyword | |
| data_stream.type | Data stream type. | constant_keyword | |
| host.name | Name of the host. It can contain what hostname returns on Unix systems, the fully qualified domain name (FQDN), or a name specified by the user. The recommended value is the lowercase FQDN of the host. | keyword | |
| service.address | Address where data about this service was collected from. This should be a URI, network address (ipv4:port or [ipv6]:port) or a resource path (sockets). | keyword |
The node data stream collects metrics related to the application count, waiting applications, worker metrics, executor count, core usage, and memory usage.
Example
{
    "@timestamp": "2022-04-12T04:42:49.581Z",
    "agent": {
        "ephemeral_id": "ae57925e-eeca-4bf4-ae20-38f82db1378b",
        "id": "f051059f-86be-46d5-896d-ff1b2cdab179",
        "name": "docker-fleet-agent",
        "type": "metricbeat",
        "version": "8.1.0"
    },
    "apache_spark": {
        "node": {
            "main": {
                "applications": {
                    "count": 0,
                    "waiting": 0
                },
                "workers": {
                    "alive": 0,
                    "count": 0
                }
            }
        }
    },
    "data_stream": {
        "dataset": "apache_spark.node",
        "namespace": "ep",
        "type": "metrics"
    },
    "ecs": {
        "version": "8.11.0"
    },
    "elastic_agent": {
        "id": "f051059f-86be-46d5-896d-ff1b2cdab179",
        "snapshot": false,
        "version": "8.1.0"
    },
    "event": {
        "agent_id_status": "verified",
        "dataset": "apache_spark.node",
        "duration": 8321835,
        "ingested": "2022-04-12T04:42:53Z",
        "kind": "metric",
        "module": "apache_spark",
        "type": [
            "info"
        ]
    },
    "host": {
        "architecture": "x86_64",
        "containerized": true,
        "hostname": "docker-fleet-agent",
        "ip": [
            "192.168.32.5"
        ],
        "mac": [
            "02-42-AC-14-00-07"
        ],
        "name": "docker-fleet-agent",
        "os": {
            "codename": "focal",
            "family": "debian",
            "kernel": "5.4.0-107-generic",
            "name": "Ubuntu",
            "platform": "ubuntu",
            "type": "linux",
            "version": "20.04.3 LTS (Focal Fossa)"
        }
    },
    "metricset": {
        "name": "jmx",
        "period": 60000
    },
    "service": {
        "address": "http://apache-spark-main:7777/jolokia/%3FignoreErrors=true&canonicalNaming=false",
        "type": "jolokia"
    }
}
ECS Field Reference
Refer to the following document for detailed information on ECS fields.
Exported fields
| Field | Description | Type | Metric Type |
|---|---|---|---|
| @timestamp | Event timestamp. | date | |
| agent.id | Unique identifier of this agent (if one exists). Example: For Beats this would be beat.id. | keyword | |
| apache_spark.node.main.applications.count | Total number of apps. | long | gauge |
| apache_spark.node.main.applications.waiting | Number of apps waiting. | long | gauge |
| apache_spark.node.main.workers.alive | Number of alive workers. | long | gauge |
| apache_spark.node.main.workers.count | Total number of workers. | long | gauge |
| apache_spark.node.worker.cores.free | Number of cores free. | long | gauge |
| apache_spark.node.worker.cores.used | Number of cores used. | long | gauge |
| apache_spark.node.worker.executors | Number of executors. | long | gauge |
| apache_spark.node.worker.memory.free | Number of cores free. | long | gauge |
| apache_spark.node.worker.memory.used | Amount of memory utilized in MB. | long | gauge |
| cloud.account.id | The cloud account or organization id used to identify different entities in a multi-tenant environment. Examples: AWS account id, Google Cloud ORG Id, or other unique identifier. | keyword | |
| cloud.availability_zone | Availability zone in which this host, resource, or service is located. | keyword | |
| cloud.instance.id | Instance ID of the host machine. | keyword | |
| cloud.provider | Name of the cloud provider. Example values are aws, azure, gcp, or digitalocean. | keyword | |
| cloud.region | Region in which this host, resource, or service is located. | keyword | |
| container.id | Unique container id. | keyword | |
| data_stream.dataset | Data stream dataset. | constant_keyword | |
| data_stream.namespace | Data stream namespace. | constant_keyword | |
| data_stream.type | Data stream type. | constant_keyword | |
| host.name | Name of the host. It can contain what hostname returns on Unix systems, the fully qualified domain name (FQDN), or a name specified by the user. The recommended value is the lowercase FQDN of the host. | keyword | |
| service.address | Address where data about this service was collected from. This should be a URI, network address (ipv4:port or [ipv6]:port) or a resource path (sockets). | keyword |
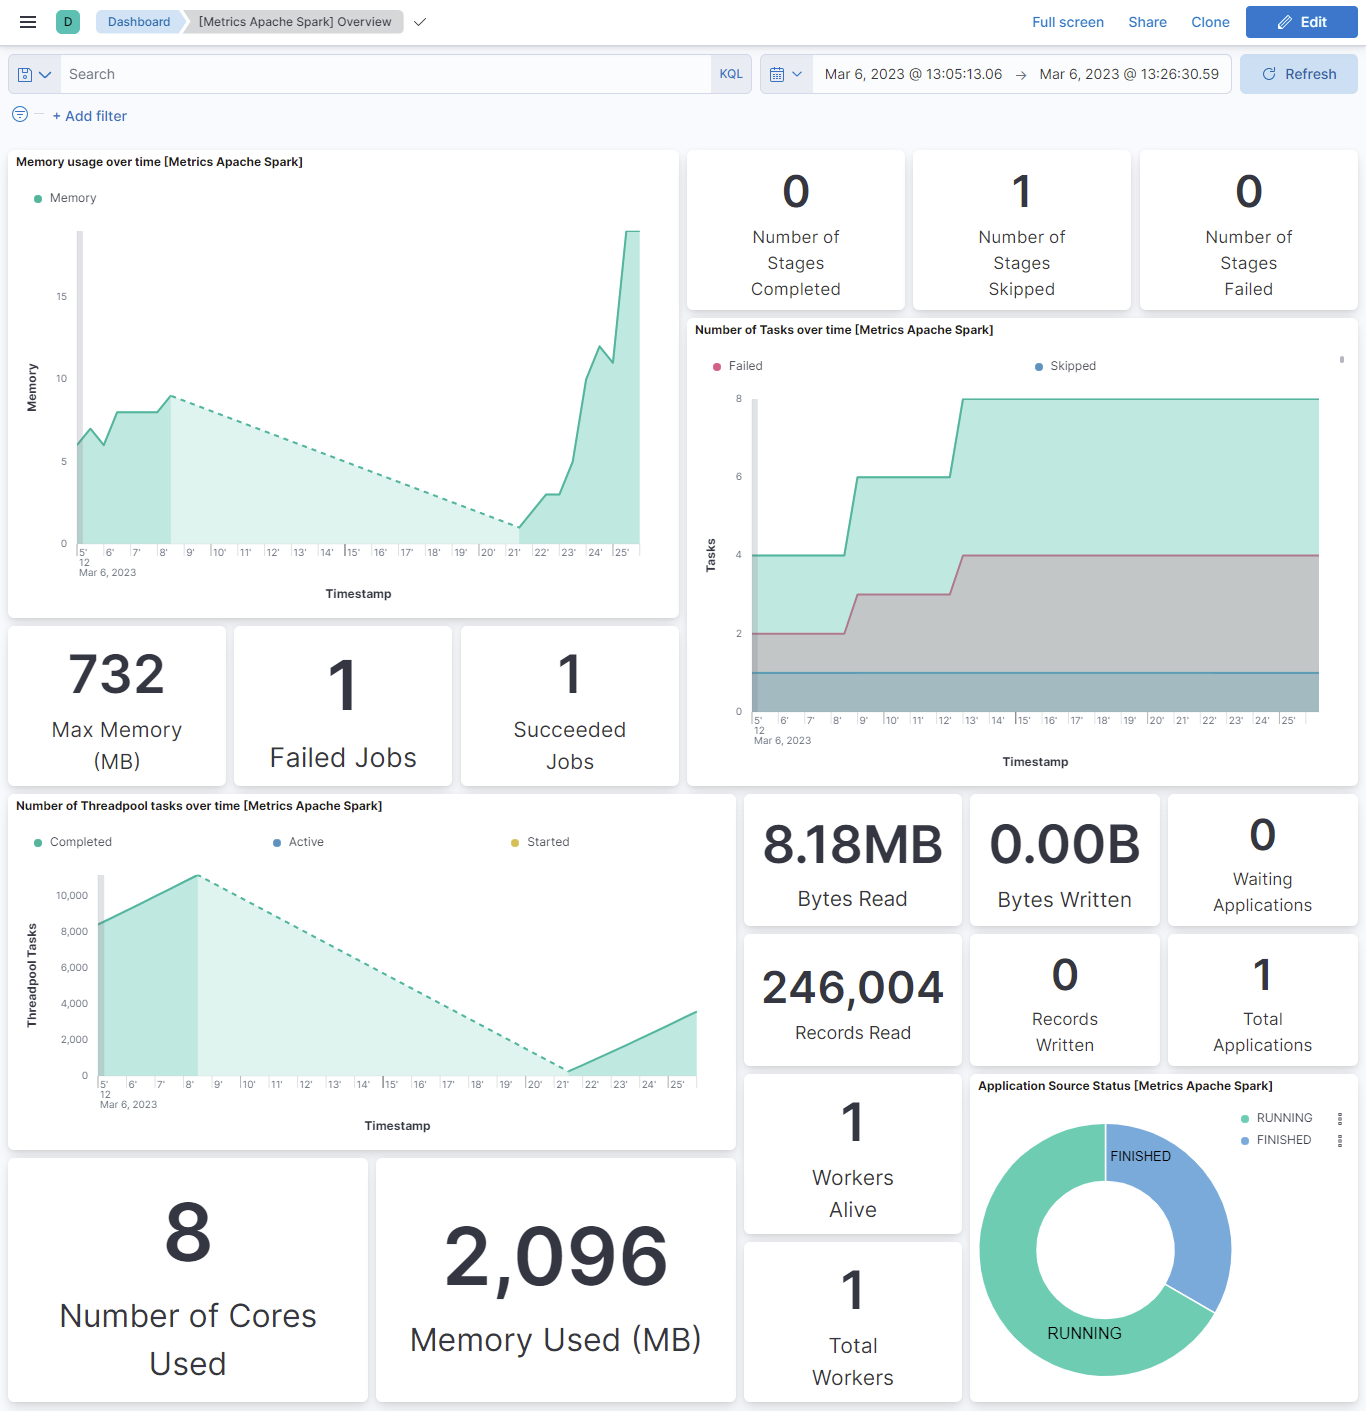
This integration includes one or more Kibana dashboards that visualizes the data collected by the integration. The screenshots below illustrate how the ingested data is displayed.
Changelog
| Version | Details | Minimum Kibana version |
|---|---|---|
| 1.5.2 | Enhancement (View pull request) Add group field to package manifest. |
9.0.0 8.13.0 |
| 1.5.1 | Enhancement (View pull request) Update package title and description to improve clarity of use. |
9.0.0 8.13.0 |
| 1.5.0 | Enhancement (View pull request) Improve documentation to align with new guidelines. |
9.0.0 8.13.0 |
| 1.4.0 | Enhancement (View pull request) Add support for Kibana 9.0.0. |
9.0.0 8.13.0 |
| 1.3.1 | Bug fix (View pull request) Update links to getting started docs |
8.13.0 |
| 1.3.0 | Enhancement (View pull request) Add processor support for application, driver, executor and node data streams. |
8.13.0 |
| 1.2.0 | Enhancement (View pull request) ECS version updated to 8.11.0. Update the kibana constraint to ^8.13.0. Modified the field definitions to remove ECS fields made redundant by the ecs@mappings component template. |
8.13.0 |
| 1.1.0 | Enhancement (View pull request) Add global filter on data_stream.dataset to improve performance. |
8.8.0 |
| 1.0.3 | Enhancement (View pull request) Update README to follow documentation guidelines. |
8.8.0 |
| 1.0.2 | Enhancement (View pull request) Inline "by reference" visualizations |
8.8.0 |
| 1.0.1 | Bug fix (View pull request) Update the link to the correct reindexing procedure. |
8.8.0 |
| 1.0.0 | Enhancement (View pull request) Make Apache Spark GA. |
8.8.0 |
| 0.8.0 | Enhancement (View pull request) Update the package format_version to 3.0.0. |
8.8.0 |
| 0.7.9 | Bug fix (View pull request) Add filters in visualizations. |
8.8.0 |
| 0.7.8 | Enhancement (View pull request) Enable time series data streams for the metrics datasets. This dramatically reduces storage for metrics and is expected to progressively improve query performance. For more details, see https://www.elastic.co/guide/en/elasticsearch/reference/current/tsds.html. |
8.8.0 |
| 0.7.7 | Enhancement (View pull request) Add metric_type for node data stream. |
8.1.0 |
| 0.7.6 | Enhancement (View pull request) Added dimension mapping for Node datastream. |
8.1.0 |
| 0.7.5 | Enhancement (View pull request) Add metric_type mappings for executor data stream. |
8.1.0 |
| 0.7.4 | Enhancement (View pull request) Added dimension mapping for Executor datastream. |
8.1.0 |
| 0.7.3 | Enhancement (View pull request) Add metric_type mapping for driver datastream. |
8.1.0 |
| 0.7.2 | Enhancement (View pull request) Added dimension mapping for driver datastream. |
8.1.0 |
| 0.7.1 | Enhancement (View pull request) Add metric type for application data stream. |
8.1.0 |
| 0.7.0 | Enhancement (View pull request) Added dimension mapping for Application datastream. |
8.1.0 |
| 0.6.4 | Bug fix (View pull request) Fix the metric type of input_rate field for driver datastream. |
8.1.0 |
| 0.6.3 | Enhancement (View pull request) Update Apache Spark logo. |
8.1.0 |
| 0.6.2 | Bug fix (View pull request) Resolve the conflicts in host.ip field |
8.1.0 |
| 0.6.1 | Bug fix (View pull request) Remove incorrect filter from the visualizations |
8.1.0 |
| 0.6.0 | Enhancement (View pull request) Rename ownership from obs-service-integrations to obs-infraobs-integrations |
8.1.0 |
| 0.5.0 | Enhancement (View pull request) Migrate visualizations to lens. |
8.1.0 |
| 0.4.1 | Enhancement (View pull request) Added categories and/or subcategories. |
8.1.0 |
| 0.4.0 | Enhancement (View pull request) Update ECS version to 8.5.1 |
8.1.0 |
| 0.3.0 | Enhancement (View pull request) Update readme |
8.1.0 |
| 0.2.1 | Bug fix (View pull request) Remove unnecessary fields from fields.yml |
8.1.0 |
| 0.2.0 | Enhancement (View pull request) Add dashboards and visualizations |
8.1.0 |
| 0.1.1 | Enhancement (View pull request) Refactor the "nodes" data stream to adjust its name to "node" (singular) |
— |
| 0.1.0 | Enhancement (View pull request) Implement "executor" data stream Enhancement (View pull request) Implement "driver" data stream Enhancement (View pull request) Implement "application" data stream Enhancement (View pull request) Implement "nodes" data stream |
— |