Overview
Elastic Cloud Serverless projects are autoscaled environments, fully managed by Elastic and available on Elastic Cloud. Availability This functionality is generally available and ready for production usage. The Elastic Stack includes Elastic's core products such as Elasticsearch, Kibana, Logstash, and Beats. Availability This functionality is generally available and ready for production usage. Unless stated otherwise on the page, this functionality is available when your Elastic Stack is deployed on Elastic Cloud Hosted, Elastic Cloud Enterprise, Elastic Cloud on Kubernetes, and self-managed environments. This documentation corresponds to the latest patch available for each minor version. If you're not using the latest patch, check the release notes for changes.
Serverless Security
Generally available
Stack
9.0+
Generally available since 9.0
| Version | 8.17.3 (View all) |
| Subscription level What's this? |
Basic |
| Developed by What's this? |
Elastic |
| Required permissions | Root privileges |
| Minimum Kibana version(s) | 9.0.0 8.17.3 |
Universal Profiling provides fleet-wide, whole-system, continuous profiling with zero instrumentation.
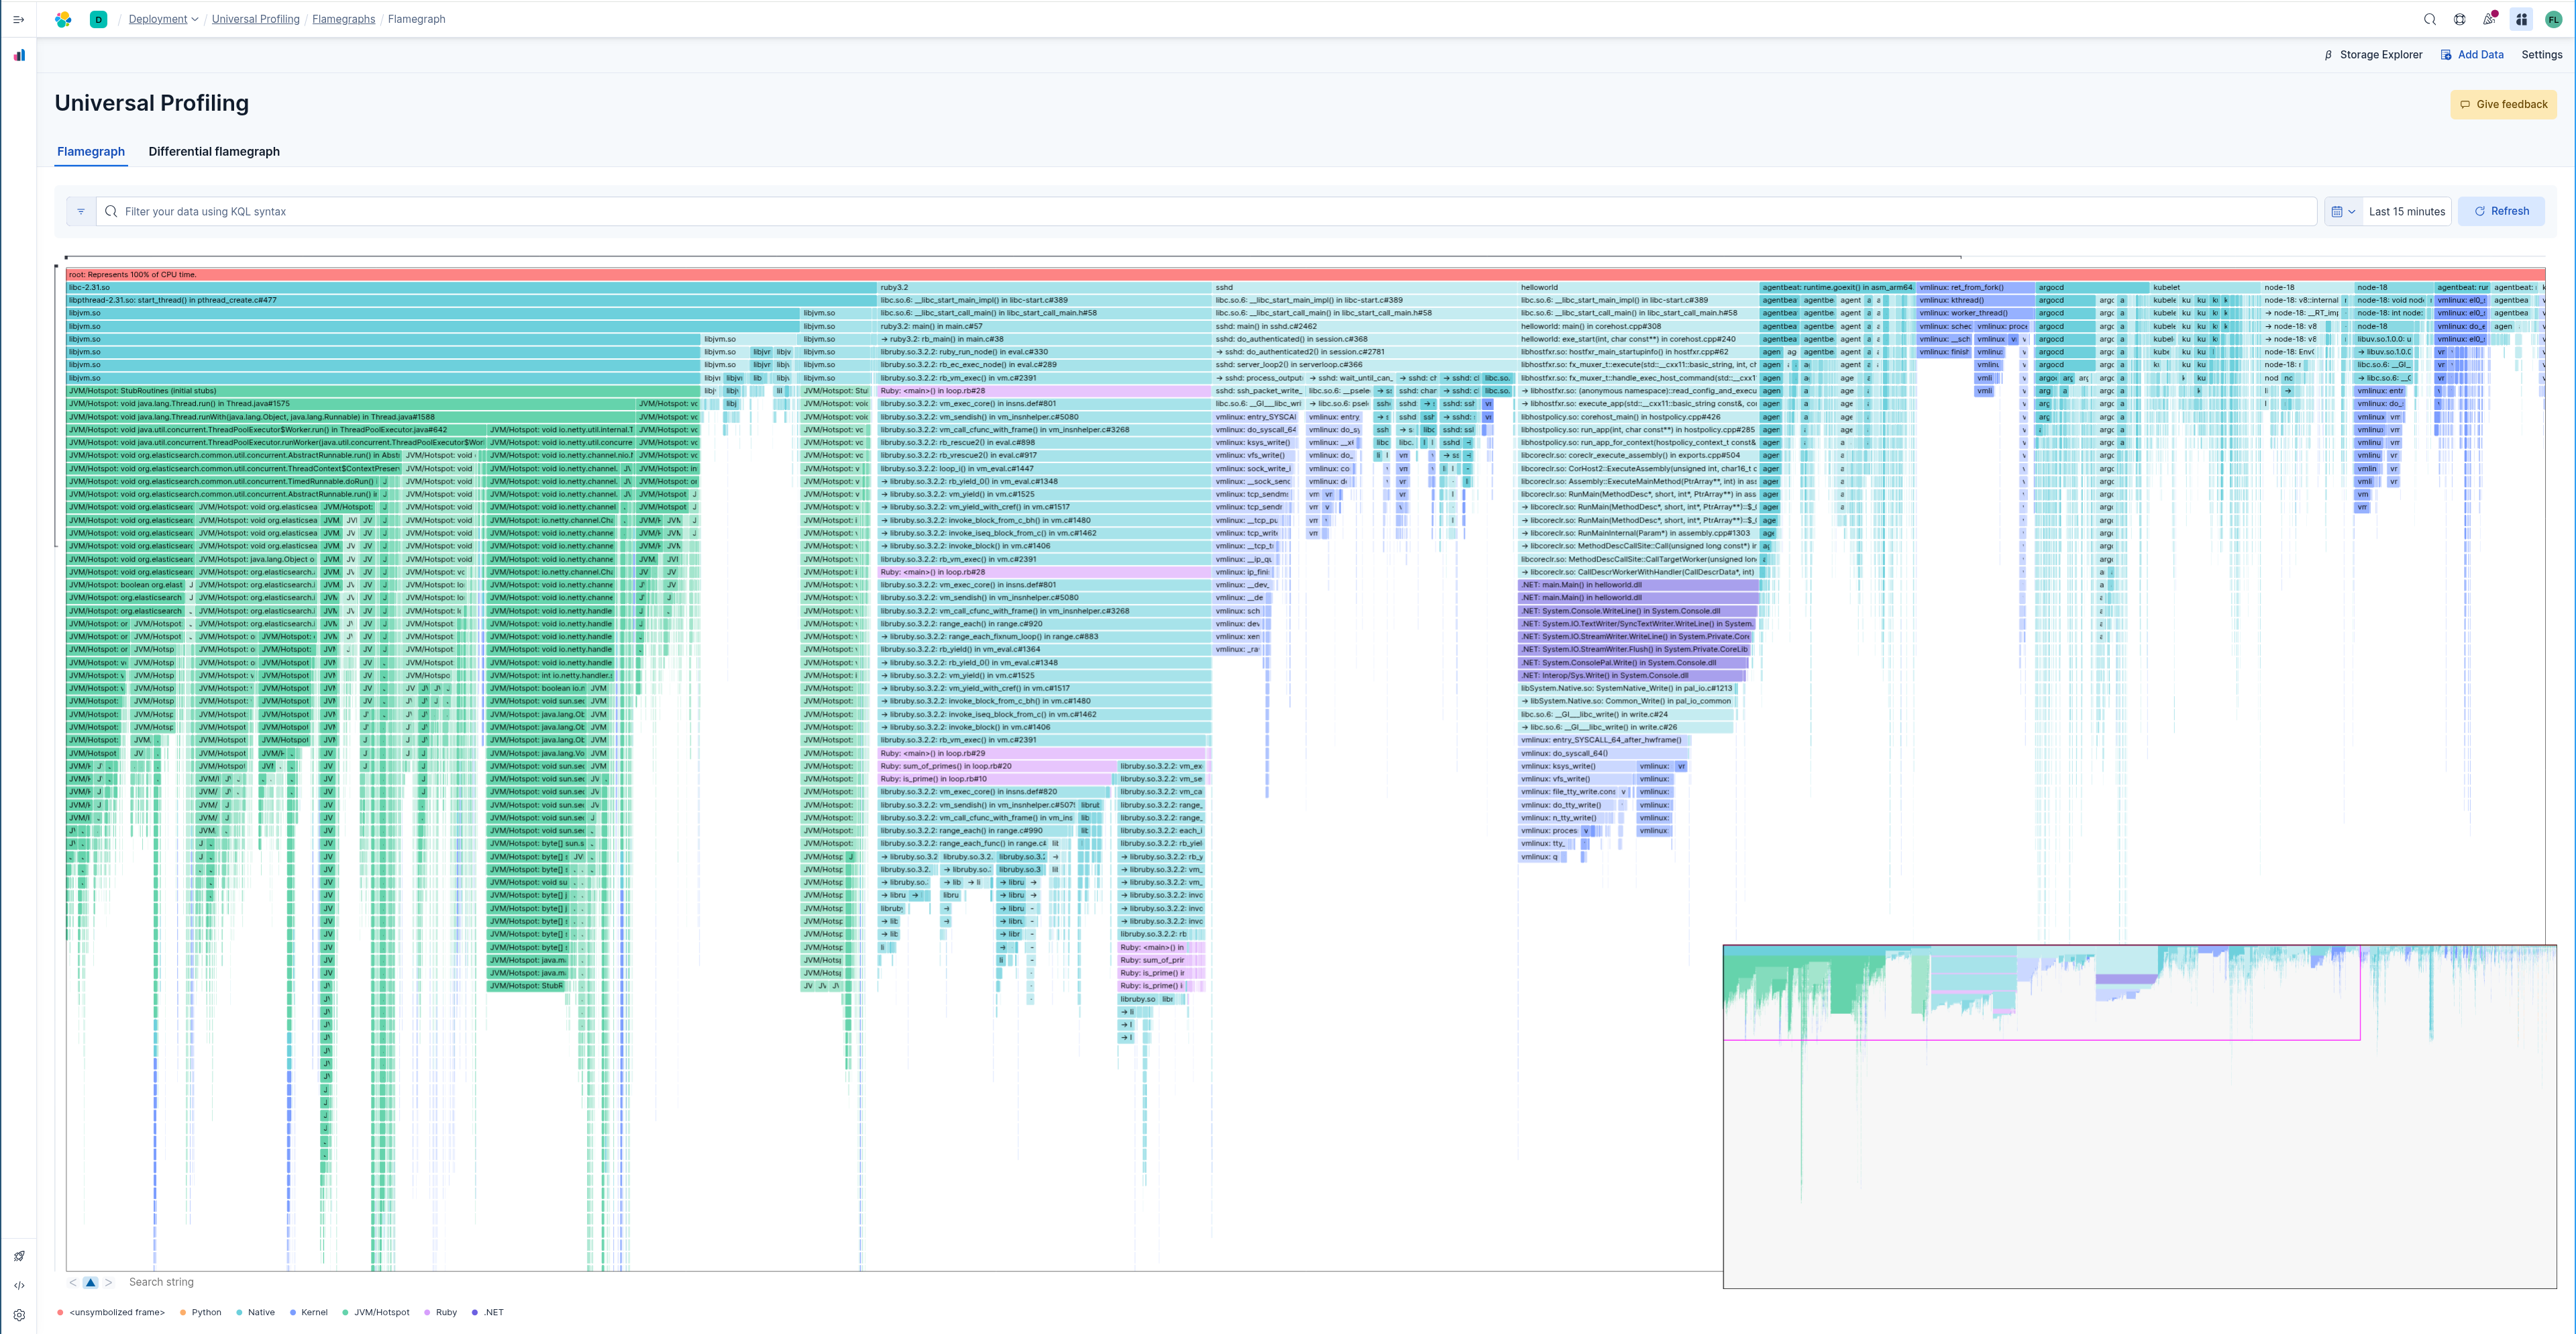
Get a comprehensive understanding of what lines of code are consuming compute resources throughout your entire fleet by visualizing your data in Kibana using the flamegraph, stacktraces, and top functions views.
- The workloads to be profiled must be running on Linux machines; The minimum supported kernel version is either 4.19 for x86_64 or 5.5 for ARM64 machines.
- Elastic Cloud, version 8.10 or higher
Powered by eBPF, Universal Profiling does not require any application source code changes, instrumentation, on-host debug symbols, or other intrusive operations. Just deploy the agent and receive profiling data a few minutes later.
With extremely low overhead, Universal Profiling aims to stay within a budget of 1% of CPU usage and less than 250MB of RAM, meaning that for most workloads, even in production, it can run 24/7 with no noticeable impact on the profiled systems.
Universal Profiling builds stack traces that go from the kernel, through userspace native code, all the way into code running in higher level runtimes, enabling unprecedented insight into your system’s behaviour at all levels.
Universal Profiling even supports mixed-language stack traces. For example, Python or Java code calling native code and then calling into the kernel
The following language runtimes are supported: PHP, Python, Java (or any JVM language), Go, Rust, C/C++, Node.js/V8, Ruby, and Perl.
The minimum supported versions are:
- PHP: >= 7.3
- Python: >= 3.6
- JVM/JDK: >= 7
- V8: >= 8.1.0
- Ruby: >= 2.5
- Perl: >= 5.28
This integration includes one or more Kibana dashboards that visualizes the data collected by the integration. The screenshots below illustrate how the ingested data is displayed.
Changelog
| Version | Details | Minimum Kibana version |
|---|---|---|
| 8.17.3 | Enhancement (View pull request) Update Kibana constraint to support 9.0.0. |
9.0.0 8.17.3 |
| 8.17.2 | Enhancement (View pull request) Update ownership |
8.17.1 |
| 8.17.1 | Enhancement (View pull request) Update screenshot of flamegraph |
8.17.1 |
| 8.17.0 | Enhancement (View pull request) Add project_id |
8.17.0 |
| 8.14.0 | Enhancement (View pull request) Update requirement text |
8.13.2 |
| 8.13.2 | Enhancement (View pull request) Add disable_tls option |
8.13.2 |
| 8.12.0 | Enhancement (View pull request) Add privileges section and update to 3.0.2 format |
8.12.0 |
| 8.9.0 | Enhancement (View pull request) Promote package for GA |
8.9.0 |
| 8.8.0-preview | Enhancement (View pull request) Initial draft of the package |
— |