MongoDB Atlas Integration
Elastic Cloud Serverless projects are autoscaled environments, fully managed by Elastic and available on Elastic Cloud. Availability This functionality is generally available and ready for production usage. Elastic Cloud Serverless projects are autoscaled environments, fully managed by Elastic and available on Elastic Cloud. Availability This functionality is generally available and ready for production usage. The Elastic Stack includes Elastic's core products such as Elasticsearch, Kibana, Logstash, and Beats. Availability This functionality is generally available and ready for production usage. Unless stated otherwise on the page, this functionality is available when your Elastic Stack is deployed on Elastic Cloud Hosted, Elastic Cloud Enterprise, Elastic Cloud on Kubernetes, and self-managed environments. This documentation corresponds to the latest patch available for each minor version. If you're not using the latest patch, check the release notes for changes.
Serverless Observability
Generally available
Serverless Security
Generally available
Stack
9.0+
Generally available since 9.0
| Version | 1.4.0 (View all) |
| Managed integration release status | Availability Beta This functionality is in beta and is not ready for production usage. For beta features, the design and code is less mature than official GA features and is being provided as-is with no warranties. Beta features are not subject to the support SLA of official GA features. Specific Support terms apply. |
| Subscription level What's this? |
Basic |
| Developed by What's this? |
Elastic |
| Ingestion method(s) | API |
| Minimum Kibana version(s) | 9.0.0 8.13.0 |
You can use this integration as an Elastic Managed integration on Elastic Cloud Hosted deployments running this version or later.
MongoDB Atlas, the leading multi-cloud developer data platform, offers the easiest way to run MongoDB, enabling you to work with your code's objects directly through its document-based data model, which allows for flexible schema and easy scalability.
Use the MongoDB Atlas integration to:
- Collect MongoDB Atlas alert, mongod audit, mongod database, organization, and project logs, along with disk, hardware and process metrics for comprehensive monitoring and analysis.
- Create informative visualizations to track usage trends, measure key metrics, and derive actionable business insights.
- Set up alerts to minimize Mean Time to Detect (MTTD) and Mean Time to Resolve (MTTR) by quickly referencing relevant logs during troubleshooting.
The MongoDB Atlas integration collects logs and metrics.
Logs help you keep a record of events that happen on your machine. The Log data stream collected by MongoDB Atlas integration are alert, mongod_audit, mongod_database, organization, and project.
Metrics give you insight into the statistics of the MongoDB Atlas. The Metric data stream collected by the MongoDB Atlas integration are disk, hardware, and process so that the user can monitor and troubleshoot the performance of the MongoDB Atlas instance.
Data streams:
alert: Collects alerts generated by MongoDB Atlas instance. Alerts cover a wide range of metrics and events, such as resource utilization thresholds (CPU, memory, disk space), database operations, security issues, and configuration changes.disk: Collects disk or partition metrics for all the hosts in the specified group. Metrics like measurements for the disk, such as I/O operations, read and write latency, and space usage.hardware: Collects all the Atlas search hardware and status data series within the provided time range for one process in the specified project.mongod_audit: Allows administrators and users to track system activity for deployments with multiple users and applications. Mongod Audit logs capture events related to database operations such as insertions, updates, deletions, user authentication, etc., occurring within the mongod instances.mongod_database: Collects a running log of events, including entries such as incoming connections, commands run, and issues encountered. Generally, database log messages are useful for diagnosing issues, monitoring your deployment, and tuning performance.organization: Provides a detailed view of your organization's activities, enabling tracking and monitoring of significant actions and status changes involving database operations, billing, security, hosts, encryption, user access, and more, as performed by users and teams.process: Collects host metrics per process for all the hosts in the specified group. Metrics like measurements for the host, such as CPU usage, number of I/O operations and memory usage are available in this data stream.project: Collects events from MongoDB Atlas instance, providing a comprehensive record of actions and changes made within a project. These events can include modifications to database configurations, user access changes, and general project activity. It's a crucial resource for auditing and monitoring the activities within a MongoDB Atlas project.
Users can monitor and see the logs and metrics inside the ingested documents for MongoDB Atlas in the logs-* index pattern from Discover.
Elastic Agent must be installed. For more details, check the Elastic Agent installation instructions. You can install only one Elastic Agent per host.
Elastic Agent is required to collect data from MongoDb Atlas and ship the data to Elastic, where the events will then be processed via the integration's ingest pipelines.
Elastic Managed integrations are only supported on Elastic Cloud Serverless and Elastic Cloud Hosted deployments. An Elastic Managed integration lets you ingest data from a cloud source while avoiding the orchestration, management, and maintenance associated with standard ingest infrastructure. Elastic runs the collector for you, so you can focus on your data instead of the infrastructure that collects it. This functionality is in beta and is subject to change. Beta features are not subject to the support SLA of official GA features.
For more information, refer to Elastic Managed integrations and the Elastic Managed integrations FAQ.
You can store and search your data using Elasticsearch and visualize and manage it with Kibana. We recommend using our hosted Elasticsearch Service on Elastic Cloud or self-managing the Elastic Stack on your own hardware.
To collect data from MongoDB Atlas, the following parameters from your MongoDB Atlas instance are required
- Public Key
- Private Key
- Group ID
- Organization ID
- Generate programmatic API keys with
Organization Ownerpermission by following the instructions in the Atlas documentation. Then, copy the public and private keys which function as a username and API key respectively. - From the Atlas UI with
project ownerpermission, go to Project Settings > Access Manager > API Keys and then click Invite To Project to add the API key created above, as described in the Atlas documentation. - Add a specific role to API keys, under Project Settings > Access Manager > API Keys. This step is important to make sure that these API keys have the right permissions to access the data without running into any issues. The specific role for each data stream is defined under the data stream reference section.
- Enable Database Auditing for the Atlas project you want to monitor logs. Follow the instructions in the Atlas documentation.
- Find your Project ID (Group ID) in the Atlas UI. To do this, navigate to your project, click Settings, and copy the Project ID (Group ID). You can also programmatically find it using the Atlas Admin API or Atlas CLI as described in this Atlas documentation.
- On the Atlas UI, select your organization from the context dropdown, click Settings, and copy the Organization ID.
- Granularity: Duration that specifies the interval at which Atlas reports the metrics.
- Period: Duration over which Atlas reports the metrics.
Both of the above attributes can be set by using a period in configuration parameters.
- In Kibana go to Management > Integrations.
- In the search bar, type MongoDB Atlas.
- Click the MongoDB Atlas integration from the search results.
- To add the integration, click the Add MongoDB Atlas button.
- Enter all the necessary configuration parameters, including Public Key, Private Key, and GroupId.
- Save the integration.
Notes:
- The
mongod_audit,mongod_database,organization, andprojectdata streams gather historical data spanning the previous 30 minutes. - We recommend setting an interval of five minutes or higher for collecting mongod audit and database logs, as MongoDB Atlas refreshes logs from the cluster's backend infrastructure at five minutes intervals as described in this Atlas document.
- The logs collection from MongoDB Atlas does not support M0 free clusters, M2/M5 shared clusters, or serverless instances.
- Mongod is the primary daemon method for the MongoDB system. It helps in handling the data requests, managing the data access, performing background management operations, and other core database operations.
If you encounter an error while ingesting data, it might be due to the data collected over a long time span. Generating a response in such cases may take longer and might cause a request timeout if the HTTP Client Timeout parameter is set to a small duration. To avoid this error, it is recommended to adjust the HTTP Client Timeout and Interval parameters based on the duration of data collection.
{
  "error": {
    "message": "failed eval: net/http: request canceled (Client.Timeout or context cancellation while reading body)"
  }
}
The alert data stream collects alerts generated by the MongoDB Atlas. Alerts cover a wide range of metrics and events, such as resource utilization thresholds (CPU, memory, disk space), database operations, security issues, and configuration changes. To collect alert logs, the requesting API Key must have the Project Read Only role.
Example
{
    "@timestamp": "2024-07-02T09:55:24.000Z",
    "agent": {
        "ephemeral_id": "6b489b03-fad0-4580-9968-08b35122f19b",
        "id": "9778e64a-8a5a-453f-be0e-ac1821ee26cc",
        "name": "docker-fleet-agent",
        "type": "filebeat",
        "version": "8.13.0"
    },
    "data_stream": {
        "dataset": "mongodb_atlas.alert",
        "namespace": "ep",
        "type": "logs"
    },
    "ecs": {
        "version": "8.11.0"
    },
    "elastic_agent": {
        "id": "9778e64a-8a5a-453f-be0e-ac1821ee26cc",
        "snapshot": false,
        "version": "8.13.0"
    },
    "event": {
        "agent_id_status": "verified",
        "category": [
            "host"
        ],
        "dataset": "mongodb_atlas.alert",
        "id": "6683ce8c9558e8655626e1ed",
        "ingested": "2024-07-11T10:13:01Z",
        "kind": "alert",
        "module": "mongodb_atlas",
        "type": [
            "info"
        ]
    },
    "group": {
        "id": "646f4379c47da356740d14ad"
    },
    "host": {
        "architecture": "x86_64",
        "containerized": true,
        "hostname": "docker-fleet-agent",
        "id": "8259e024976a406e8a54cdbffeb84fec",
        "ip": [
            "192.168.242.7"
        ],
        "mac": [
            "02-42-C0-A8-F2-07"
        ],
        "name": "docker-fleet-agent",
        "os": {
            "codename": "focal",
            "family": "debian",
            "kernel": "3.10.0-1160.118.1.el7.x86_64",
            "name": "Ubuntu",
            "platform": "ubuntu",
            "type": "linux",
            "version": "20.04.6 LTS (Focal Fossa)"
        }
    },
    "input": {
        "type": "cel"
    },
    "mongodb_atlas": {
        "alert": {
            "acknowledged": {
                "comment": "Issue acknowledged and being worked on",
                "time": "2024-07-05T00:00:00Z",
                "user": {
                    "name": "devOpsUser"
                }
            },
            "cluster": {
                "id": "exampleClusterId456",
                "name": "IntegrationsDevBuildCluster",
                "parent": {
                    "id": "exampleParentClusterId123"
                }
            },
            "config": {
                "id": "6683cb42d12516670f38a3ef"
            },
            "event_type": {
                "name": "OUTSIDE_METRIC_THRESHOLD"
            },
            "host": {
                "id": "exampleHostId789",
                "non_running": {
                    "ids": [
                        "hostId1",
                        "hostId2"
                    ]
                }
            },
            "host_name_and_port": "atlas-ccx4uc-shard-00-01.q5ljb.mongodb.net:27017",
            "last_notified": {
                "time": "2024-07-02T10:03:21Z"
            },
            "metric": {
                "name": "FTS_PROCESS_CPU_USER",
                "unit": "RAW",
                "value": 1.2666666666666666
            },
            "processor": {
                "error_msg": "No errors",
                "instance": {
                    "name": "instance123"
                },
                "name": "Processor1",
                "state": "Running"
            },
            "replicaset": {
                "name": "atlas-ccx4uc-shard-0"
            },
            "resolved": {
                "time": "2024-07-02T10:03:21Z"
            },
            "source_type": {
                "name": "ATLAS_MONITORING_AGENT"
            },
            "status": "CLOSED",
            "tags": [
                "critical",
                "cpu",
                "threshold"
            ],
            "updated": {
                "time": "2024-07-02T10:03:21Z"
            },
            "user": {
                "alias": "integrationsdevbuildclu-shard-00-01.q5ljb.mongodb.net"
            }
        }
    },
    "related": {
        "hosts": [
            "atlas-ccx4uc-shard-00-01.q5ljb.mongodb.net"
        ]
    },
    "source": {
        "address": "atlas-ccx4uc-shard-00-01.q5ljb.mongodb.net",
        "port": 27017
    },
    "tags": [
        "mongodb_atlas-alert"
    ]
}
ECS Field Reference
Refer to ECS Field Reference for more details.
Exported fields
| Field | Description | Type |
|---|---|---|
| @timestamp | Event timestamp. | date |
| data_stream.dataset | Data stream dataset. | constant_keyword |
| data_stream.namespace | Data stream namespace. | constant_keyword |
| data_stream.type | Data stream type. | constant_keyword |
| input.type | Type of Filebeat input. | keyword |
| mongodb_atlas.alert.acknowledged.comment | Comment left by the user who acknowledged the alert. MongoDB Atlas returns this value if the alert has been acknowledged. | keyword |
| mongodb_atlas.alert.acknowledged.time | Timestamp in ISO 8601 date and time format in UTC until which the alert has been acknowledged. MongoDB Atlas returns this value if the alert has been acknowledged. | date |
| mongodb_atlas.alert.acknowledged.user.name | Username of the user who acknowledged the alert. MongoDB Atlas returns this value if the alert has been acknowledged. | keyword |
| mongodb_atlas.alert.cluster.id | Unique identifier for the cluster to which this alert applies. MongoDB Atlas returns this value if "eventTypeName" : "SHARDED_CLUSTER" | keyword |
| mongodb_atlas.alert.cluster.name | Name of the cluster to which this alert applies. MongoDB Atlas returns this value if "eventTypeName" : "SHARDED_CLUSTER" | keyword |
| mongodb_atlas.alert.cluster.parent.id | Unique 24-hexadecimal character string that identifies the parent cluster to which this alert applies. The parent cluster contains the sharded nodes. MongoDB Atlas returns this parameter only for alerts of events impacting sharded clusters. | keyword |
| mongodb_atlas.alert.config.id | Unique identifier for the alert configuration that triggered this alert. | keyword |
| mongodb_atlas.alert.event_type.name | Name of the event that triggered the alert. | keyword |
| mongodb_atlas.alert.host.id | Unique identifier for the host to which the metric pertains. MongoDB Atlas returns this value if "eventTypeName" was set to one of the following : HOST_DOWN, OUTSIDE_METRIC_THRESHOLD, REPLICA_SET. | keyword |
| mongodb_atlas.alert.host.non_running.ids | List of unique 24-hexadecimal character strings that identify the replica set members that are not in PRIMARY nor SECONDARY state. | keyword |
| mongodb_atlas.alert.host_name_and_port | Hostname and port of each host to which the alert applies. This can be a hostname, an FQDN, an IPv4 address, or an IPv6 address. MongoDB Atlas returns this value if "eventTypeName" was set to one of the following : HOST_DOWN, OUTSIDE_METRIC_THRESHOLD, REPLICA_SET. | keyword |
| mongodb_atlas.alert.last_notified.time | Timestamp in ISO 8601 date and time format in UTC when the last notification was sent for this alert. MongoDB Atlas returns this value if notifications have been sent. | date |
| mongodb_atlas.alert.metric.name | Name of the measurement whose value went outside the threshold. MongoDB Atlas returns this value if "eventTypeName" was set to OUTSIDE_METRIC_THRESHOLD. | keyword |
| mongodb_atlas.alert.metric.unit | Relevant units for value. | keyword |
| mongodb_atlas.alert.metric.value | Value of the metric. | double |
| mongodb_atlas.alert.processor.error_msg | The error message associated with the Stream Processor to which this alert applies. | keyword |
| mongodb_atlas.alert.processor.instance.name | The name of the Stream Processing Instance to which this alert applies. The resource returns this parameter for alerts of events impacting Stream Processing Instances. | keyword |
| mongodb_atlas.alert.processor.name | The name of the Stream Processor to which this alert applies. The resource returns this parameter for alerts of events impacting Stream Processors. | keyword |
| mongodb_atlas.alert.processor.state | The state of the Stream Processor to which this alert applies. The resource returns this parameter for alerts of events impacting Stream Processors. | keyword |
| mongodb_atlas.alert.replicaset.name | Name of the replica set. MongoDB Atlas returns this value if "eventTypeName" was set to one of the following : BACKUPHOST_DOWN, OUTSIDE_METRIC_THRESHOLD, REPLICA_SET. | keyword |
| mongodb_atlas.alert.resolved.time | Timestamp in ISO 8601 date and time format in UTC when the alert was closed. MongoDB Atlas returns this value if "status":"CLOSED" | date |
| mongodb_atlas.alert.source_type.name | Type of host being backed up when "eventTypeName" : "BACKUP". MongoDB Atlas can return one of the following : REPLICA_SET, SHARDED_CLUSTER, CONFIG_SERVER. | keyword |
| mongodb_atlas.alert.status | Current state of the alert. MongoDB Atlas can return one of the following : TRACKING, OPEN, CLOSED, CANCELLED. | keyword |
| mongodb_atlas.alert.tags | Identifying labels set for this alert. | keyword |
| mongodb_atlas.alert.updated.time | Timestamp in ISO 8601 date and time format in UTC when the alert was last updated. | date |
| mongodb_atlas.alert.user.alias | Human-readable label that identifies the cluster node. MongoDB Atlas sets this hostname usually to the standard hostname for the cluster node. It appears in the connection string for a cluster instead of the value of the hostname parameter. | keyword |
The mongod_audit data stream allows administrators and users to track system activity for deployments with multiple users and applications. To collect audit logs, the requesting API Key must have the Project Data Access Read Only or higher role.
Example
{
    "@timestamp": "2023-04-01T12:00:00.000Z",
    "agent": {
        "ephemeral_id": "82e5a7ce-c7ad-436f-90f2-a1cefbe22333",
        "id": "498e0c10-4447-4a56-90f0-ba02c44a01c2",
        "name": "docker-fleet-agent",
        "type": "filebeat",
        "version": "8.13.0"
    },
    "data_stream": {
        "dataset": "mongodb_atlas.mongod_audit",
        "namespace": "ep",
        "type": "logs"
    },
    "ecs": {
        "version": "8.11.0"
    },
    "elastic_agent": {
        "id": "498e0c10-4447-4a56-90f0-ba02c44a01c2",
        "snapshot": false,
        "version": "8.13.0"
    },
    "event": {
        "action": "authenticate",
        "agent_id_status": "verified",
        "category": [
            "network",
            "authentication"
        ],
        "dataset": "mongodb_atlas.mongod_audit",
        "ingested": "2024-04-09T06:13:37Z",
        "kind": "event",
        "module": "mongodb_atlas",
        "type": [
            "access",
            "info"
        ]
    },
    "host": {
        "architecture": "x86_64",
        "containerized": true,
        "hostname": "docker-fleet-agent",
        "id": "8259e024976a406e8a54cdbffeb84fec",
        "ip": [
            "192.168.245.7"
        ],
        "mac": [
            "02-42-C0-A8-F5-07"
        ],
        "name": "docker-fleet-agent",
        "os": {
            "codename": "focal",
            "family": "debian",
            "kernel": "3.10.0-1160.92.1.el7.x86_64",
            "name": "Ubuntu",
            "platform": "ubuntu",
            "type": "linux",
            "version": "20.04.6 LTS (Focal Fossa)"
        }
    },
    "input": {
        "type": "cel"
    },
    "mongodb_atlas": {
        "mongod_audit": {
            "hostname": "hostname1",
            "local": {
                "ip": "127.0.0.1",
                "port": 27017
            },
            "remote": {
                "ip": "192.168.1.100",
                "port": 54320
            },
            "result": "Success",
            "user": {
                "names": [
                    {
                        "db": "admin",
                        "user": "auditUser"
                    }
                ],
                "roles": [
                    {
                        "db": "admin",
                        "role": "dbAdmin"
                    }
                ]
            },
            "uuid": {
                "binary": "some-unique-identifier",
                "type": "04"
            }
        }
    },
    "related": {
        "ip": [
            "127.0.0.1",
            "192.168.1.100"
        ]
    },
    "tags": [
        "mongodb_atlas-mongod_audit"
    ]
}
ECS Field Reference
Refer to ECS Field Reference for more details.
Exported fields
| Field | Description | Type |
|---|---|---|
| @timestamp | Event timestamp. | date |
| data_stream.dataset | Data stream dataset. | constant_keyword |
| data_stream.namespace | Data stream namespace. | constant_keyword |
| data_stream.type | Data stream type. | constant_keyword |
| input.type | Type of Filebeat input. | keyword |
| mongodb_atlas.mongod_audit.hostname | Hostname that stores the log files that you want to download. | keyword |
| mongodb_atlas.mongod_audit.local.ip | IP address of the running instance. | ip |
| mongodb_atlas.mongod_audit.local.is_system_user | True if the event is caused by a system user, false otherwise. | boolean |
| mongodb_atlas.mongod_audit.local.port | Port number of the running instance. | long |
| mongodb_atlas.mongod_audit.local.unix | Unix that contains the MongoDB socket file path if the client connects through a Unix domain socket. | keyword |
| mongodb_atlas.mongod_audit.param | Specific details for the event. | flattened |
| mongodb_atlas.mongod_audit.remote.ip | IP address of the incoming connection associated with the event. | ip |
| mongodb_atlas.mongod_audit.remote.is_system_user | True if the event is caused by a system user, false otherwise. | boolean |
| mongodb_atlas.mongod_audit.remote.port | Port number of the incoming connection associated with the event. | long |
| mongodb_atlas.mongod_audit.remote.unix | Unix that contains the MongoDB socket file path if the client connects through a Unix domain socket. | keyword |
| mongodb_atlas.mongod_audit.result | Error code. | keyword |
| mongodb_atlas.mongod_audit.user.names | Array of user identification documents. | object |
| mongodb_atlas.mongod_audit.user.roles | Array of documents that specify the roles granted to the user. | object |
| mongodb_atlas.mongod_audit.uuid.binary | Document that contains a universally unique identifier (UUID) for the audit message. | keyword |
| mongodb_atlas.mongod_audit.uuid.type | The $type field specifies the BSON subtype for the $binary field. | keyword |
The mongod_database data stream collects a running log of events, including entries such as incoming connections, commands run, monitoring deployment, tuning performance, and issues encountered. To collect database logs, the requesting API Key must have the Project Data Access Read Only or higher role.
Example
{
    "@timestamp": "2024-02-18T14:45:23.512Z",
    "agent": {
        "ephemeral_id": "dbad1b64-5ae2-467e-a76a-7d31d2bbc35a",
        "id": "35b61223-ca83-481f-a4aa-ab5983a75ba8",
        "name": "docker-fleet-agent",
        "type": "filebeat",
        "version": "8.13.0"
    },
    "data_stream": {
        "dataset": "mongodb_atlas.mongod_database",
        "namespace": "ep",
        "type": "logs"
    },
    "ecs": {
        "version": "8.11.0"
    },
    "elastic_agent": {
        "id": "35b61223-ca83-481f-a4aa-ab5983a75ba8",
        "snapshot": false,
        "version": "8.13.0"
    },
    "event": {
        "agent_id_status": "verified",
        "category": [
            "network",
            "database"
        ],
        "dataset": "mongodb_atlas.mongod_database",
        "ingested": "2024-04-05T10:24:59Z",
        "kind": "event",
        "module": "mongodb_atlas",
        "type": [
            "access",
            "info"
        ]
    },
    "host": {
        "architecture": "x86_64",
        "containerized": true,
        "hostname": "docker-fleet-agent",
        "id": "8259e024976a406e8a54cdbffeb84fec",
        "ip": [
            "192.168.255.7"
        ],
        "mac": [
            "02-42-C0-A8-FF-07"
        ],
        "name": "docker-fleet-agent",
        "os": {
            "codename": "focal",
            "family": "debian",
            "kernel": "3.10.0-1160.92.1.el7.x86_64",
            "name": "Ubuntu",
            "platform": "ubuntu",
            "type": "linux",
            "version": "20.04.6 LTS (Focal Fossa)"
        }
    },
    "input": {
        "type": "cel"
    },
    "log": {
        "level": "informational"
    },
    "mongodb_atlas": {
        "mongod_database": {
            "component": "NETWORK",
            "hostname": "hostname1",
            "id": 67890,
            "message": "Client connection accepted",
            "tags": [
                "connection"
            ],
            "thread": {
                "name": "conn123"
            }
        }
    },
    "tags": [
        "mongodb_atlas-mongod_database"
    ]
}
ECS Field Reference
Refer to ECS Field Reference for more details.
Exported fields
| Field | Description | Type |
|---|---|---|
| @timestamp | Event timestamp. | date |
| data_stream.dataset | Data stream dataset. | constant_keyword |
| data_stream.namespace | Data stream namespace. | constant_keyword |
| data_stream.type | Data stream type. | constant_keyword |
| input.type | Type of Filebeat input. | keyword |
| mongodb_atlas.mongod_database.attributes | One or more key-value pairs for additional log attributes. If a log message does not include any additional attributes, the attr object is omitted. | flattened |
| mongodb_atlas.mongod_database.component | The component field indicates the category to which a logged event belongs, such as NETWORK or COMMAND. | keyword |
| mongodb_atlas.mongod_database.hostname | A human-readable label that identifies the host that stores the log files you want to download. | keyword |
| mongodb_atlas.mongod_database.id | The unique identifier for the log statement. | long |
| mongodb_atlas.mongod_database.message | The log output message passed from the server or driver. If necessary, the message is escaped according to the JSON specification. | match_only_text |
| mongodb_atlas.mongod_database.size | The original size of a log entry if it has been truncated. Only included if the log entry contains at least one truncated attr attribute. | object |
| mongodb_atlas.mongod_database.tags | Strings representing any tags applicable to the log statement, for example, ["startupWarnings"]. | keyword |
| mongodb_atlas.mongod_database.thread.name | The name of the thread that caused the log statement. | keyword |
| mongodb_atlas.mongod_database.truncated | Information about log message truncation, if applicable. Only included if the log entry contains at least one truncated attr attribute. | flattened |
The organization data stream collects detailed view of your organization's activities, enabling tracking and monitoring of significant actions and status changes involving database operations, billing, security, hosts, encryption, user access, and more, as performed by users and teams.
Example
{
    "@timestamp": "2024-04-30T06:17:35.000Z",
    "agent": {
        "ephemeral_id": "7075f3c4-b3d1-4132-9d0a-1655ef153d5c",
        "id": "ed83379a-5439-447a-8a2b-a2b6435d18ca",
        "name": "elastic-agent-97230",
        "type": "filebeat",
        "version": "8.13.0"
    },
    "client": {
        "ip": "192.0.2.1"
    },
    "data_stream": {
        "dataset": "mongodb_atlas.organization",
        "namespace": "89623",
        "type": "logs"
    },
    "ecs": {
        "version": "8.11.0"
    },
    "elastic_agent": {
        "id": "ed83379a-5439-447a-8a2b-a2b6435d18ca",
        "snapshot": false,
        "version": "8.13.0"
    },
    "event": {
        "agent_id_status": "verified",
        "category": [
            "configuration",
            "database"
        ],
        "dataset": "mongodb_atlas.organization",
        "id": "66308cff73a61b3c0633ad96",
        "ingested": "2025-04-07T07:02:10Z",
        "kind": "event",
        "module": "mongodb_atlas",
        "type": [
            "info",
            "access",
            "change"
        ]
    },
    "group": {
        "id": "663087fcc4818d301a53af06"
    },
    "host": {
        "architecture": "x86_64",
        "containerized": true,
        "hostname": "elastic-agent-97230",
        "id": "8259e024976a406e8a54cdbffeb84fec",
        "ip": [
            "192.168.247.2",
            "192.168.240.7"
        ],
        "mac": [
            "02-42-C0-A8-F0-07",
            "02-42-C0-A8-F7-02"
        ],
        "name": "elastic-agent-97230",
        "os": {
            "codename": "focal",
            "family": "debian",
            "kernel": "3.10.0-1160.119.1.el7.x86_64",
            "name": "Ubuntu",
            "platform": "ubuntu",
            "type": "linux",
            "version": "20.04.6 LTS (Focal Fossa)"
        }
    },
    "input": {
        "type": "cel"
    },
    "mongodb_atlas": {
        "organization": {
            "additional_info": {
                "_t": "RESOURCE_AUDIT",
                "cid": "663087fcc4818d301a53af06",
                "cre": "2024-04-30T06:17:35Z",
                "description": "Tag(s) were added or modified on project",
                "gn": "test_project_org",
                "org_name": "Integrations - 2023-05-25",
                "severity": "INFO",
                "source": "USER",
                "tags_added": [
                    "{key=test_123, value=test_123}"
                ],
                "un": "john.doe@example.com",
                "updated_tags_list": [
                    "{key=application, value=mongo_test}",
                    "{key=test_123, value=test_123}"
                ],
                "ut": "LOCAL"
            },
            "alert": {
                "config": {
                    "id": "6588efgh"
                },
                "id": "6578efgh"
            },
            "api_key": {
                "id": "5678efgh"
            },
            "cluster": {
                "id": "8765efgh",
                "name": "example_cluster"
            },
            "collection": {
                "name": "example_collection"
            },
            "database": {
                "name": "example_db"
            },
            "event_type": {
                "name": "GROUP_TAGS_MODIFIED"
            },
            "host": {
                "id": "8259e024976a407e8a54cdbffeb84fec",
                "name": "atlas-ccx4uc-shard-00-00.q5ljb.mongodb.net"
            },
            "invoice": {
                "id": "2678efgh"
            },
            "is_global_admin": false,
            "metric": {
                "name": "FTS_PROCESS_CPU_USER",
                "unit": "RAW",
                "value": 1
            },
            "operation": {
                "type": "update"
            },
            "payment": {
                "id": "3678efgh"
            },
            "public_key": "4678efgh",
            "replicaset": {
                "name": "atlas-ccx4uc-shard-0"
            },
            "shard": {
                "name": "ccx4uc-shard-0"
            },
            "target": {
                "username": "jane.doe@example.com"
            },
            "target_public_key": "mksfpbyq",
            "team": {
                "id": "1678efgh"
            },
            "whitelist_entry": "0.0.0.0/32"
        }
    },
    "organization": {
        "id": "646f418c72f24c07d430aaca"
    },
    "related": {
        "hosts": [
            "atlas-ccx4uc-shard-00-00.q5ljb.mongodb.net"
        ],
        "ip": [
            "192.0.2.1"
        ],
        "user": [
            "john.doe@example.com",
            "jane.doe@example.com"
        ]
    },
    "server": {
        "port": 80
    },
    "tags": [
        "mongodb_atlas-organization"
    ],
    "user": {
        "id": "7658efgh",
        "name": "john.doe@example.com"
    }
}
ECS Field Reference
Refer to ECS Field Reference for more details.
Exported fields
| Field | Description | Type |
|---|---|---|
| @timestamp | Event timestamp. | date |
| data_stream.dataset | Data stream dataset. | constant_keyword |
| data_stream.namespace | Data stream namespace. | constant_keyword |
| data_stream.type | Data stream type. | constant_keyword |
| input.type | Type of Filebeat input. | keyword |
| mongodb_atlas.organization.additional_info | Additional meta information about the event. Only present when includeRaw query parameter is true. | flattened |
| mongodb_atlas.organization.alert.config.id | Unique identifier for the alert configuration associated with the alertId. | keyword |
| mongodb_atlas.organization.alert.id | Unique identifier for the alert associated with this event. | keyword |
| mongodb_atlas.organization.api_key.id | Unique identifier for the API Key that triggered this event. | keyword |
| mongodb_atlas.organization.cluster.id | ID of the cluster to which this event applies. | keyword |
| mongodb_atlas.organization.cluster.name | Name of the cluster to which this event applies. | keyword |
| mongodb_atlas.organization.collection.name | Name of the collection where the event occurred. | keyword |
| mongodb_atlas.organization.database.name | Name of the database where the event occurred. | keyword |
| mongodb_atlas.organization.event_type.name | Name of the event type. | keyword |
| mongodb_atlas.organization.host.id | ID of the host where this event occurred. | keyword |
| mongodb_atlas.organization.host.name | Hostname, FQDN, IPv4 address, or IPv6 address of the host on which this event occurred. | keyword |
| mongodb_atlas.organization.invoice.id | Unique identifier of the invoice associated with this event. | keyword |
| mongodb_atlas.organization.is_global_admin | Flag indicating whether the user who triggered this event is a MongoDB employee. | boolean |
| mongodb_atlas.organization.metric.name | Name of the measurement whose value went outside the threshold. | keyword |
| mongodb_atlas.organization.metric.unit | Unit for the value. | keyword |
| mongodb_atlas.organization.metric.value | Value of the metric. | double |
| mongodb_atlas.organization.operation.type | Type of operation that generated the event. | keyword |
| mongodb_atlas.organization.payment.id | Unique identifier of the invoice payment associated with this event. | keyword |
| mongodb_atlas.organization.public_key | Public key associated with the API Key that triggered this event. If this field is present in the response, Cloud Manager does not return the username field. | keyword |
| mongodb_atlas.organization.replicaset.name | Name of the replica set. | keyword |
| mongodb_atlas.organization.resource.id | Unique 24-hexadecimal digit string that identifies the resource associated with the event. | keyword |
| mongodb_atlas.organization.resource.type | Unique identifier of resource type. | keyword |
| mongodb_atlas.organization.shard.name | The name of the shard associated with the event. | keyword |
| mongodb_atlas.organization.target.username | Username for the Cloud Manager user targeted by this event. | keyword |
| mongodb_atlas.organization.target_public_key | Public key of the API Key targeted by the event. | keyword |
| mongodb_atlas.organization.team.id | Unique identifier for the Cloud Manager team associated with this event. | keyword |
| mongodb_atlas.organization.whitelist_entry | Entry in the list of source host addresses that the API key accepts and this event targets. | keyword |
The project data stream collects events from MongoDB Atlas, providing a comprehensive record of actions and changes made within a project. These events can include modifications to database configurations, user access changes, and general project activity. It's a crucial resource for auditing and monitoring the activities within a MongoDB Atlas project. To collect project logs, the requesting API Key must have the Project Read Only role.
Example
{
    "@timestamp": "2024-02-21T10:00:29.000Z",
    "agent": {
        "ephemeral_id": "64709dfe-1629-4e90-80b1-31b74ed75367",
        "id": "9f972286-96f7-4f54-a2ed-31bd886cebd6",
        "name": "elastic-agent-30632",
        "type": "filebeat",
        "version": "8.13.0"
    },
    "client": {
        "ip": "192.168.0.1"
    },
    "data_stream": {
        "dataset": "mongodb_atlas.project",
        "namespace": "39156",
        "type": "logs"
    },
    "ecs": {
        "version": "8.11.0"
    },
    "elastic_agent": {
        "id": "9f972286-96f7-4f54-a2ed-31bd886cebd6",
        "snapshot": false,
        "version": "8.13.0"
    },
    "event": {
        "agent_id_status": "verified",
        "category": [
            "configuration",
            "database"
        ],
        "dataset": "mongodb_atlas.project",
        "id": "65d5c9bd2c86e3377aa5e5e4",
        "ingested": "2025-04-07T07:03:18Z",
        "kind": "event",
        "module": "mongodb_atlas",
        "type": [
            "info",
            "change"
        ]
    },
    "group": {
        "id": "646f4379c47da356740d14ad"
    },
    "host": {
        "architecture": "x86_64",
        "containerized": true,
        "hostname": "elastic-agent-30632",
        "id": "8259e024976a406e8a54cdbffeb84fec",
        "ip": [
            "192.168.249.2",
            "192.168.240.7"
        ],
        "mac": [
            "02-42-C0-A8-F0-07",
            "02-42-C0-A8-F9-02"
        ],
        "name": "elastic-agent-30632",
        "os": {
            "codename": "focal",
            "family": "debian",
            "kernel": "3.10.0-1160.119.1.el7.x86_64",
            "name": "Ubuntu",
            "platform": "ubuntu",
            "type": "linux",
            "version": "20.04.6 LTS (Focal Fossa)"
        }
    },
    "input": {
        "type": "cel"
    },
    "mongodb_atlas": {
        "project": {
            "additional_info": {
                "_t": "USER_AUDIT",
                "cid": "646f4379c47da356740d14ad",
                "cre": "2024-02-21T10:00:29Z",
                "description": "User was invited to project",
                "et": "INVITED_TO_GROUP",
                "hidden": false,
                "id": "65d5c9bd2c86e3377aa5e5e4",
                "is_mms_admin": false,
                "remote_addr": "0.0.0.0",
                "severity": "INFO",
                "source": "USER",
                "target_username": "jane.doe@example.com",
                "un": "jane.doe@example.com",
                "user_id": "65d5c9bd2c877aa5e5e4",
                "ut": "LOCAL"
            },
            "alert": {
                "config": {
                    "id": "alert_config_5678efgh"
                },
                "id": "alert_5678efgh"
            },
            "api_key": {
                "id": "api_key_5678efgh"
            },
            "application": {
                "id": "application_5678efgh",
                "name": "Application-1"
            },
            "cluster": {
                "id": "cluster_5678efgh",
                "name": "example_cluster"
            },
            "collection": {
                "name": "example_collection"
            },
            "database": {
                "name": "example_db",
                "username": "atlas-example-dataset-load-5678efgh"
            },
            "endpoint": {
                "id": "123e4567-e89b-12d3-a456-426614174001"
            },
            "event_type": {
                "name": "INVITED_TO_GROUP"
            },
            "host": {
                "id": "host_5678efgh",
                "name": "example_hostname"
            },
            "invoice": {
                "id": "invoice_5678efgh"
            },
            "is_global_admin": false,
            "metric": {
                "name": "example_metric",
                "unit": "RAW",
                "value": 50
            },
            "operation": {
                "type": "update"
            },
            "payment": {
                "id": "payment_5678efgh"
            },
            "processor": {
                "error_msg": "Failed to connect to database instance due to timeout.",
                "instance": {
                    "name": "mongo-instance-02"
                },
                "name": "eventProcessorService",
                "state": "active"
            },
            "provider_endpoint": {
                "id": "456f7890-f12a-34d5-b678-567890123457"
            },
            "public_key": "public_key_5678efgh",
            "replicaset": {
                "name": "example_replica_set"
            },
            "resource": {
                "id": "789g1011-h12i-34j5-k678-890123456790",
                "type": "database"
            },
            "shard": {
                "name": "example_shard"
            },
            "snapshot": {
                "completion_date": "2024-06-18T05:51:05Z",
                "frequency_type": "HOURLY",
                "scheduled_creation_date": "2024-06-18T05:47:05Z"
            },
            "target": {
                "username": "jane.doe@example.com"
            },
            "target_public_key": "target_public_key_5678efgh",
            "team": {
                "id": "team_5678efgh"
            },
            "whitelist_entry": "0.0.0.0/32"
        }
    },
    "organization": {
        "id": "org_5678efgh"
    },
    "related": {
        "hosts": [
            "example_hostname"
        ],
        "ip": [
            "192.168.0.1"
        ],
        "user": [
            "john.doe@example.com",
            "atlas-example-dataset-load-5678efgh",
            "jane.doe@example.com"
        ]
    },
    "server": {
        "port": 80
    },
    "tags": [
        "mongodb_atlas-project"
    ],
    "user": {
        "id": "user_5678efgh",
        "name": "john.doe@example.com"
    }
}
ECS Field Reference
Refer to ECS Field Reference for more details.
Exported fields
| Field | Description | Type |
|---|---|---|
| @timestamp | Event timestamp. | date |
| data_stream.dataset | Data stream dataset. | constant_keyword |
| data_stream.namespace | Data stream namespace. | constant_keyword |
| data_stream.type | Data stream type. | constant_keyword |
| input.type | Type of Filebeat input. | keyword |
| mongodb_atlas.project.additional_info | Additional meta information about the event. Only present when includeRaw query parameter is true. | flattened |
| mongodb_atlas.project.alert.config.id | Unique identifier for the alert configuration associated with the alertId. | keyword |
| mongodb_atlas.project.alert.id | Unique identifier for the alert associated with this event. | keyword |
| mongodb_atlas.project.api_key.id | Unique identifier for the API Key that triggered this event. If this field is present in the response, Cloud Manager does not return the userId field. | keyword |
| mongodb_atlas.project.application.id | Unique identifier for the application within the MongoDB Atlas. | keyword |
| mongodb_atlas.project.application.name | Human-readable name assigned to the application. | keyword |
| mongodb_atlas.project.cluster.id | ID of the cluster to which this event applies. | keyword |
| mongodb_atlas.project.cluster.name | Name of the cluster to which this event applies. | keyword |
| mongodb_atlas.project.collection.name | Name of the collection on which the event occurred. | keyword |
| mongodb_atlas.project.database.name | Name of the database on which the event occurred. | keyword |
| mongodb_atlas.project.database.username | The username of the MongoDB User that was created, deleted, or edited. | keyword |
| mongodb_atlas.project.endpoint.id | Unique 24-hexadecimal digit string that identifies the endpoint associated with this event. | keyword |
| mongodb_atlas.project.event_type.name | Indicates name of the event. | keyword |
| mongodb_atlas.project.host.id | ID of the host on which this event occurred. | keyword |
| mongodb_atlas.project.host.name | Hostname, FQDN, IPv4 address, or IPv6 address of the host on which this event occurred. | keyword |
| mongodb_atlas.project.invoice.id | Unique identifier of the invoice associated with this event. | keyword |
| mongodb_atlas.project.is_global_admin | Flag indicating whether the user who triggered this event is a MongoDB employee. | boolean |
| mongodb_atlas.project.metric.name | Name of the measurement whose value went outside the threshold. | keyword |
| mongodb_atlas.project.metric.unit | Unit for the value. | keyword |
| mongodb_atlas.project.metric.value | Value of the metric. | float |
| mongodb_atlas.project.operation.type | Type of operation that generated the event. | keyword |
| mongodb_atlas.project.payment.id | Unique identifier of the invoice payment associated with this event. | keyword |
| mongodb_atlas.project.processor.error_msg | Error message linked to the stream processor associated with the event. | keyword |
| mongodb_atlas.project.processor.instance.name | Name of the stream processing instance associated with the event. | keyword |
| mongodb_atlas.project.processor.name | Name of the stream processor associated with the event. | keyword |
| mongodb_atlas.project.processor.state | State of the stream processor associated with the event. | keyword |
| mongodb_atlas.project.provider_endpoint.id | Unique identification string that the cloud provider uses to identify the private endpoint. | keyword |
| mongodb_atlas.project.public_key | Public key associated with the API Key that triggered this event. If this field is present in the response, Cloud Manager does not return the username field. | keyword |
| mongodb_atlas.project.replicaset.name | Name of the replica set. | keyword |
| mongodb_atlas.project.resource.id | Unique 24-hexadecimal digit string that identifies the resource associated with the event. | keyword |
| mongodb_atlas.project.resource.type | Unique identifier of resource type. | keyword |
| mongodb_atlas.project.shard.name | The name of the shard associated with the event. | keyword |
| mongodb_atlas.project.snapshot.completion_date | Date and time when the snapshot process was completed.its value in the ISO 8601 timestamp format in UTC. | date |
| mongodb_atlas.project.snapshot.frequency_type | Specifies the interval at which snapshots are taken, such as hourly, daily, weekly, or monthly, to ensure regular data backups. | keyword |
| mongodb_atlas.project.snapshot.scheduled_creation_date | Date and time when the scheduled date and time for the snapshot to be created.Its value in the ISO 8601 timestamp format in UTC. | date |
| mongodb_atlas.project.target.username | Email address for the console user that this event targets. | keyword |
| mongodb_atlas.project.target_public_key | Public key of the API Key targeted by the event. | keyword |
| mongodb_atlas.project.team.id | Unique identifier for the Cloud Manager team associated with this event. | keyword |
| mongodb_atlas.project.whitelist_entry | Entry in the list of source host addresses that the API key accepts and this event targets. | keyword |
The disk data stream collects a detailed overview of disk usage and captures important data about I/O operations, read and write latency, and space utilization. To collect disk metrics, the API Key making the request must have the Project Read Only role.
Example
{
    "@timestamp": "2024-07-26T09:04:53.005Z",
    "agent": {
        "ephemeral_id": "fbf2fa71-3382-47f6-969b-ca6aac75124c",
        "id": "e23cb0e2-3880-4380-be0f-5253dc6986eb",
        "name": "docker-fleet-agent",
        "type": "filebeat",
        "version": "8.13.0"
    },
    "data_stream": {
        "dataset": "mongodb_atlas.disk",
        "namespace": "26983",
        "type": "logs"
    },
    "ecs": {
        "version": "8.11.0"
    },
    "elastic_agent": {
        "id": "e23cb0e2-3880-4380-be0f-5253dc6986eb",
        "snapshot": false,
        "version": "8.13.0"
    },
    "event": {
        "agent_id_status": "verified",
        "category": [
            "database"
        ],
        "dataset": "mongodb_atlas.disk",
        "ingested": "2024-07-26T09:05:04Z",
        "kind": "metric",
        "module": "mongodb_atlas",
        "type": [
            "info"
        ]
    },
    "group": {
        "id": "mongodb-group1"
    },
    "host": {
        "architecture": "x86_64",
        "containerized": true,
        "hostname": "docker-fleet-agent",
        "id": "8259e024976a406e8a54cdbffeb84fec",
        "ip": [
            "192.168.240.8"
        ],
        "mac": [
            "02-42-C0-A8-F0-08"
        ],
        "name": "docker-fleet-agent",
        "os": {
            "codename": "focal",
            "family": "debian",
            "kernel": "3.10.0-1160.92.1.el7.x86_64",
            "name": "Ubuntu",
            "platform": "ubuntu",
            "type": "linux",
            "version": "20.04.6 LTS (Focal Fossa)"
        }
    },
    "input": {
        "type": "cel"
    },
    "mongodb_atlas": {
        "disk": {
            "read": {
                "iops": {
                    "throughput": 0.9994005994005996
                }
            },
            "space": {
                "free": {
                    "bytes": 7906467840
                }
            },
            "write": {
                "iops": {
                    "throughput": 4.25004682136163
                }
            }
        },
        "host_id": "hostname1",
        "partition_name": "data",
        "process_id": "hostname1:7780"
    },
    "tags": [
        "mongodb_atlas-disk"
    ]
}
ECS Field Reference
Refer to ECS Field Reference for more details.
Exported fields
| Field | Description | Type | Unit | Metric Type |
|---|---|---|---|---|
| @timestamp | Event timestamp. | date | ||
| data_stream.dataset | Data stream dataset. | constant_keyword | ||
| data_stream.namespace | Data stream namespace. | constant_keyword | ||
| data_stream.type | Data stream type. | constant_keyword | ||
| input.type | Type of Filebeat input. | keyword | ||
| mongodb_atlas.disk.read.iops.max.throughput | Maximum throughput of I/O read operations for the disk partition used by MongoDB Atlas. | double | gauge | |
| mongodb_atlas.disk.read.iops.throughput | Current throughput of I/O read operations for the disk partition used by MongoDB Atlas. | double | gauge | |
| mongodb_atlas.disk.read.latency.max.ms | Maximum read latency in milliseconds for the disk partition used by MongoDB Atlas. | double | ms | gauge |
| mongodb_atlas.disk.read.latency.ms | Current read latency in milliseconds for the disk partition used by MongoDB Atlas. | double | ms | gauge |
| mongodb_atlas.disk.space.free.bytes | Current amount of free disk space in bytes on the disk partition used by MongoDB Atlas. | double | byte | gauge |
| mongodb_atlas.disk.space.free.max.bytes | Maximum amount of free disk space in bytes on the disk partition used by MongoDB Atlas. | double | byte | gauge |
| mongodb_atlas.disk.space.free.max.pct | Maximum percentage of free disk space on the disk partition used by MongoDB Atlas. | double | percent | gauge |
| mongodb_atlas.disk.space.free.pct | Current percentage of free disk space on the disk partition used by MongoDB Atlas. | double | percent | gauge |
| mongodb_atlas.disk.space.used.bytes | Current amount of used disk space in bytes on the disk partition used by MongoDB Atlas. | double | byte | gauge |
| mongodb_atlas.disk.space.used.max.bytes | Maximum amount of used disk space in bytes on the disk partition used by MongoDB Atlas. | double | byte | gauge |
| mongodb_atlas.disk.space.used.max.pct | Maximum percentage of used disk space on the disk partition used by MongoDB Atlas. | double | percent | gauge |
| mongodb_atlas.disk.space.used.pct | Current percentage of used disk space on the disk partition used by MongoDB Atlas. | double | percent | gauge |
| mongodb_atlas.disk.total.iops.max.throughput | Maximum throughput of total I/O operations for the disk partition used by MongoDB Atlas. | double | gauge | |
| mongodb_atlas.disk.total.iops.throughput | Current throughput of total I/O operations for the disk partition used by MongoDB Atlas. | double | gauge | |
| mongodb_atlas.disk.write.iops.max.throughput | Maximum throughput of I/O write operations for the disk partition used by MongoDB Atlas. | double | gauge | |
| mongodb_atlas.disk.write.iops.throughput | Current throughput of I/O write operations for the disk partition used by MongoDB Atlas. | double | gauge | |
| mongodb_atlas.disk.write.latency.max.ms | Maximum write latency in milliseconds for the disk partition used by MongoDB Atlas. | double | ms | gauge |
| mongodb_atlas.disk.write.latency.ms | Current write latency in milliseconds for the disk partition used by MongoDB Atlas. | double | ms | gauge |
| mongodb_atlas.host_id | Unique identifier of the host for the MongoDB process. | keyword | ||
| mongodb_atlas.partition_name | Name of the disk partition used by MongoDB Atlas. | keyword | ||
| mongodb_atlas.process_id | Combination of hostname and Internet Assigned Numbers Authority (IANA) port that serves the MongoDB process. | keyword |
The hardware data stream collects hardware and status metrics for each process in the specified group. It includes measurements such as CPU usage, memory consumption, JVM memory usage, disk usage, etc. To collect hardware metrics, the requesting API Key must have the Project Read Only or higher role.
Example
{
    "@timestamp": "2024-07-18T13:09:27.510Z",
    "agent": {
        "ephemeral_id": "26f07cd8-42ea-4909-88e1-fbd017d8acc7",
        "id": "e6fb98d1-ed5e-44e9-a2cb-e389b3fe8091",
        "name": "docker-fleet-agent",
        "type": "filebeat",
        "version": "8.13.0"
    },
    "data_stream": {
        "dataset": "mongodb_atlas.hardware",
        "namespace": "87828",
        "type": "logs"
    },
    "ecs": {
        "version": "8.11.0"
    },
    "elastic_agent": {
        "id": "e6fb98d1-ed5e-44e9-a2cb-e389b3fe8091",
        "snapshot": false,
        "version": "8.13.0"
    },
    "event": {
        "agent_id_status": "verified",
        "category": [
            "database"
        ],
        "dataset": "mongodb_atlas.hardware",
        "ingested": "2024-07-18T13:09:39Z",
        "kind": "metric",
        "module": "mongodb_atlas",
        "type": [
            "access",
            "info"
        ]
    },
    "group": {
        "id": "mongodb-group1"
    },
    "host": {
        "architecture": "x86_64",
        "containerized": true,
        "hostname": "docker-fleet-agent",
        "id": "8259e024976a406e8a54cdbffeb84fec",
        "ip": [
            "192.168.249.7"
        ],
        "mac": [
            "02-42-C0-A8-F9-07"
        ],
        "name": "docker-fleet-agent",
        "os": {
            "codename": "focal",
            "family": "debian",
            "kernel": "3.10.0-1160.92.1.el7.x86_64",
            "name": "Ubuntu",
            "platform": "ubuntu",
            "type": "linux",
            "version": "20.04.6 LTS (Focal Fossa)"
        }
    },
    "input": {
        "type": "cel"
    },
    "mongodb_atlas": {
        "group_id": "mongodb-group1",
        "hardware": {
            "fts": {
                "disk_usage": {
                    "bytes": 175143048.53333333
                }
            },
            "status": {
                "page_faults": 0.16428448420436206
            }
        },
        "process_id": "hostname1"
    },
    "tags": [
        "mongodb_atlas-hardware"
    ]
}
ECS Field Reference
Refer to ECS Field Reference for more details.
Exported fields
| Field | Description | Type | Unit | Metric Type |
|---|---|---|---|---|
| @timestamp | Event timestamp. | date | ||
| data_stream.dataset | Data stream dataset. | constant_keyword | ||
| data_stream.namespace | Data stream namespace. | constant_keyword | ||
| data_stream.type | Data stream type. | constant_keyword | ||
| input.type | Type of Filebeat input. | keyword | ||
| mongodb_atlas.group_id | Unique identifier that identifies the project. | keyword | ||
| mongodb_atlas.hardware.fts.disk_usage.bytes | Total bytes of disk space that search processes use. | long | byte | gauge |
| mongodb_atlas.hardware.fts.process.cpu.kernel.pct | The amount of CPU time spent by the Full-Text Search process in kernel space. Kernel space includes the core operating system functions such as handling system calls and hardware interrupts. | double | percent | gauge |
| mongodb_atlas.hardware.fts.process.cpu.user.pct | The amount of CPU time spent by the Full-Text Search process in user space. User space includes the execution of application code and processing data | double | percent | gauge |
| mongodb_atlas.hardware.fts.process.memory.resident.bytes | Total bytes of resident memory that search processes occupy. | long | byte | gauge |
| mongodb_atlas.hardware.fts.process.memory.shared.bytes | Total bytes of shared memory that search processes occupy. | long | byte | gauge |
| mongodb_atlas.hardware.fts.process.memory.virtual.bytes | Total bytes of virtual memory that search processes occupy. | long | byte | gauge |
| mongodb_atlas.hardware.fts.process.normalized.cpu.kernel.pct | Percentage of time that the CPU spent servicing operating system calls for the search process. | double | percent | gauge |
| mongodb_atlas.hardware.fts.process.normalized.cpu.user.pct | Percentage of time that the CPU spent servicing user calls for the search process. | double | percent | gauge |
| mongodb_atlas.hardware.status.jvm.memory.heap.available.mb | Total amount of available memory in the JVM heap. | long | gauge | |
| mongodb_atlas.hardware.status.jvm.memory.heap.used.mb | Amount of memory that the JVM heap is currently using. | long | gauge | |
| mongodb_atlas.hardware.status.page_faults | Average rate of page faults on this process per second over the selected sample period. | double | gauge | |
| mongodb_atlas.process_id | Combination of hostname and MongoDB process port that serves the MongoDB process. | keyword |
The process data stream collects host metrics per process for all the hosts of the specified group. Metrics like measurements for the host, such as CPU usage, number of I/O operations and memory are available on this data stream. To collect process metrics, the requesting API Key must have the Project Read Only role.
Example
{
    "@timestamp": "2024-07-18T13:11:22.466Z",
    "agent": {
        "ephemeral_id": "2b57b07e-9a6e-4c52-8b47-e2db2b136579",
        "id": "e6fb98d1-ed5e-44e9-a2cb-e389b3fe8091",
        "name": "docker-fleet-agent",
        "type": "filebeat",
        "version": "8.13.0"
    },
    "data_stream": {
        "dataset": "mongodb_atlas.process",
        "namespace": "45497",
        "type": "logs"
    },
    "ecs": {
        "version": "8.11.0"
    },
    "elastic_agent": {
        "id": "e6fb98d1-ed5e-44e9-a2cb-e389b3fe8091",
        "snapshot": false,
        "version": "8.13.0"
    },
    "event": {
        "agent_id_status": "verified",
        "category": [
            "process"
        ],
        "dataset": "mongodb_atlas.process",
        "ingested": "2024-07-18T13:11:34Z",
        "kind": "metric",
        "module": "mongodb_atlas",
        "type": [
            "info"
        ]
    },
    "group": {
        "id": "mongodb-group1"
    },
    "host": {
        "architecture": "x86_64",
        "containerized": true,
        "hostname": "docker-fleet-agent",
        "id": "8259e024976a406e8a54cdbffeb84fec",
        "ip": [
            "192.168.249.7"
        ],
        "mac": [
            "02-42-C0-A8-F9-07"
        ],
        "name": "docker-fleet-agent",
        "os": {
            "codename": "focal",
            "family": "debian",
            "kernel": "3.10.0-1160.92.1.el7.x86_64",
            "name": "Ubuntu",
            "platform": "ubuntu",
            "type": "linux",
            "version": "20.04.6 LTS (Focal Fossa)"
        }
    },
    "input": {
        "type": "cel"
    },
    "mongodb_atlas": {
        "group_id": "mongodb-group1",
        "host_id": "hostname1",
        "process": {
            "assert": {
                "regular": 0
            }
        },
        "process_id": "hostname1"
    },
    "tags": [
        "mongodb_atlas-process"
    ]
}
ECS Field Reference
Refer to ECS Field Reference for more details.
Exported fields
| Field | Description | Type | Unit | Metric Type |
|---|---|---|---|---|
| @timestamp | Event timestamp. | date | ||
| data_stream.dataset | Data stream dataset. | constant_keyword | ||
| data_stream.namespace | Data stream namespace. | constant_keyword | ||
| data_stream.type | Data stream type. | constant_keyword | ||
| input.type | Type of Filebeat input. | keyword | ||
| mongodb_atlas.group_id | Unique identifier that identifies the project. | keyword | ||
| mongodb_atlas.host_id | Unique identifier of the host for the MongoDB process. | keyword | ||
| mongodb_atlas.process.assert.msg | The average rate of message asserts per second over the selected sample period. | double | gauge | |
| mongodb_atlas.process.assert.regular | The average rate of regular asserts raised per second over the selected sample period. | double | gauge | |
| mongodb_atlas.process.assert.user | The average rate of user asserts per second over the selected sample period. | double | gauge | |
| mongodb_atlas.process.assert.warning | The average rate of warnings per second over the selected sample period. | double | gauge | |
| mongodb_atlas.process.background_flush.avg | Amount of data flushed in the background. | double | gauge | |
| mongodb_atlas.process.cache.dirty.bytes | Amount of dirty bytes in the WiredTiger storage engine cache. | double | byte | gauge |
| mongodb_atlas.process.cache.read.bytes | Read - Amount of bytes in the WiredTiger storage engine cache. | double | byte | gauge |
| mongodb_atlas.process.cache.used.total.bytes | Amount of used bytes in the WiredTiger storage engine cache. | double | byte | gauge |
| mongodb_atlas.process.cache.write.bytes | Write - Amount of bytes in the WiredTiger storage engine cache. | double | byte | gauge |
| mongodb_atlas.process.connections | Displays the total number of active connections to the database deployment. Monitor connections to determine whether the current connection limits are sufficient. | double | gauge | |
| mongodb_atlas.process.cpu.children.kernel.max.pct | The maximum amount of CPU time spent by child processes in kernel space. | double | percent | counter |
| mongodb_atlas.process.cpu.children.kernel.pct | CPU children kernel space for mongodb processes. | double | percent | gauge |
| mongodb_atlas.process.cpu.children.user.max.pct | The maximum amount of CPU time spent by child processes in user space. | double | percent | counter |
| mongodb_atlas.process.cpu.children.user.pct | CPU children user space for mongodb. | double | percent | gauge |
| mongodb_atlas.process.cpu.kernel.max.pct | The maximum amount of CPU time spent by the MongoDB process itself in kernel space, handling system calls and hardware interrupts. | double | percent | counter |
| mongodb_atlas.process.cpu.kernel.pct | CPU kernel space for mongodb processes. | double | percent | gauge |
| mongodb_atlas.process.cpu.normalized.children.kernel.max.pct | Max children kernel CPU usage scaled to a range of 0% to 100%, is obtained by dividing the usage value by the total number of CPU cores. | double | percent | counter |
| mongodb_atlas.process.cpu.normalized.children.kernel.pct | NORMALIZED CPU children kernel space for mongodb processes. | double | percent | gauge |
| mongodb_atlas.process.cpu.normalized.children.user.max.pct | Max children user CPU usage scaled to a range of 0% to 100%, is obtained by dividing the usage value by the total number of CPU cores. | double | percent | counter |
| mongodb_atlas.process.cpu.normalized.children.user.pct | NORMALIZED CPU children user space for mongodb. | double | percent | gauge |
| mongodb_atlas.process.cpu.normalized.kernel.max.pct | Max kernel CPU usage scaled to a range of 0% to 100%, is obtained by dividing the usage value by the total number of CPU cores. | double | percent | counter |
| mongodb_atlas.process.cpu.normalized.kernel.pct | NORMALIZED CPU kernel space for mongodb processes. | double | percent | gauge |
| mongodb_atlas.process.cpu.normalized.user.max.pct | Max user CPU usage scaled to a range of 0% to 100%, is obtained by dividing the usage value by the total number of CPU cores. | double | percent | counter |
| mongodb_atlas.process.cpu.normalized.user.pct | NORMALIZED CPU user space for mongodb processes. | double | percent | gauge |
| mongodb_atlas.process.cpu.user.max.pct | The maximum amount of CPU time spent by the MongoDB process itself in user space, executing application code and processing data. | double | percent | counter |
| mongodb_atlas.process.cpu.user.pct | CPU user space for mongodb processes. | double | percent | gauge |
| mongodb_atlas.process.cursor.open.total | The number of cursors that the server maintains for clients. | long | gauge | |
| mongodb_atlas.process.cursor.timed_out.total | The average rate of cursors that have timed out per second over the selected sample period. | double | gauge | |
| mongodb_atlas.process.database.size.total.bytes | The amount of storage space in bytes that your stored data uses. | long | byte | gauge |
| mongodb_atlas.process.database.storage.total.bytes | Sum total of the compressed on-disk storage space allocated for document storage across all databases. | long | byte | gauge |
| mongodb_atlas.process.document.deleted | Displays the documents deleted per second. | double | gauge | |
| mongodb_atlas.process.document.inserted | Displays the documents inserted per second. | double | gauge | |
| mongodb_atlas.process.document.returned | Displays the documents returned per second. | double | gauge | |
| mongodb_atlas.process.document.updated | Displays the documents updated per second. | double | gauge | |
| mongodb_atlas.process.fts.cpu.kernel.pct | The amount of CPU time spent by the Full-Text search process in kernel space. | double | percent | gauge |
| mongodb_atlas.process.fts.cpu.normalized.kernel.pct | Percentage of time that the CPU spent servicing the operating system calls for the search process. | double | percent | gauge |
| mongodb_atlas.process.fts.cpu.normalized.user.pct | Percentage of time that the CPU spent servicing user calls for the search process. | double | percent | gauge |
| mongodb_atlas.process.fts.cpu.user.pct | The amount of CPU time spent by the Full-Text search process in user space. | double | percent | gauge |
| mongodb_atlas.process.fts.disk.utilization.total.bytes | Total bytes of disk space that search processes use. | long | byte | gauge |
| mongodb_atlas.process.fts.memory.mapped.total.bytes | Total bytes of mapped memory that search processes occupy. | long | byte | gauge |
| mongodb_atlas.process.fts.memory.resident.total.bytes | Total bytes of resident memory that search processes occupy. | long | byte | gauge |
| mongodb_atlas.process.fts.memory.virtual.total.bytes | Total bytes of virtual memory that search processes occupy. | long | byte | gauge |
| mongodb_atlas.process.global.access.not_in_memory | The number of accesses to data that are not currently stored in memory, requiring disk access. | long | gauge | |
| mongodb_atlas.process.global.lock.current_queue.reader.count | The number of operations that are currently queued and waiting for the read lock. | long | gauge | |
| mongodb_atlas.process.global.lock.current_queue.total | The total number of operations queued waiting for the lock (readers + writers) | long | gauge | |
| mongodb_atlas.process.global.lock.current_queue.writer.count | The number of operations that are currently queued and waiting for the write lock. | long | gauge | |
| mongodb_atlas.process.global.page_fault.exception_thrown | The number of exceptions thrown due to page faults. | long | gauge | |
| mongodb_atlas.process.host.page_faults | Measurements on page faults related to the host. | double | gauge | |
| mongodb_atlas.process.index.btree.access.count | Number of index btree ACCESSES. | long | gauge | |
| mongodb_atlas.process.index.btree.hits.count | Number of index btree HITS. | long | gauge | |
| mongodb_atlas.process.index.btree.miss.count | Number of index btree MISSES. | long | gauge | |
| mongodb_atlas.process.index.btree.miss_ratio.count | Index btree miss ratio. | double | gauge | |
| mongodb_atlas.process.journaling.commits.write_lock | Number of journaling COMMIT operations. | long | gauge | |
| mongodb_atlas.process.journaling.mb | Average amount of data in megabytes Cloud Manager writes to the recovery log per second meets your specified threshold. | double | gauge | |
| mongodb_atlas.process.journaling.write.data_files.mb | The maximum size in megabytes (MB) of data files written by the journaling process. | double | gauge | |
| mongodb_atlas.process.memory.computed.mb | Amount of COMPUTED process memory in megabytes. | double | gauge | |
| mongodb_atlas.process.memory.mapped.mb | Amount of MAPPED process memory in megabytes. | double | gauge | |
| mongodb_atlas.process.memory.resident.mb | Amount of RESIDENT process memory in megabytes. | double | gauge | |
| mongodb_atlas.process.memory.virtual.mb | Amount of VIRTUAL process memory in megabytes. | double | gauge | |
| mongodb_atlas.process.network.in | Process incoming network throughput in bytes per second. | double | gauge | |
| mongodb_atlas.process.network.out | Process outgoing network throughput in bytes per second. | double | gauge | |
| mongodb_atlas.process.network.request.total | The total number of distinct requests that the process has received. | double | counter | |
| mongodb_atlas.process.opcounter.cmd | Database operations rate on a process since the process last started. | double | gauge | |
| mongodb_atlas.process.opcounter.delete | Database DELETE operations rate on a process since the process last started. | double | gauge | |
| mongodb_atlas.process.opcounter.getmore | Database GETMORE operations rate on a process since the process last started. | double | gauge | |
| mongodb_atlas.process.opcounter.insert | Database INSERT operations rate on a process since the process last started. | double | gauge | |
| mongodb_atlas.process.opcounter.query | Database QUERY operations rate on a process since the process last started. | double | gauge | |
| mongodb_atlas.process.opcounter.repl.cmd | Database operations rate on secondaries. | double | gauge | |
| mongodb_atlas.process.opcounter.repl.delete | Database DELETE operations rate on secondaries. | double | gauge | |
| mongodb_atlas.process.opcounter.repl.insert | Database INSERT operations rate on secondaries. | double | gauge | |
| mongodb_atlas.process.opcounter.repl.update | Database UPDATE operations rate on secondaries. | double | gauge | |
| mongodb_atlas.process.opcounter.update | Database UPDATE operations rate on a process since the process last started. | double | gauge | |
| mongodb_atlas.process.operation.execution.time.cmd.avg.ms | Average execution time in milliseconds per command operation over the selected sample period. | double | ms | gauge |
| mongodb_atlas.process.operation.execution.time.read.avg.ms | Average execution time in milliseconds per read operation over the selected sample period. | double | ms | gauge |
| mongodb_atlas.process.operation.execution.time.write.avg.ms | Average execution time in milliseconds per write operation over the selected sample period. | double | ms | gauge |
| mongodb_atlas.process.operation.scan_and_order | The total number of queries that return sorted data that cannot perform the sort operation using an index. | double | gauge | |
| mongodb_atlas.process.oplog.master.lag.time_diff.s | Lag or delay in replication between the primary node (oplog master) and its secondary nodes. | double | s | gauge |
| mongodb_atlas.process.oplog.master.time.s | The replication oplog window. The approximate time available in the primary's replication oplog. If a secondary is behind real-time by more than this amount, it cannot catch up and will require a full resync. | double | s | gauge |
| mongodb_atlas.process.oplog.rate.gb_per_hour | The rate of change in the size of the oplog in gigabytes per hour. | double | gauge | |
| mongodb_atlas.process.oplog.repl_lag.s | The amount of time, typically in seconds, it takes for changes recorded in the oplog on the primary node to be replicated and applied to the secondary node. | double | s | gauge |
| mongodb_atlas.process.oplog.slave.lag.master.time.s | The difference in time, typically in seconds, between the oplog time on the secondary (slave) node and the time of the latest operation in the oplog on the primary (master) node. | double | s | gauge |
| mongodb_atlas.process.query.executor.scanned | Average rate per second to scan index items during queries and query-plan evaluations. | double | gauge | |
| mongodb_atlas.process.query.executor.scanned_objects | Average rate of documents scanned per second during queries and query-plan evaluations. | double | gauge | |
| mongodb_atlas.process.query.targeting.scanned_objects_per_returned | Ratio of the number of documents scanned to the number of documents returned. | double | gauge | |
| mongodb_atlas.process.query.targeting.scanned_per_returned | Ratio of the number of index items scanned to the number of documents returned. | double | gauge | |
| mongodb_atlas.process.restart.in_last_hour | Number of times the host restarted within the previous hour. | double | gauge | |
| mongodb_atlas.process.swap.usage.free.max.kb | Max amount of swap space free. | double | counter | |
| mongodb_atlas.process.swap.usage.total.free | Total amount of swap space free. | double | gauge | |
| mongodb_atlas.process.swap.usage.total.used | Total amount of swap space in use. | double | gauge | |
| mongodb_atlas.process.swap.usage.used.max.kb | Max amount of swap space in use. | double | counter | |
| mongodb_atlas.process.system.cpu.guest.max.pct | Max amount of CPU time spent running a virtual CPU for guest operating systems. | double | percent | counter |
| mongodb_atlas.process.system.cpu.guest.pct | Tracks CPU time consumed by guest operating systems, like virtual machines, on the host system. | double | percent | gauge |
| mongodb_atlas.process.system.cpu.iowait.max.pct | Max amount of CPU time spent waiting for I/O operations to complete. | double | percent | counter |
| mongodb_atlas.process.system.cpu.iowait.pct | The CPU time spent waiting for I/O operations to complete. | double | percent | gauge |
| mongodb_atlas.process.system.cpu.irq.max.pct | Max amount of CPU time spent servicing hardware interrupts. | double | percent | counter |
| mongodb_atlas.process.system.cpu.irq.pct | The portion of CPU time spent servicing hardware interrupts. | double | percent | gauge |
| mongodb_atlas.process.system.cpu.kernel.max.pct | Max amount of CPU time spent in kernel space, executing system calls and handling hardware interrupts. | double | percent | counter |
| mongodb_atlas.process.system.cpu.kernel.pct | The portion of CPU time spent executing kernel space processes and handling system calls. | double | percent | gauge |
| mongodb_atlas.process.system.cpu.nice.pct | The portion of CPU time allocated to processes with a 'nice' priority level. | double | percent | gauge |
| mongodb_atlas.process.system.cpu.softirq.max.pct | Max amount of CPU time spent servicing soft interrupts, which are interrupts triggered by software. | double | percent | counter |
| mongodb_atlas.process.system.cpu.softirq.pct | The CPU time spent handling software-generated interrupts. | double | percent | gauge |
| mongodb_atlas.process.system.cpu.steal.max.pct | Max amount of CPU time 'stolen' by the hypervisor for other virtual machines running on the same physical host. | double | percent | counter |
| mongodb_atlas.process.system.cpu.steal.pct | The amount of CPU time 'stolen' by the hypervisor for other virtual machines running on the same physical host. | double | percent | gauge |
| mongodb_atlas.process.system.cpu.user.max.pct | Max amount of CPU time spent in user space, executing user-level processes and applications. | double | percent | counter |
| mongodb_atlas.process.system.cpu.user.pct | The portion of CPU time spent executing user space processes and running applications. | double | percent | gauge |
| mongodb_atlas.process.system.memory.available.kb | Physical memory available in kilobytes. | double | gauge | |
| mongodb_atlas.process.system.memory.available.max.kb | Max Physical memory available in kilobytes. | double | counter | |
| mongodb_atlas.process.system.memory.free.kb | Physical memory free in kilobytes. | double | gauge | |
| mongodb_atlas.process.system.memory.free.max.kb | Max Physical memory free in kilobytes. | double | counter | |
| mongodb_atlas.process.system.memory.used.kb | Physical memory used in kilobytes. | double | gauge | |
| mongodb_atlas.process.system.memory.used.max.kb | Max Physical memory used in kilobytes. | double | counter | |
| mongodb_atlas.process.system.network.in | Incoming network throughput in bytes per second. | double | gauge | |
| mongodb_atlas.process.system.network.max.in | Max Incoming network throughput in bytes per second. | double | counter | |
| mongodb_atlas.process.system.network.max.out | Max Outgoing network throughput in bytes per second. | double | counter | |
| mongodb_atlas.process.system.network.out | Outgoing network throughput in bytes per second. | double | gauge | |
| mongodb_atlas.process.system.normalized.cpu.guest.max.pct | Max Guest CPU usage of processes on the host scaled to a range of 0 to 100%, is obtained by dividing the usage value by the total number of CPU cores. | double | percent | counter |
| mongodb_atlas.process.system.normalized.cpu.guest.pct | Guest CPU usage of processes on the host scaled to a range of 0 to 100%, is obtained by dividing the usage value by the total number of CPU cores. | double | percent | gauge |
| mongodb_atlas.process.system.normalized.cpu.iowait.max.pct | Max CPU usage of processes spent waiting for IO operations to complete, scaled to a range of 0 to 100%, is obtained by dividing the usage value by the total number of CPU cores. | double | percent | counter |
| mongodb_atlas.process.system.normalized.cpu.iowait.pct | CPU usage of processes spent waiting for IO operations to complete, scaled to a range of 0 to 100%, is obtained by dividing the usage value by the total number of CPU cores. | double | percent | gauge |
| mongodb_atlas.process.system.normalized.cpu.irq.max.pct | Max CPU usage of hardware interrupts, scaled to a range of 0 to 100%, is obtained by dividing the usage value by the total number of CPU cores. | double | percent | counter |
| mongodb_atlas.process.system.normalized.cpu.irq.pct | NORMALIZED irq CPU utilization across various processes for a server | double | percent | gauge |
| mongodb_atlas.process.system.normalized.cpu.kernel.max.pct | Max kernel CPU usage of processes on the host scaled to a range of 0 to 100%, is obtained by dividing the usage value by the total number of CPU cores. | double | percent | counter |
| mongodb_atlas.process.system.normalized.cpu.kernel.pct | Kernel CPU usage of processes on the host scaled to a range of 0 to 100%, is obtained by dividing the usage value by the total number of CPU cores. | double | percent | gauge |
| mongodb_atlas.process.system.normalized.cpu.nice.max.pct | Max CPU usage of processes with a positive nice value, scaled to a range of 0 to 100%, is obtained by dividing the usage value by the total number of CPU cores. | double | percent | counter |
| mongodb_atlas.process.system.normalized.cpu.nice.pct | NORMALIZED nice CPU utilization across various processes for a server | double | percent | gauge |
| mongodb_atlas.process.system.normalized.cpu.softirq.max.pct | Max CPU usage of software interrupts, scaled to a range of 0 to 100%, is obtained by dividing the usage value by the total number of CPU cores. | double | percent | counter |
| mongodb_atlas.process.system.normalized.cpu.softirq.pct | NORMALIZED softirq CPU utilization across various processes for a server | double | percent | gauge |
| mongodb_atlas.process.system.normalized.cpu.steal.max.pct | Max The percentage of time the CPU had something runnable, but the hypervisor chose to run something else, scaled to a range of 0 to 100%, is obtained by dividing the usage value by the total number of CPU cores. | double | percent | counter |
| mongodb_atlas.process.system.normalized.cpu.steal.pct | The percentage of time the CPU had something runnable, but the hypervisor chose to run something else, scaled to a range of 0 to 100%, is obtained by dividing the usage value by the total number of CPU cores. | double | percent | gauge |
| mongodb_atlas.process.system.normalized.cpu.steal.user.max.pct | Max user CPU usage of processes on the host scaled to a range of 0 to 100%, is obtained by dividing the usage value by the total number of CPU cores. | double | percent | counter |
| mongodb_atlas.process.system.normalized.cpu.steal.user.pct | NORMALIZED CPU user space utilization across various processes for a server | double | percent | gauge |
| mongodb_atlas.process.system.normalized.cpu.user.max.pct | Max user CPU usage of processes on the host scaled to a range of 0 to 100%, is obtained by dividing the usage value by the total number of CPU cores. | double | percent | counter |
| mongodb_atlas.process.system.normalized.cpu.user.pct | The portion of CPU time spent executing user space processes and running applications. | double | percent | gauge |
| mongodb_atlas.process.ticket.available.read.count | The number of read tickets available to the WiredTiger storage engine. | long | gauge | |
| mongodb_atlas.process.ticket.available.write.count | The number of write tickets available to the WiredTiger storage engine. | long | gauge | |
| mongodb_atlas.process_id | Combination of hostname and MongoDB process port that serves the MongoDB process. | keyword |
This integration includes one or more Kibana dashboards that visualizes the data collected by the integration. The screenshots below illustrate how the ingested data is displayed.
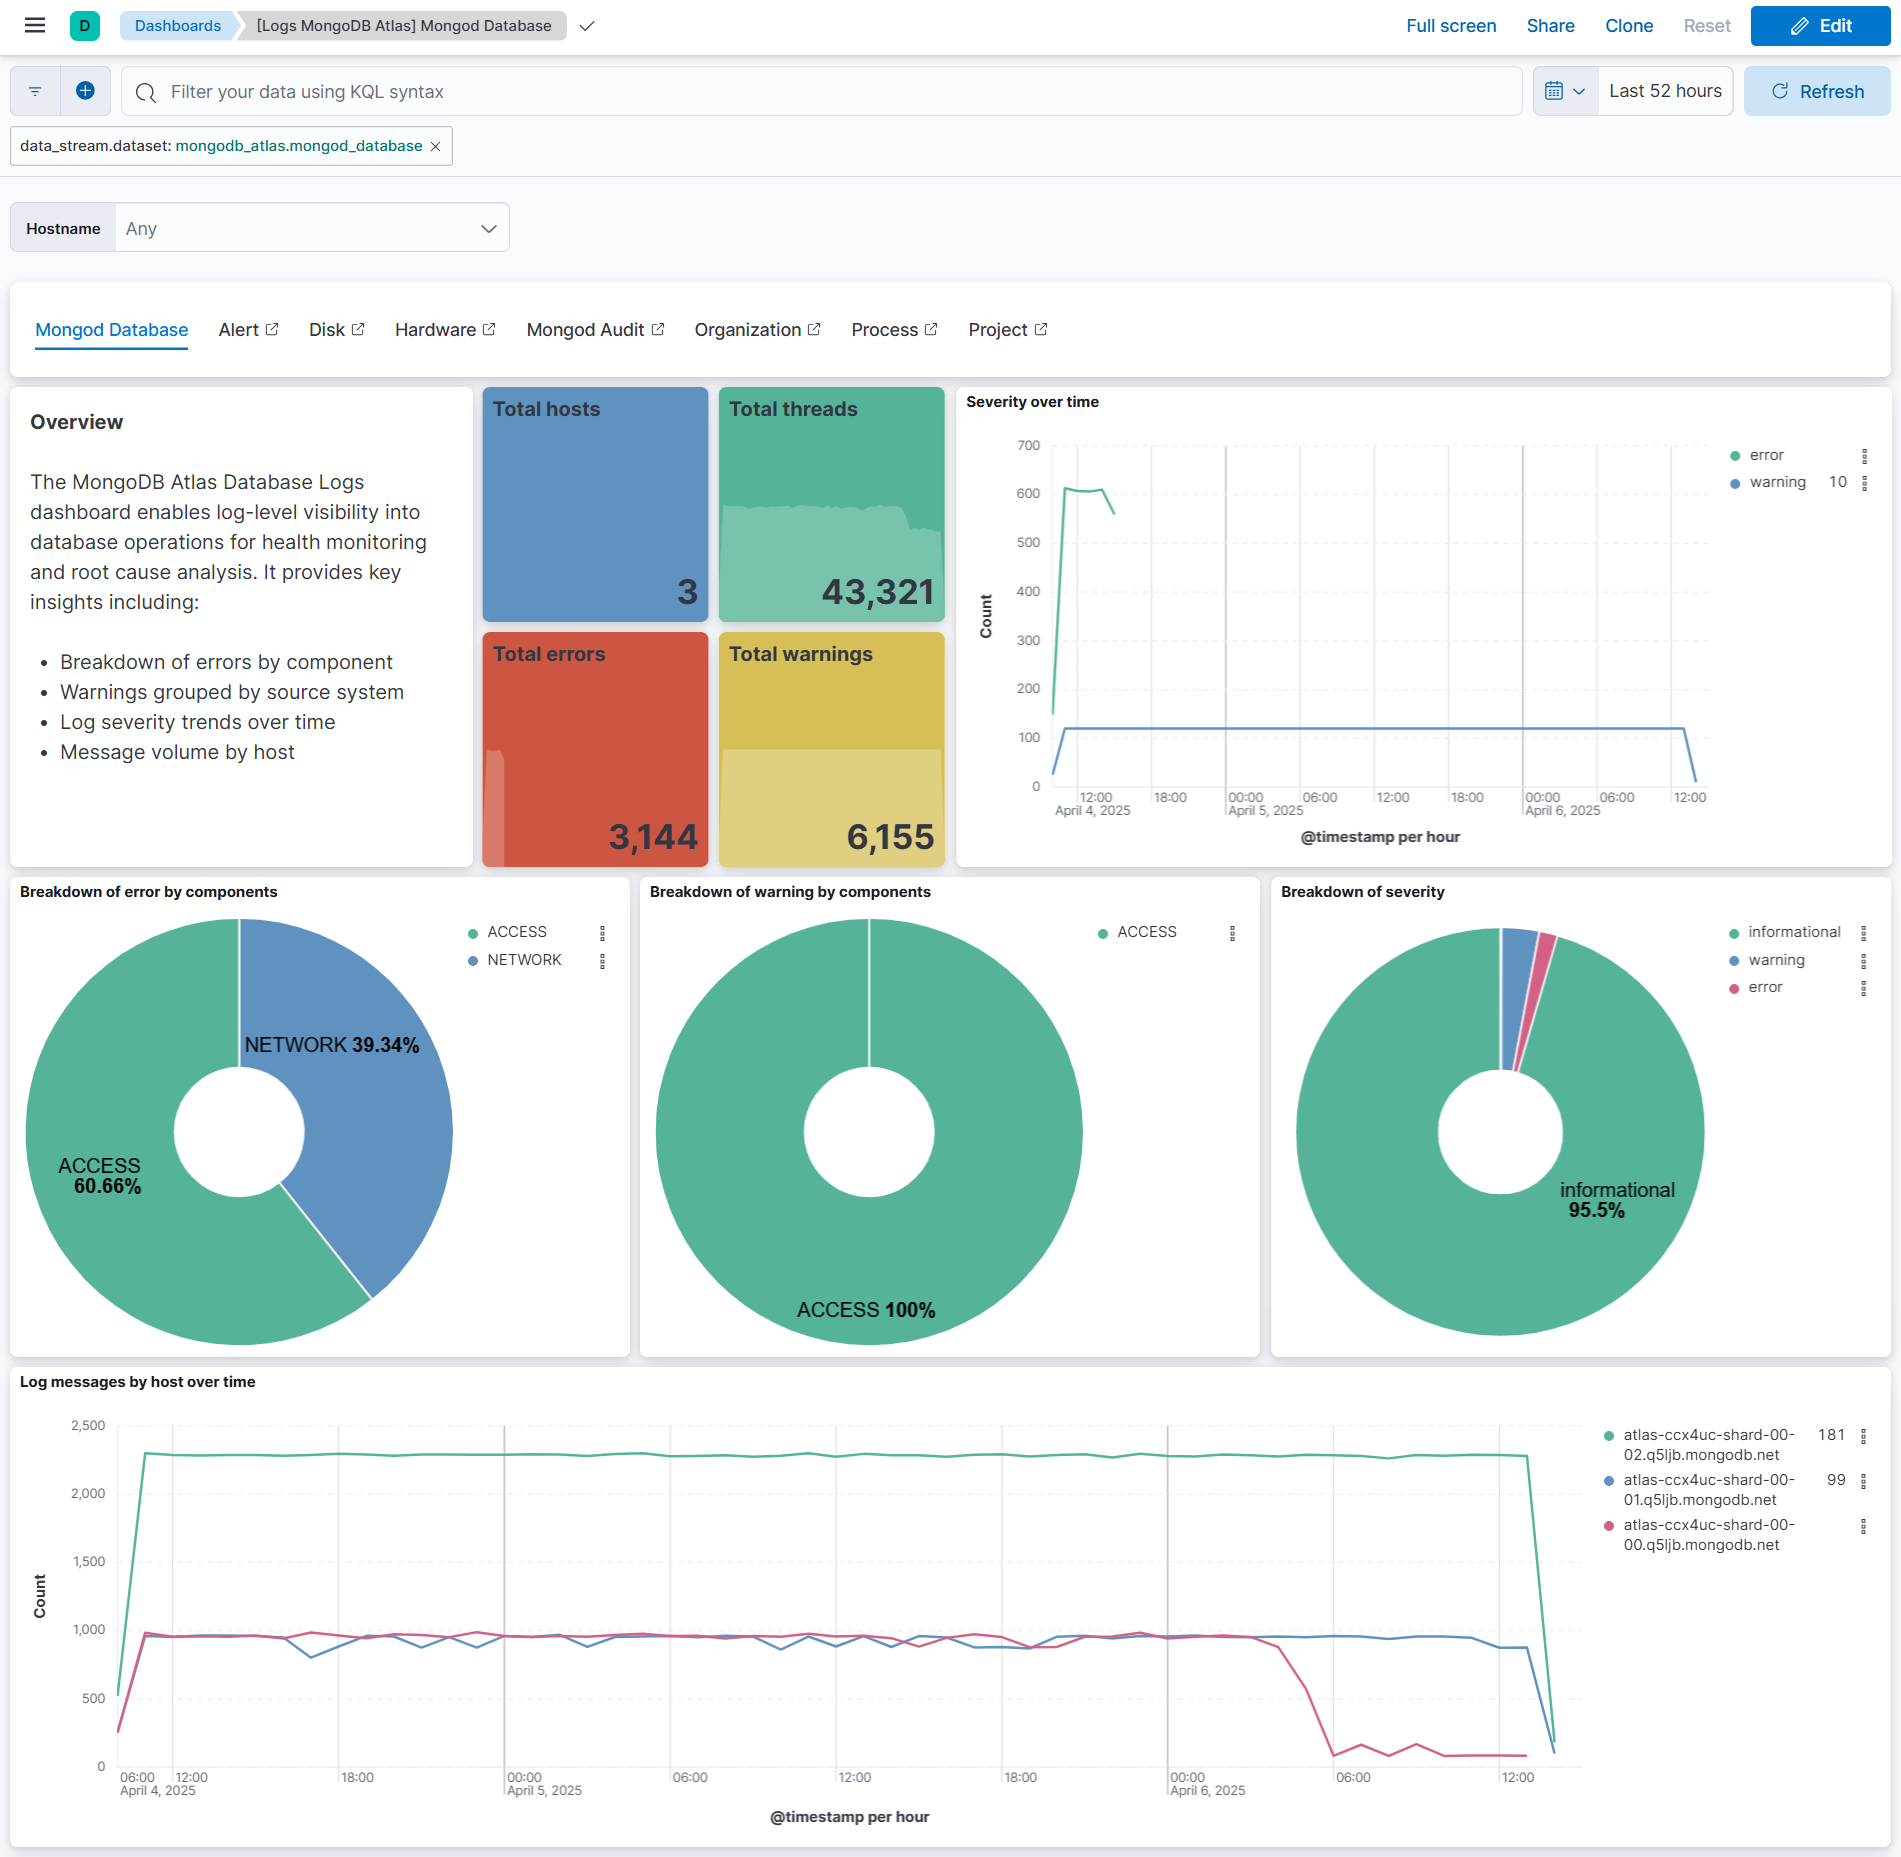
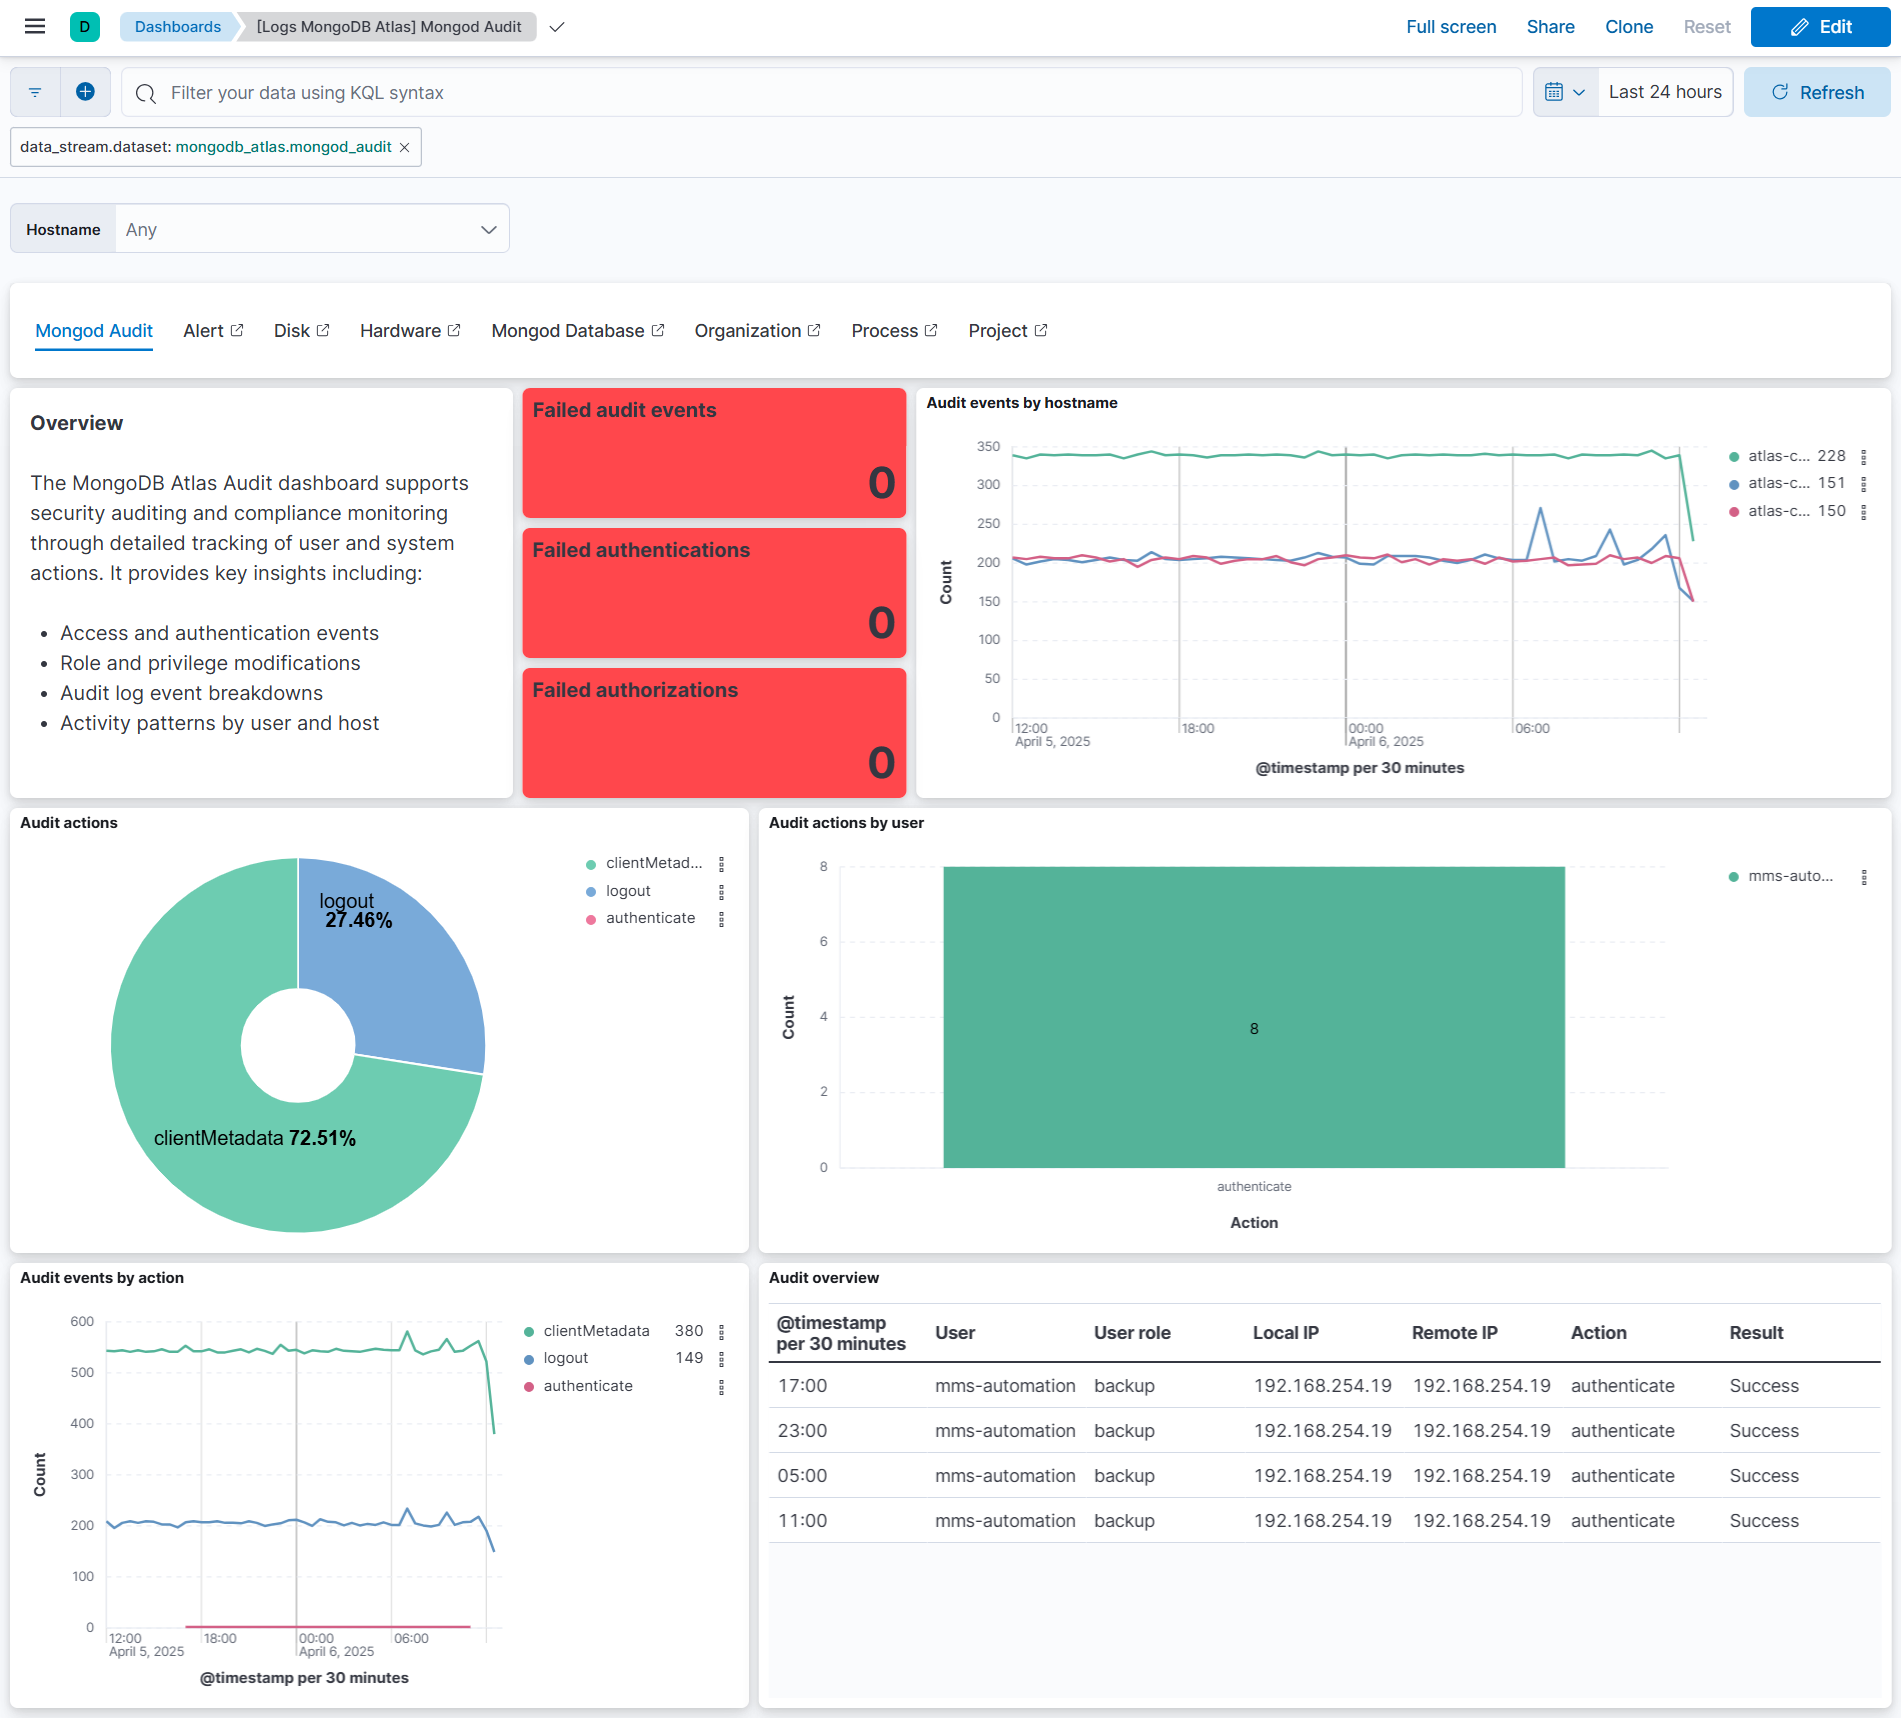
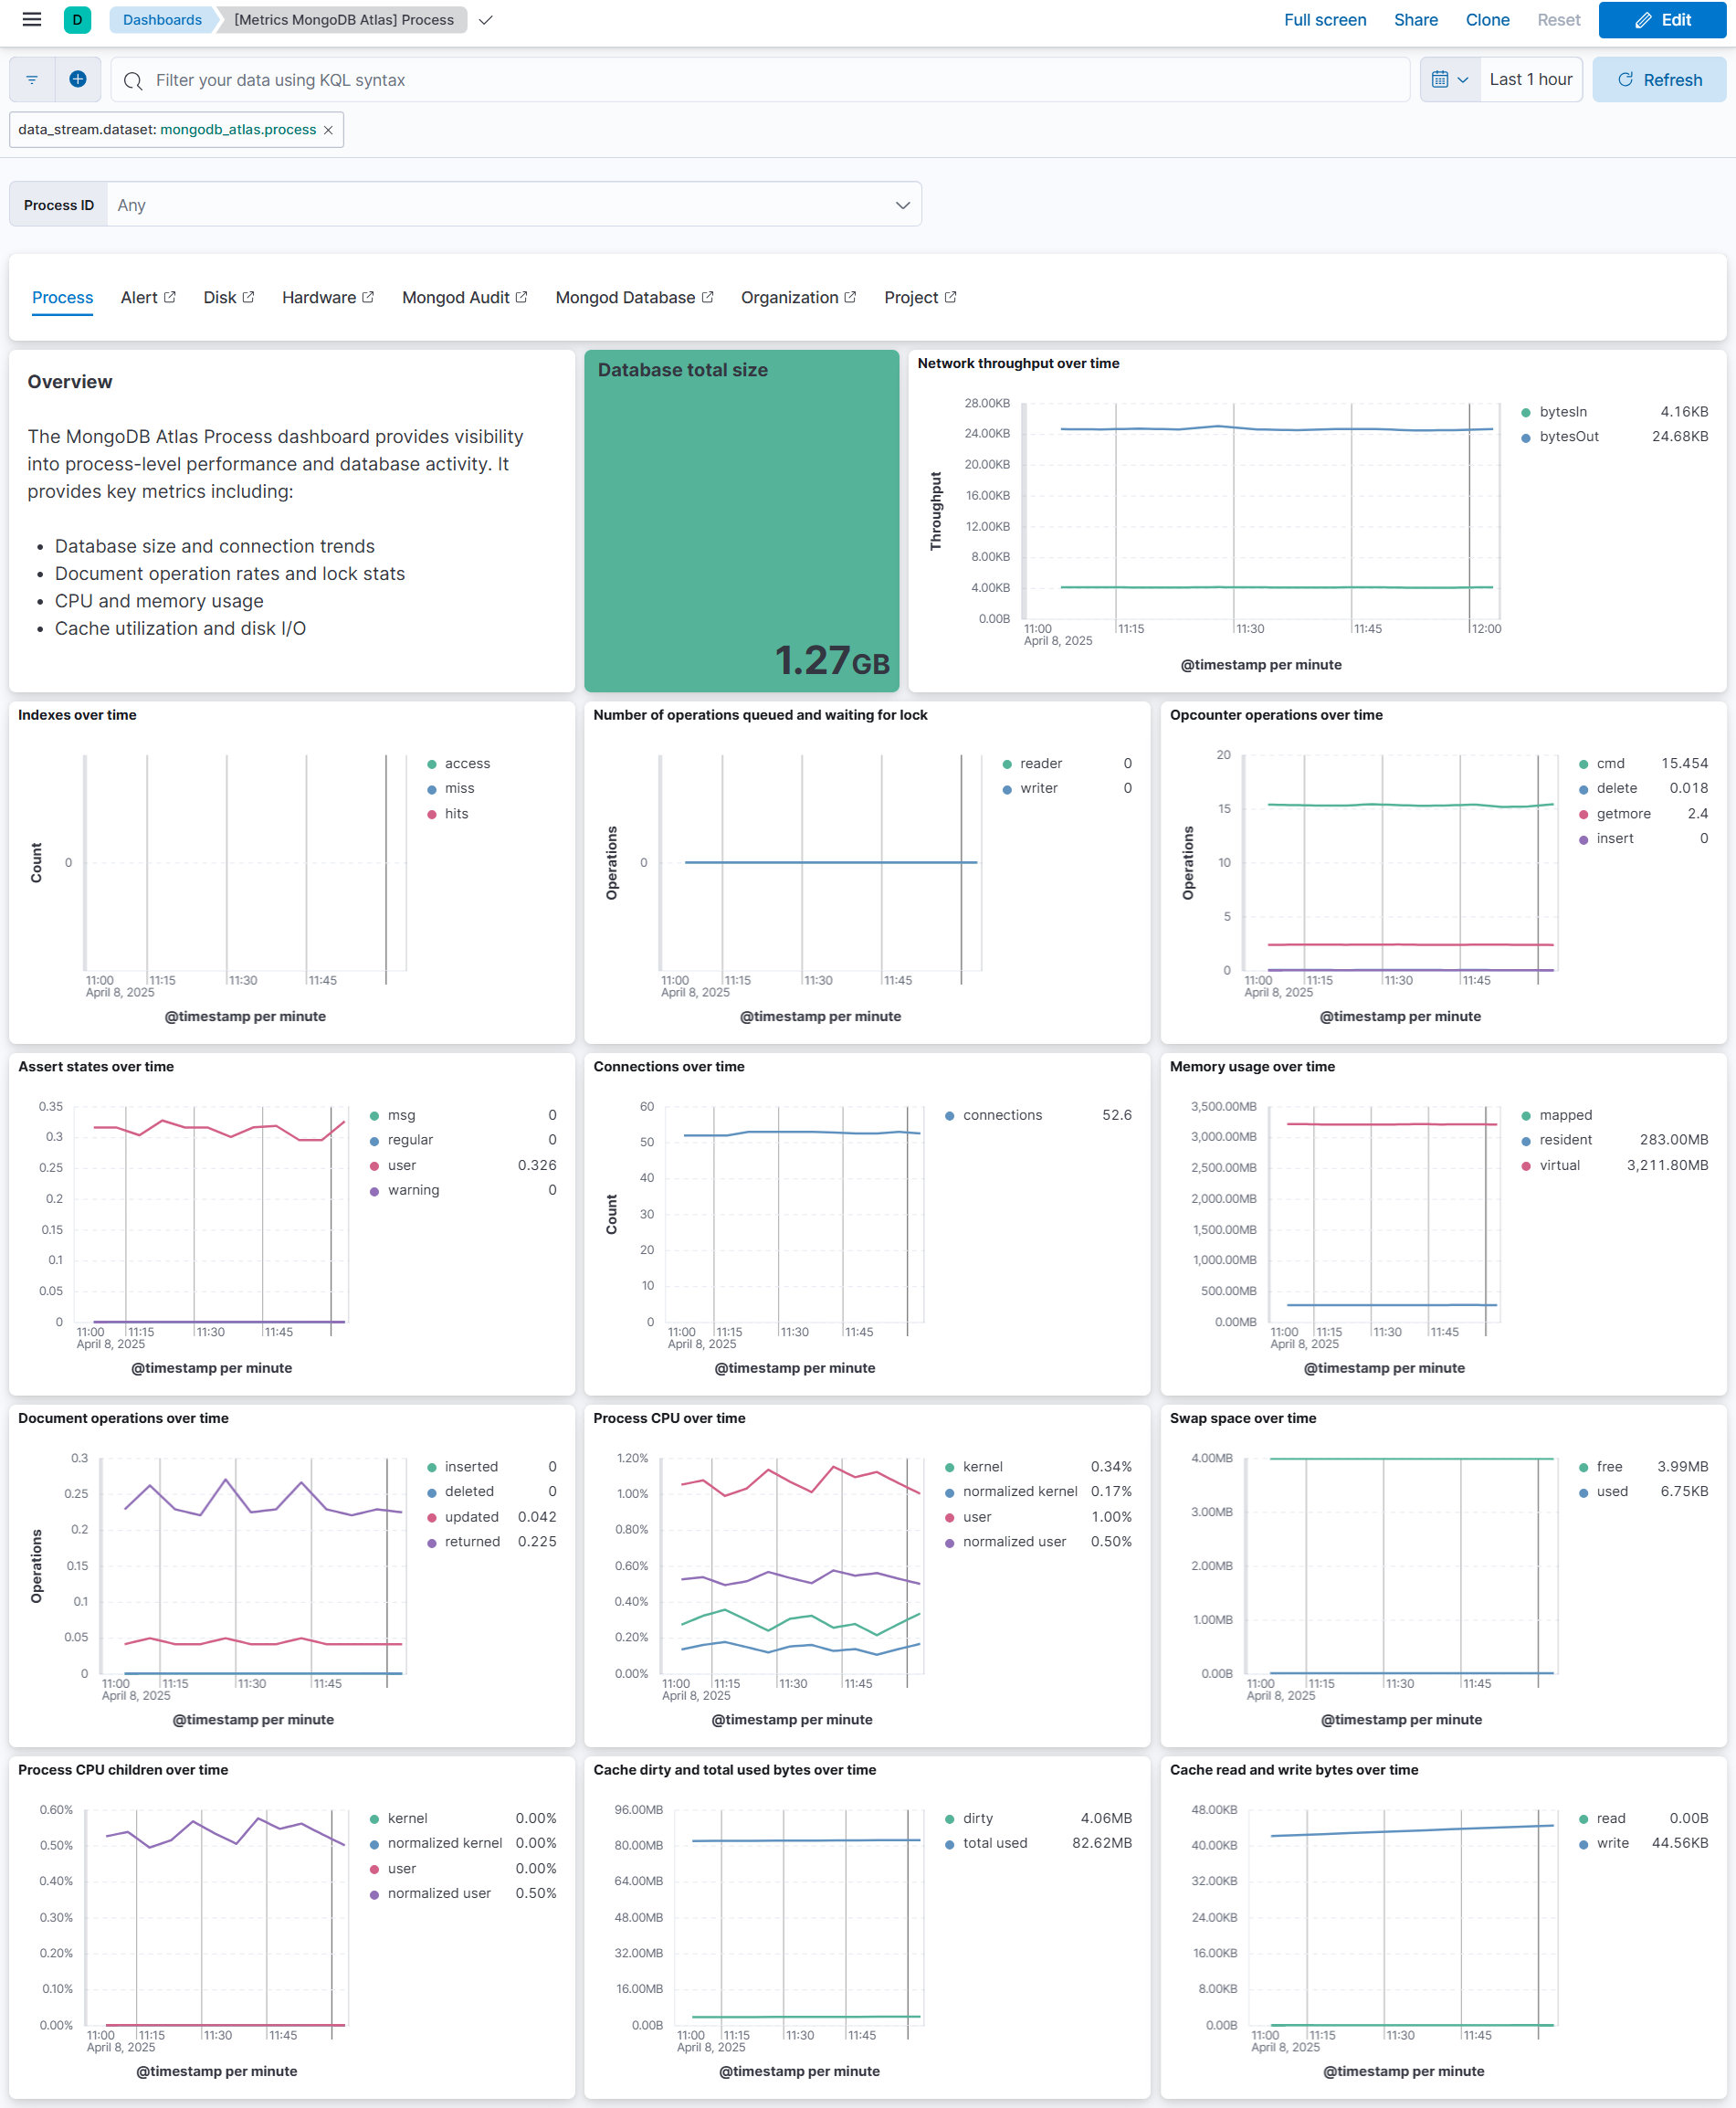
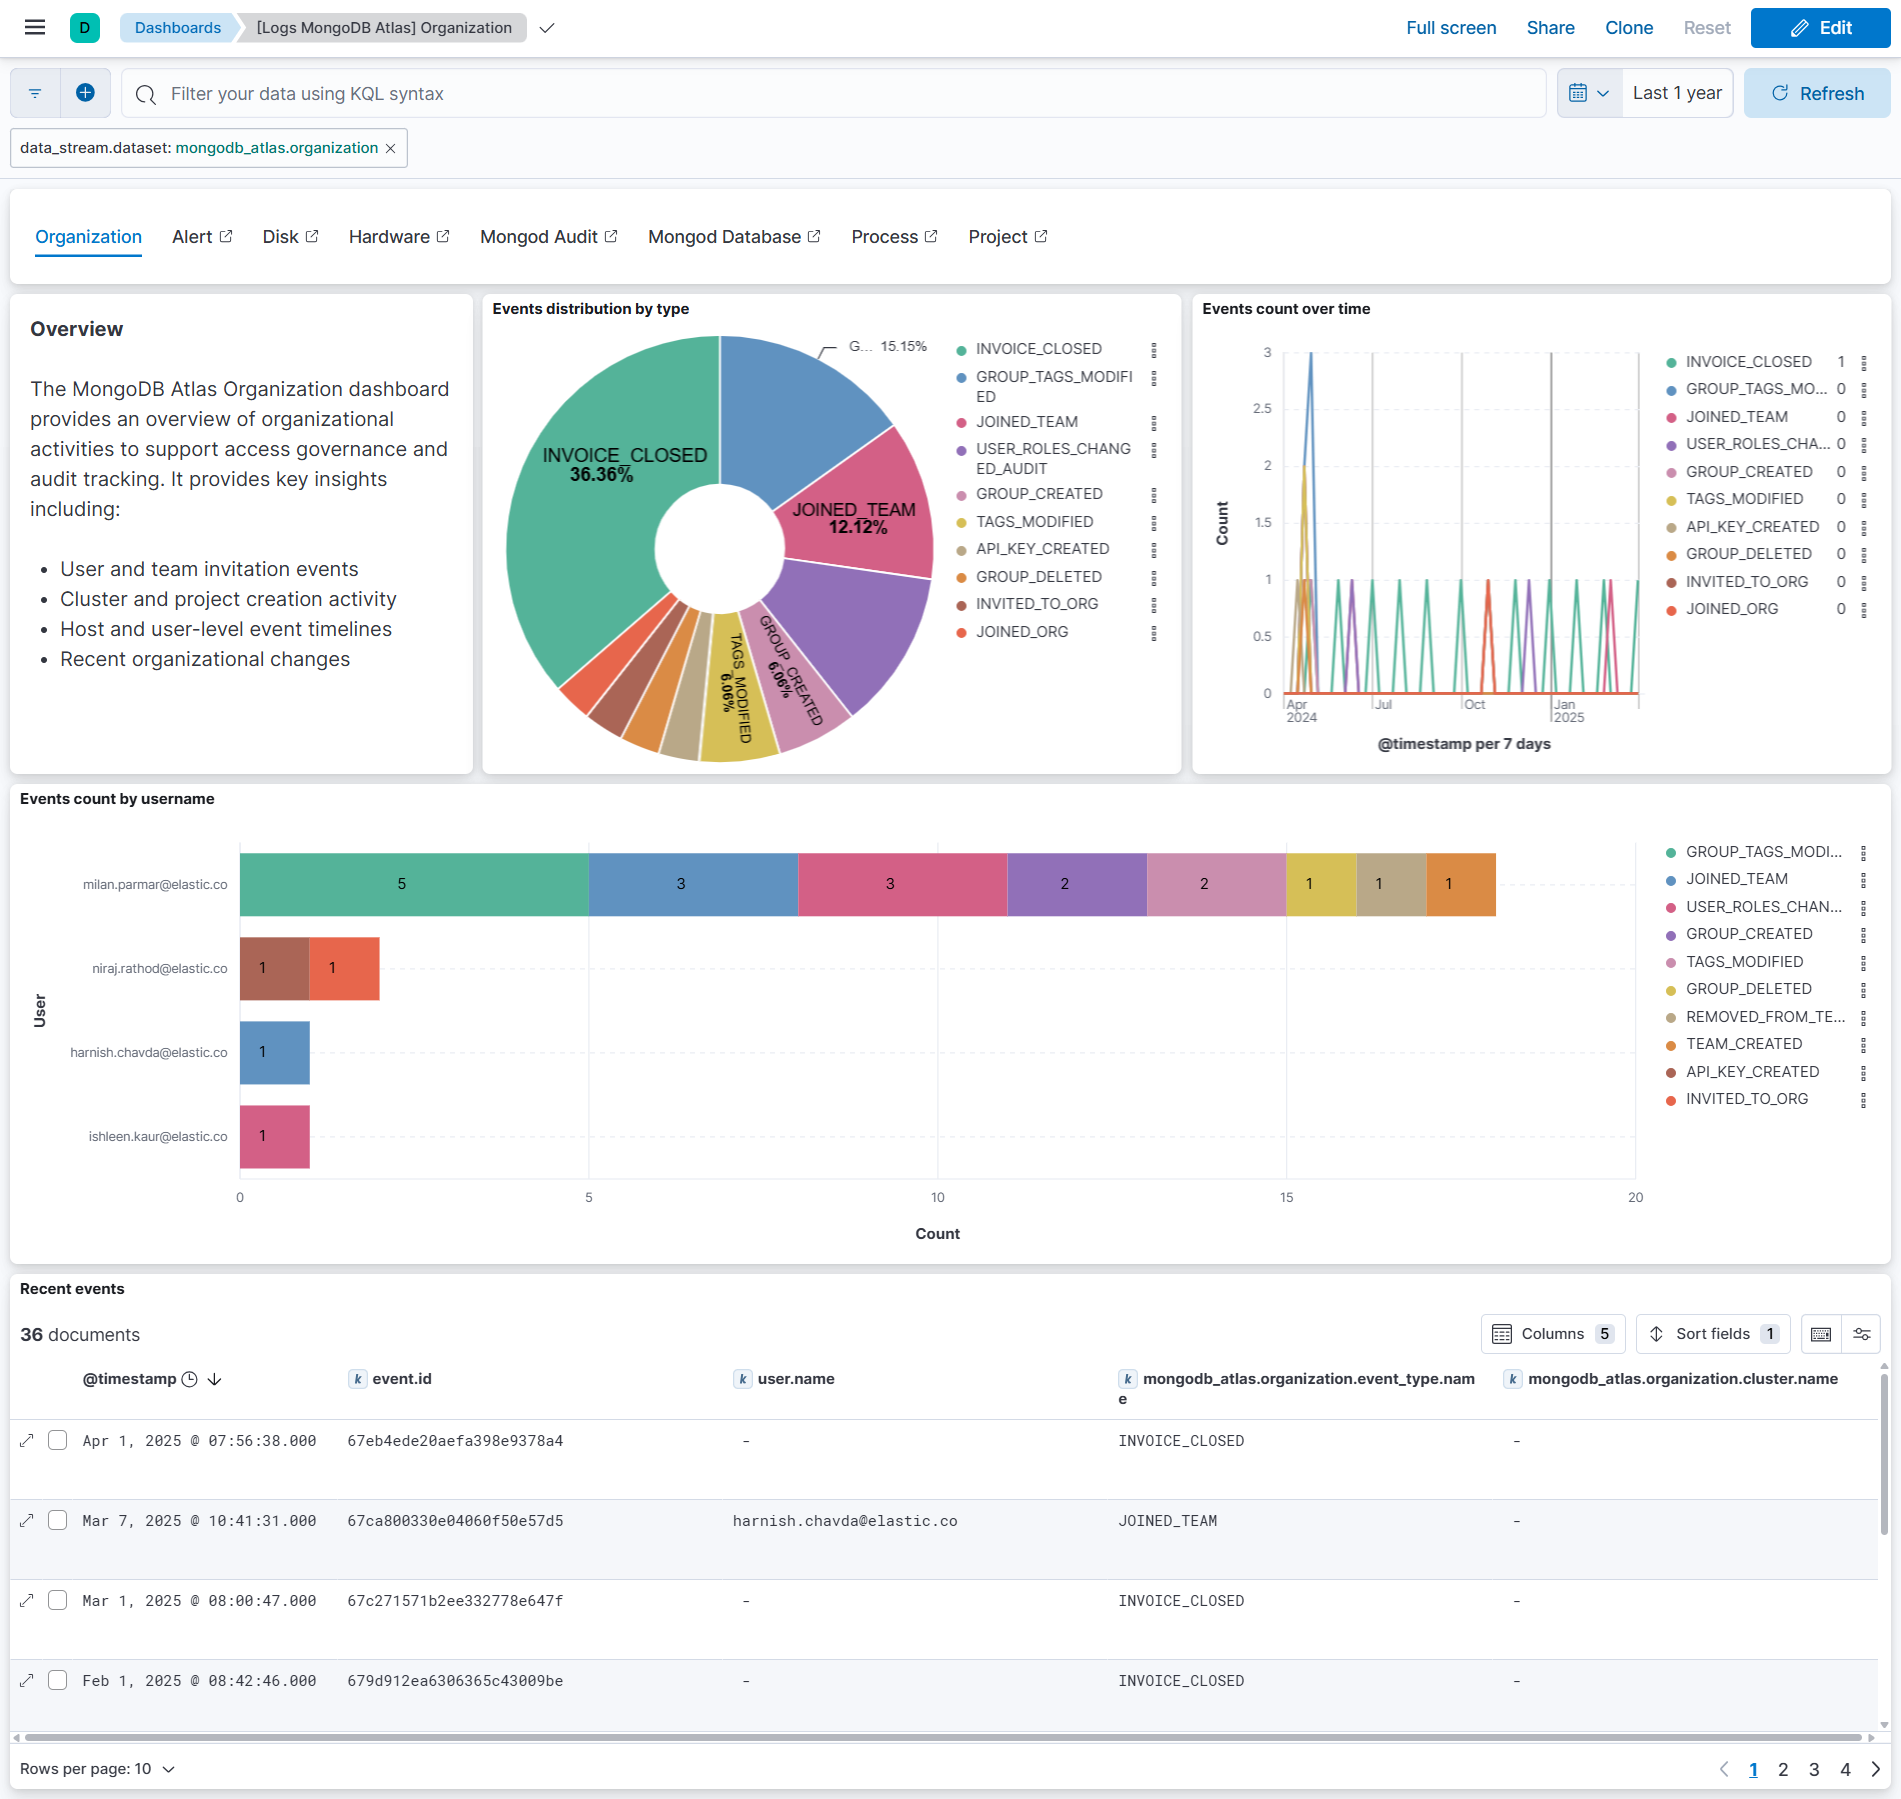
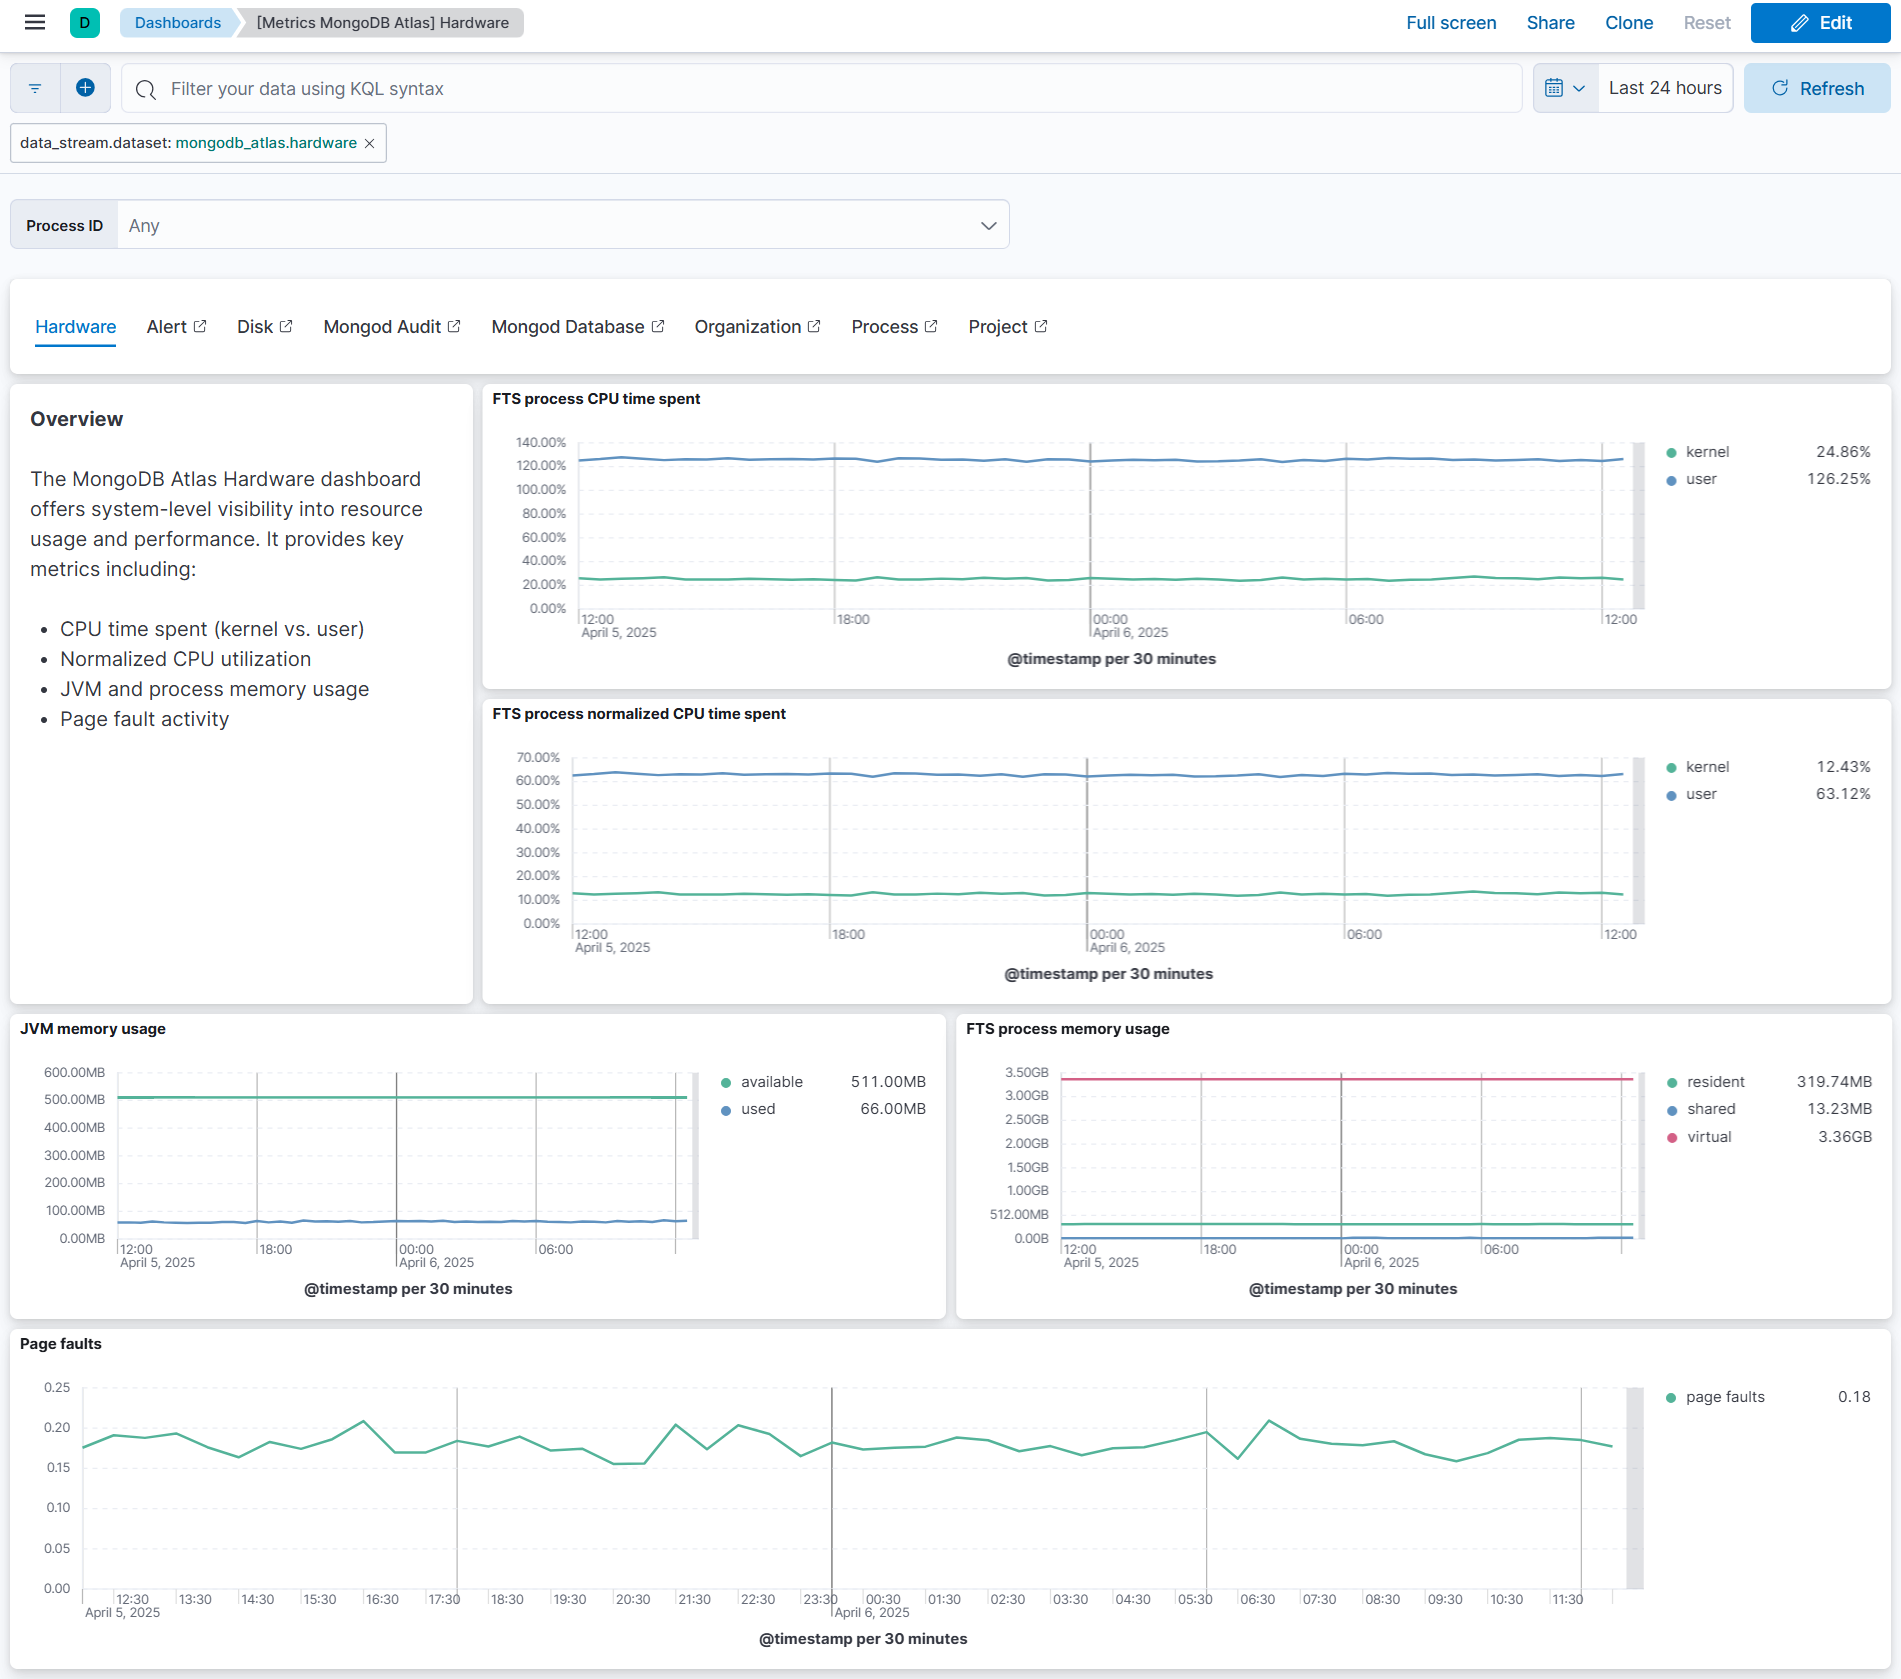
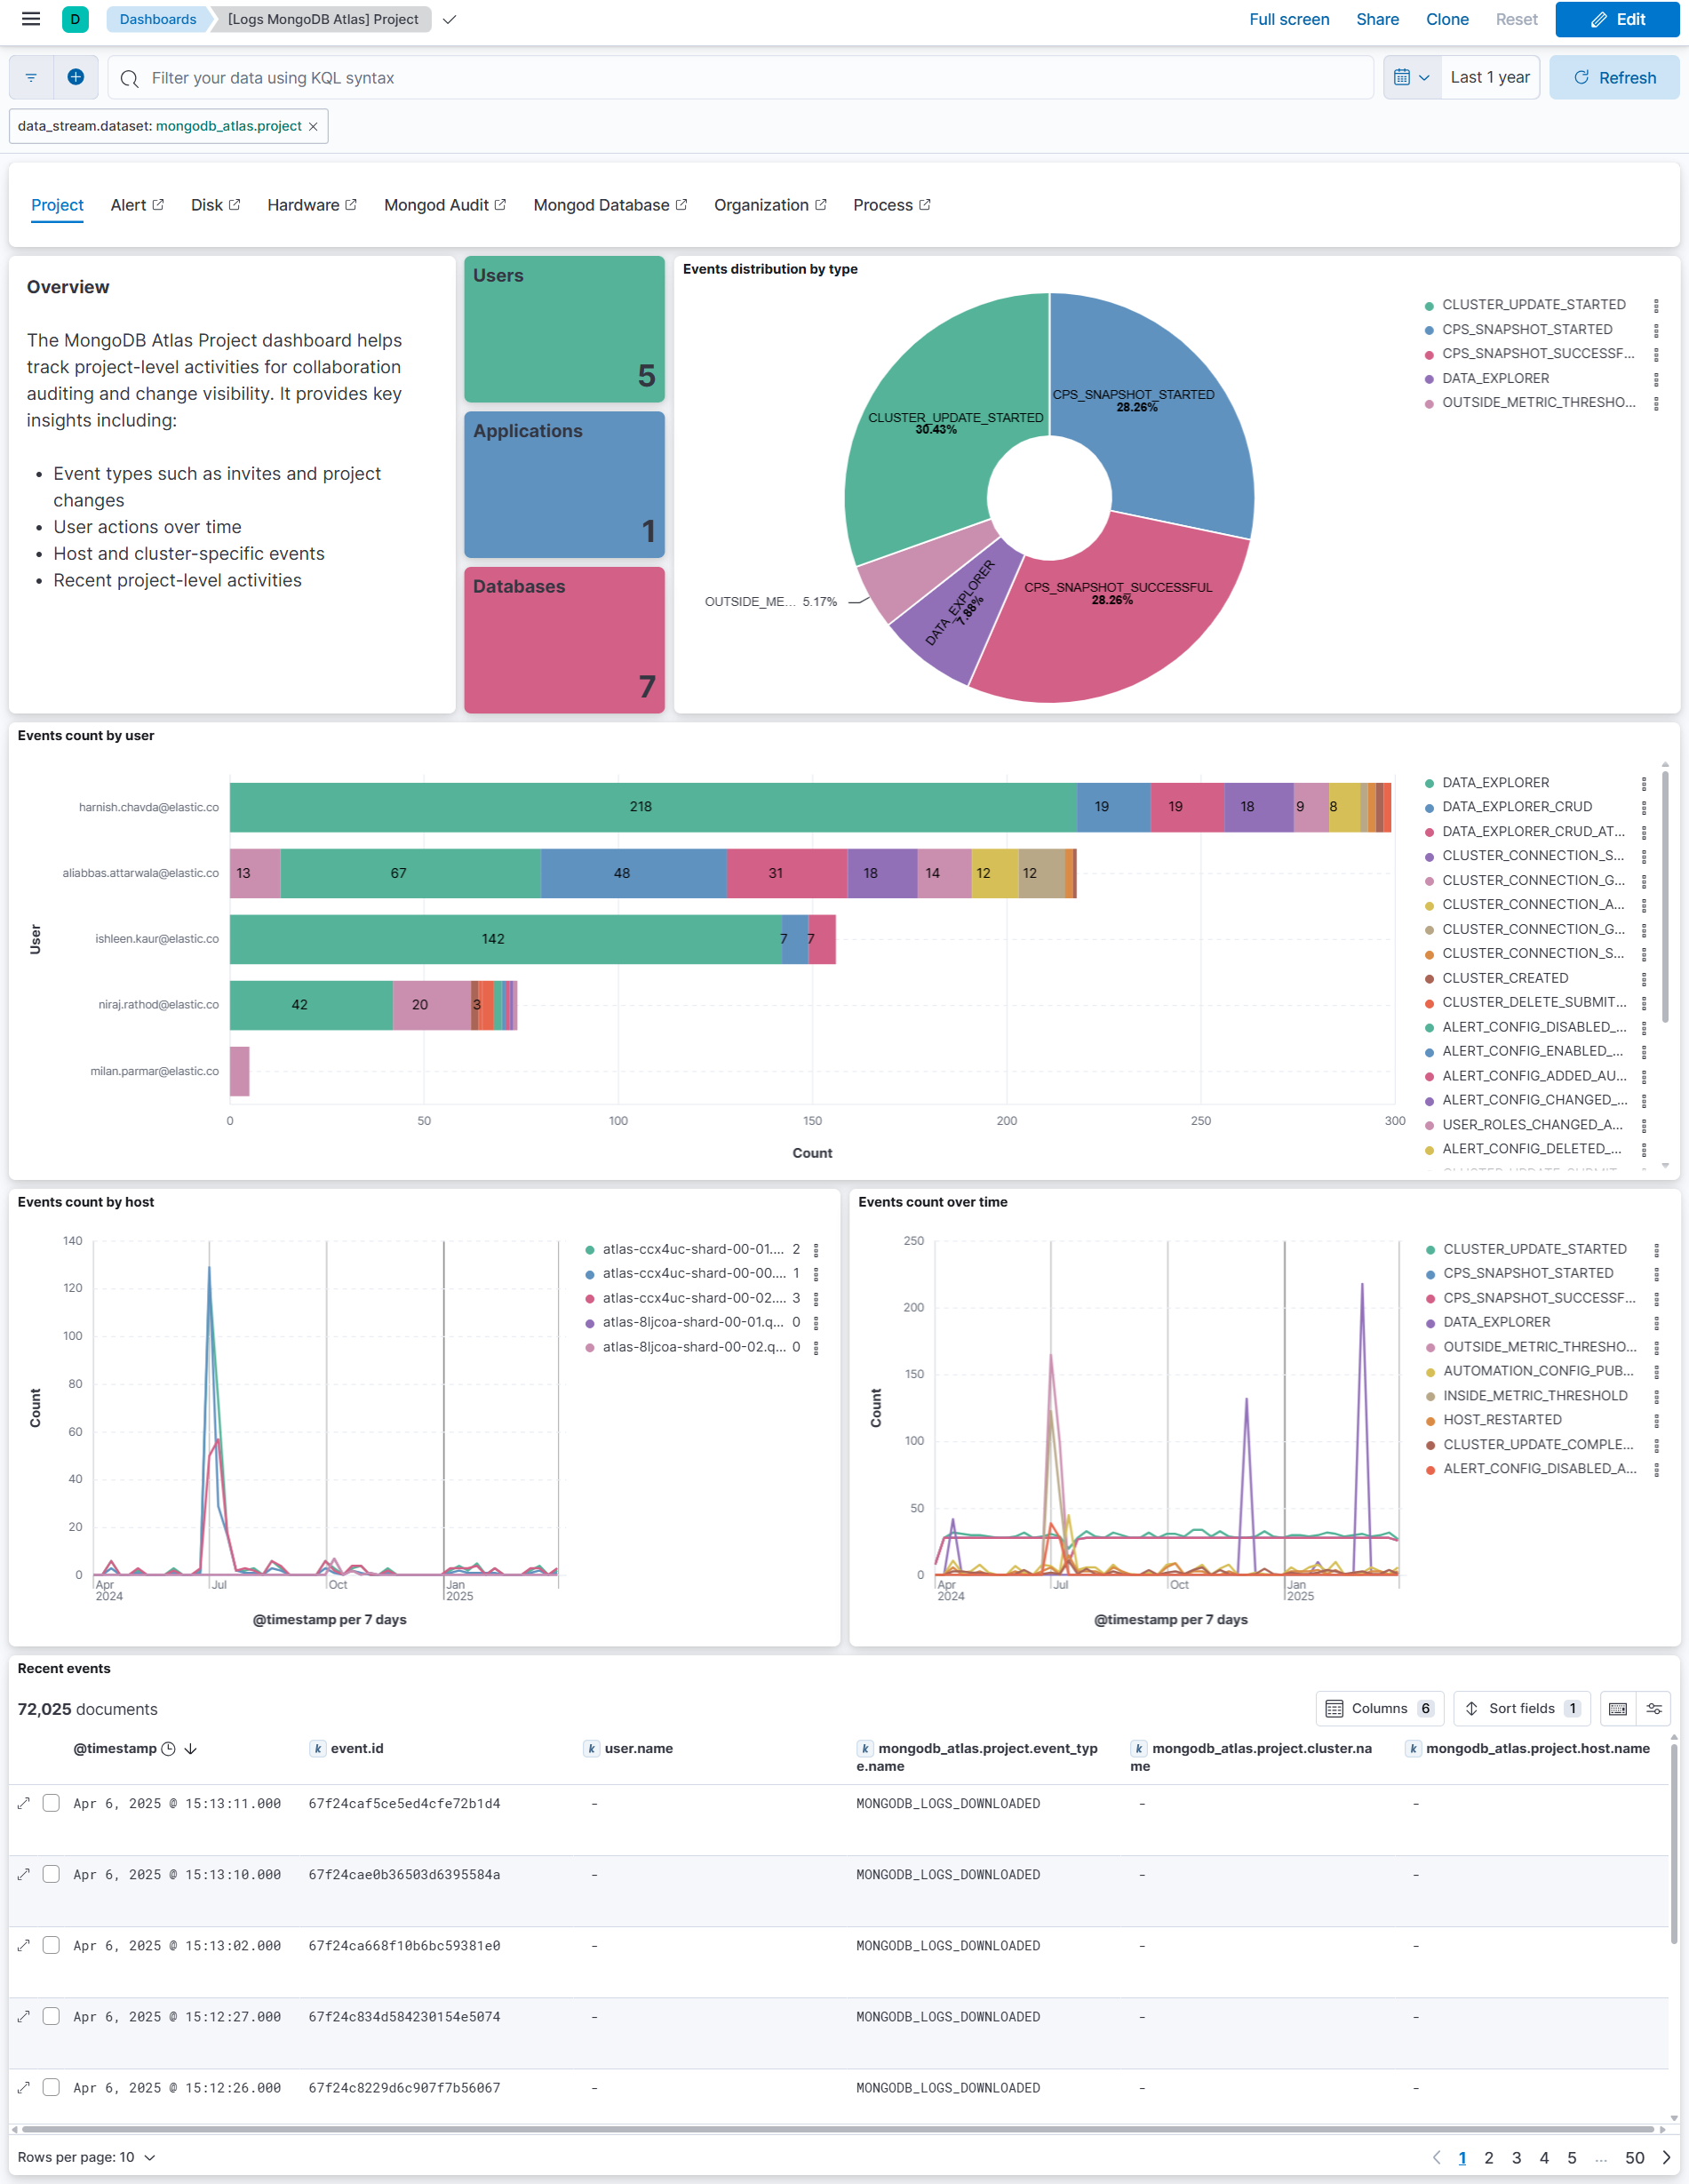
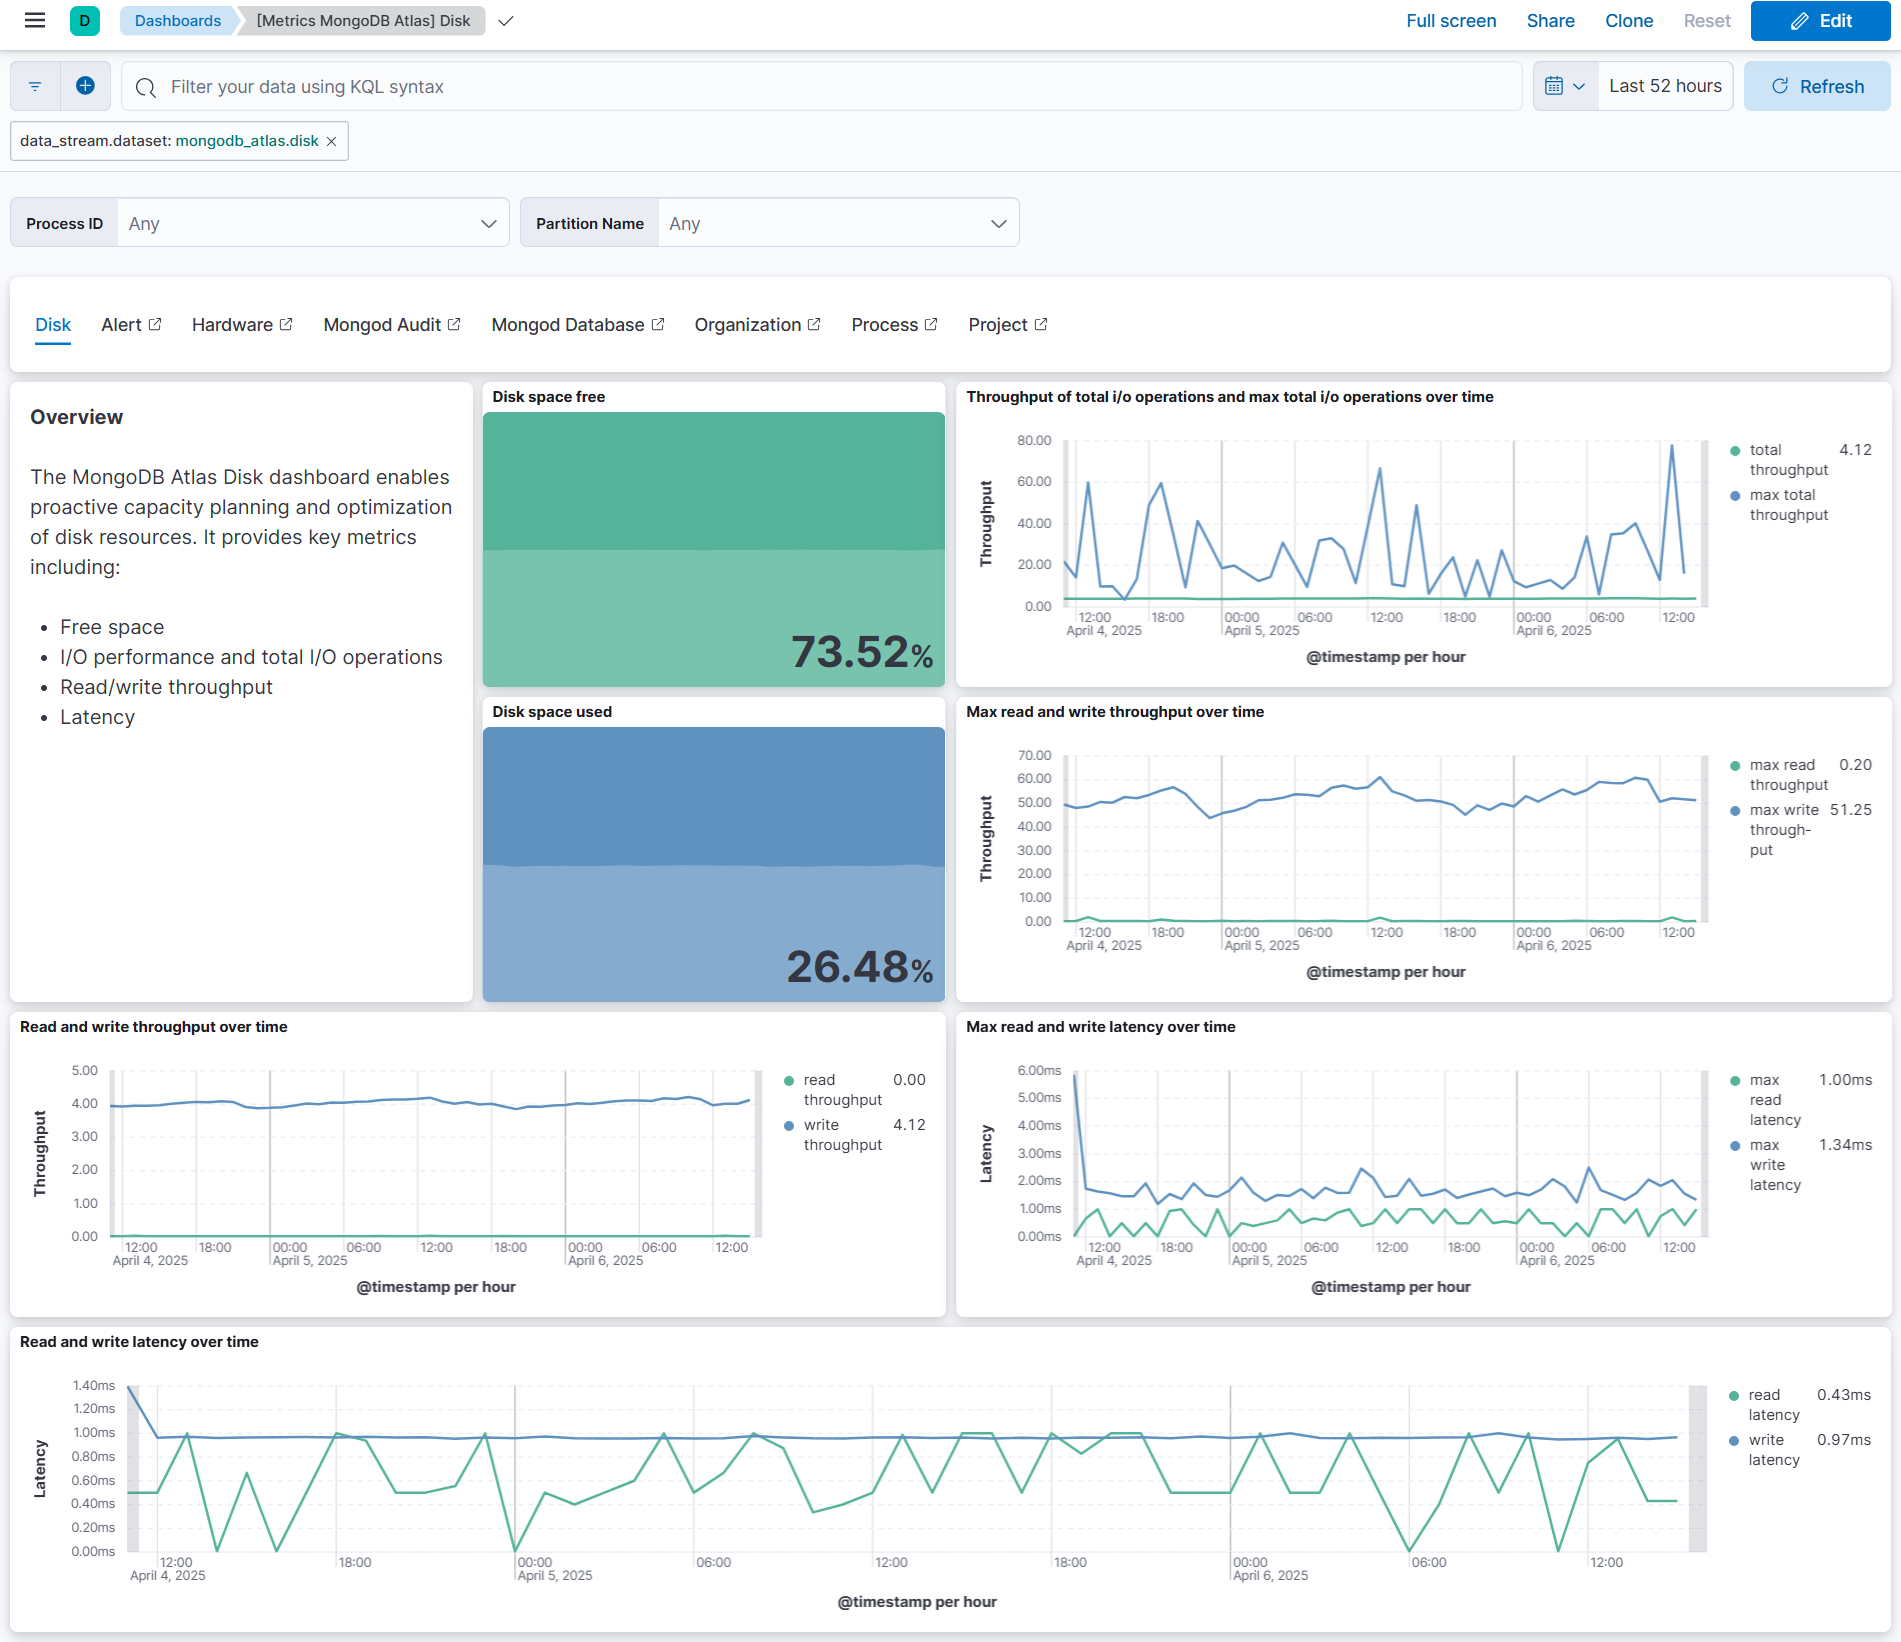
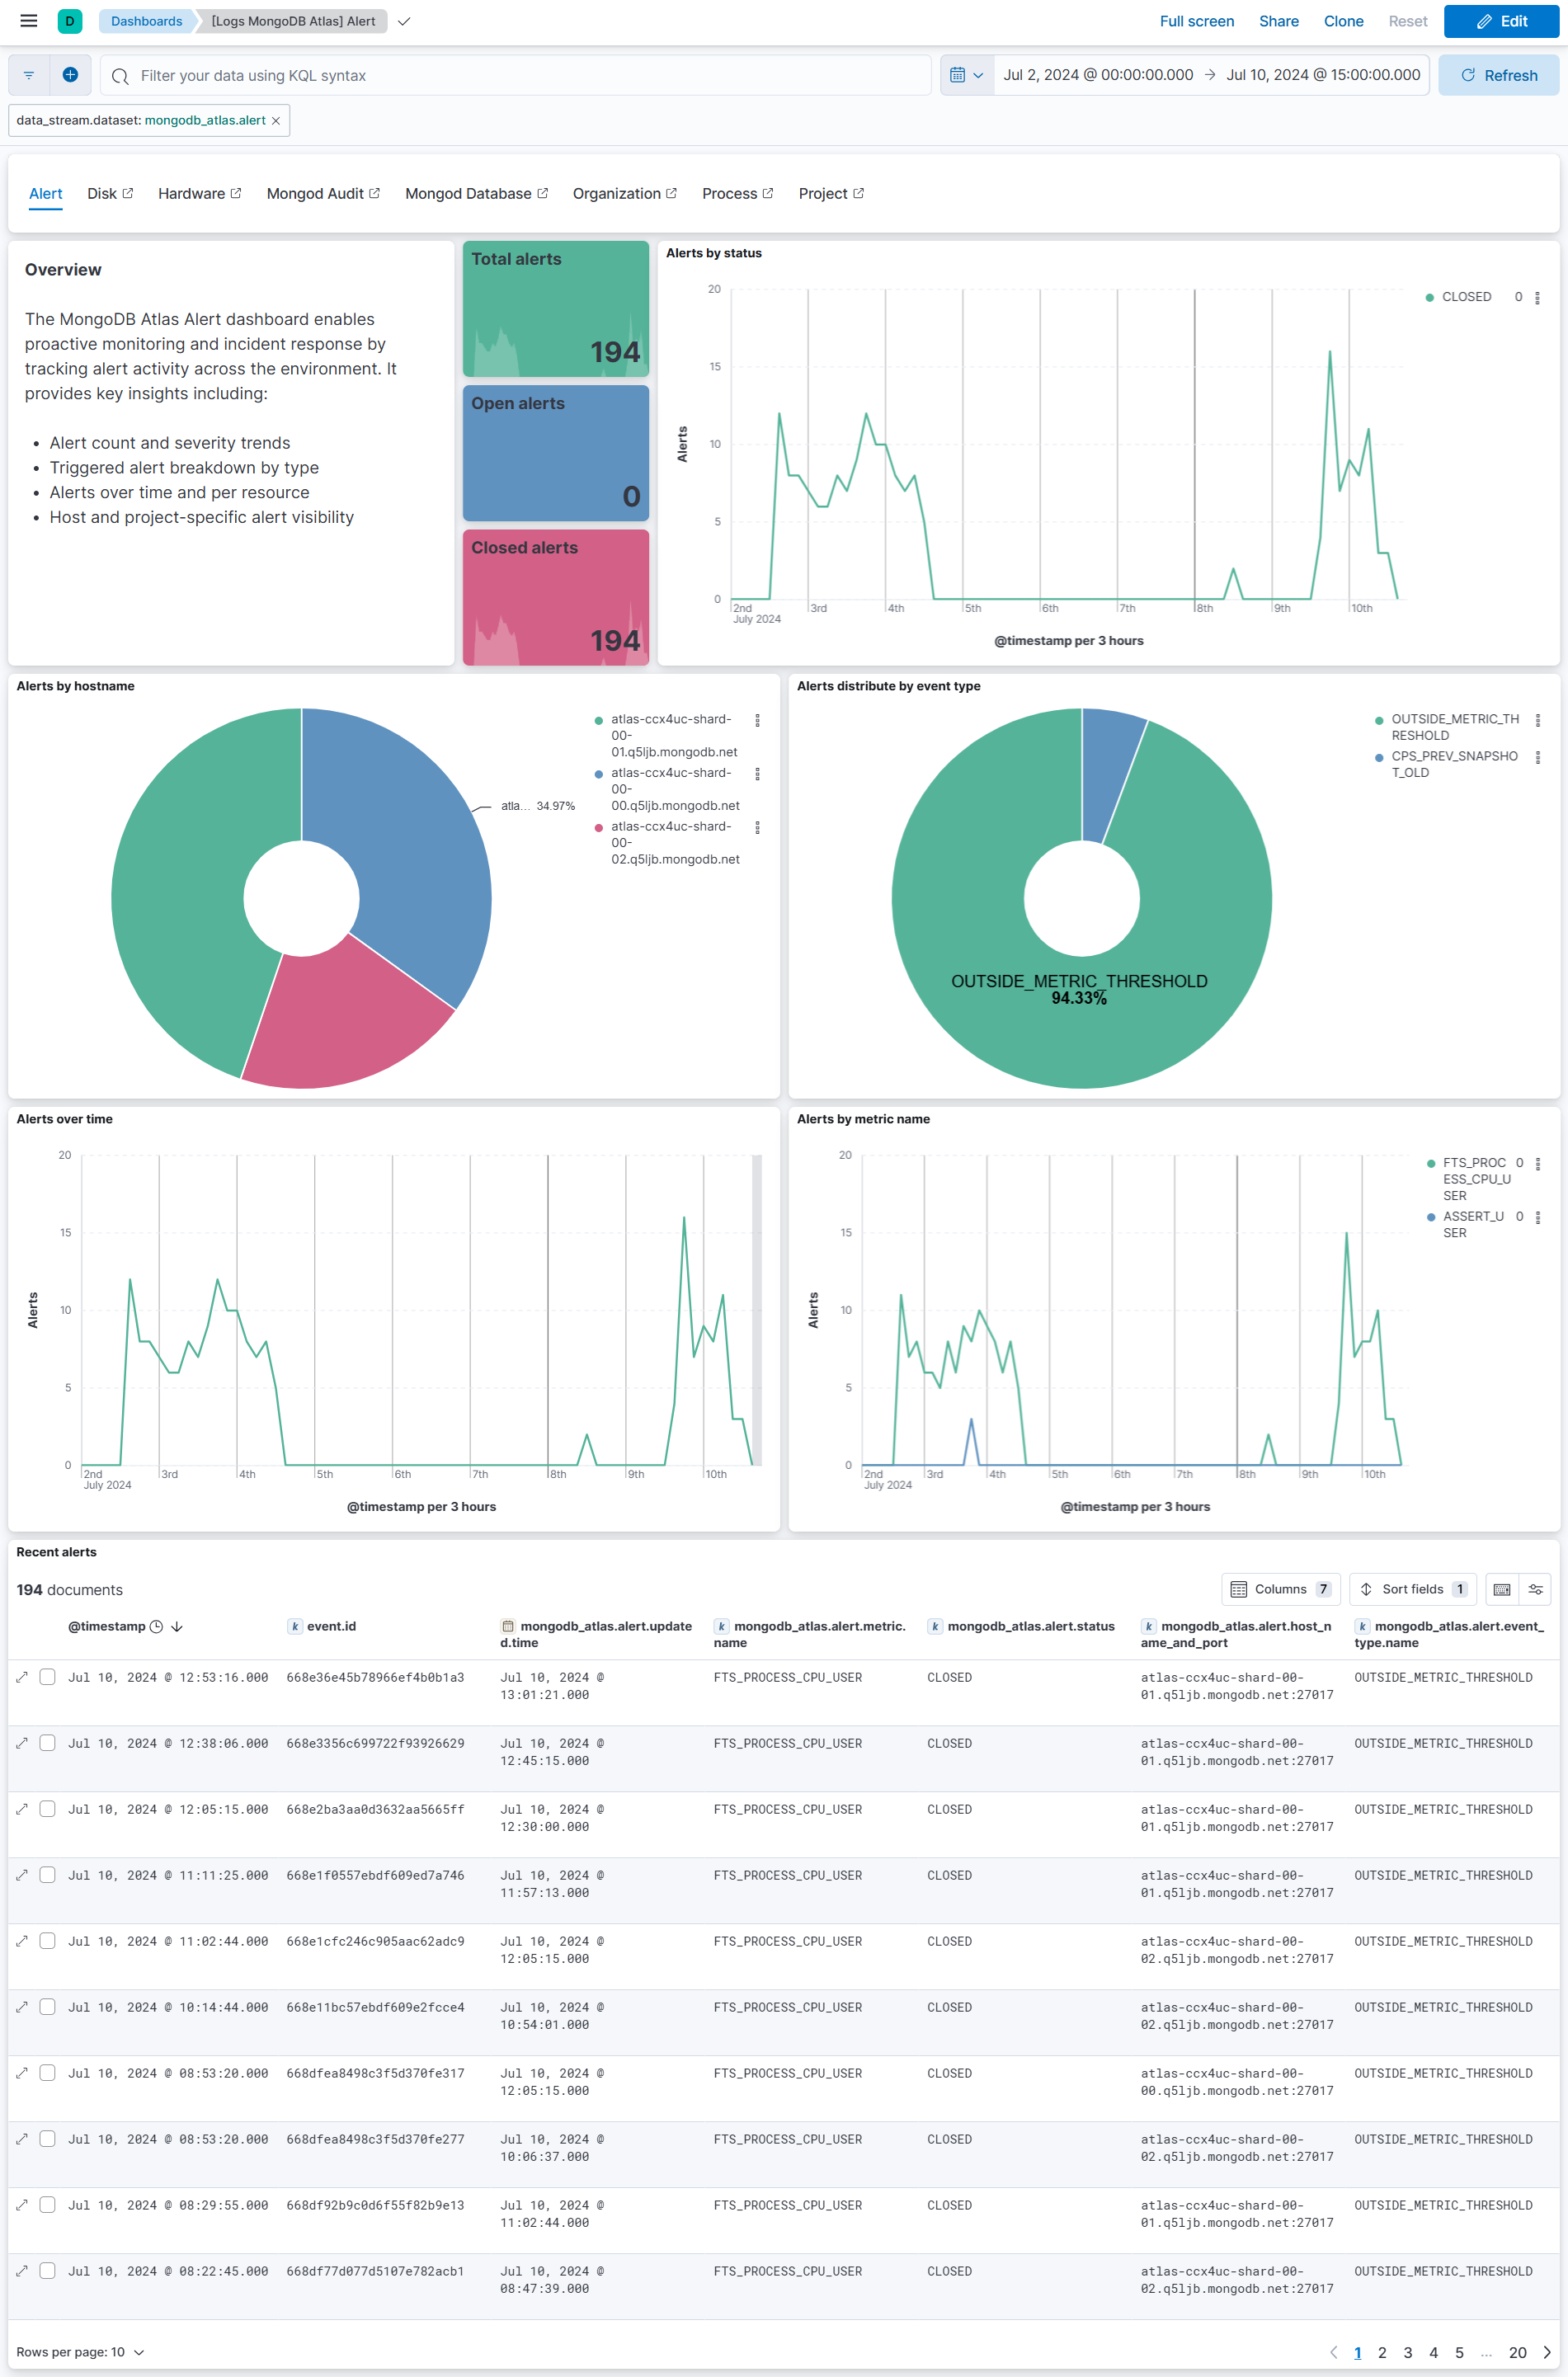
Changelog
| Version | Details | Minimum Kibana version |
|---|---|---|
| 1.4.0 | Enhancement (View pull request) Update Elastic Managed integration documentation to the current wording and docs links. |
9.0.0 8.13.0 |
| 1.3.1 | Bug fix (View pull request) Fix CEL state wipe when process list is empty or pagination exhausts all hosts, and preserve group_id in non-200 measurement error branches, across process, disk, hardware, mongod_database, and mongod_audit data streams. |
9.0.0 8.13.0 |
| 1.3.0 | Enhancement (View pull request) Use new release field for agentless deployment mode to establish as beta. |
9.0.0 8.13.0 |
| 1.2.2 | Bug fix (View pull request) Guard against null value for hostlist in disk, hardware, mongod_audit, mongod_database and process data streams. |
9.0.0 8.13.0 |
| 1.2.1 | Bug fix (View pull request) Fix source.address handling in alert pipeline to be ECS-aligned (write parsed IPs to source.ip, hostnames to source.domain). |
9.0.0 8.13.0 |
| 1.2.0 | Enhancement (View pull request) Enable Agentless deployment. |
9.0.0 8.13.0 |
| 1.1.0 | Enhancement (View pull request) Standardize user fields processing across integrations. |
9.0.0 8.13.0 |
| 1.0.0 | Enhancement (View pull request) Make MongoDB Atlas GA. |
9.0.0 8.13.0 |
| 0.5.0 | Enhancement (View pull request) Update dashboards as per best practices. |
9.0.0 8.13.0 |
| 0.4.0 | Enhancement (View pull request) Update organization data stream with field modifications and added resourceId & resourceType. Update project data stream with field changes, rename user.email to user.name, and update dashboard visualization. |
9.0.0 8.13.0 |
| 0.3.3 | Bug fix (View pull request) Keep consistency in the tooltip descriptions. |
9.0.0 8.13.0 |
| 0.3.2 | Enhancement (View pull request) Improved MongoDB Atlas integration documentation |
9.0.0 8.13.0 |
| 0.2.2 | Bug fix (View pull request) Update dashboard titles and rename accessListEntry field to whitelistEntry. |
9.0.0 8.13.0 |
| 0.2.1 | Bug fix (View pull request) Avoid using dynamic template for flattened fields. |
9.0.0 8.13.0 |
| 0.2.0 | Enhancement (View pull request) Add support for Kibana 9.0.0. |
9.0.0 8.13.0 |
| 0.1.2 | Bug fix (View pull request) Fix error handling mechanism in alert, mongod_audit, mongod_database, organization and project data streams. Update data type from object to flattened for mongod_audit.param and mongod_database.attributes fields to prevent data conflict/loss. |
8.13.0 |
| 0.1.1 | Bug fix (View pull request) Fix error handling mechanism in disk, hardware and process data streams. |
8.13.0 |
| 0.1.0 | Enhancement (View pull request) Add observability category. |
8.13.0 |
| 0.0.10 | Bug fix (View pull request) Fix single event object returned by evaluation error for hardware, process and disk data streams. |
8.13.0 |
| 0.0.9 | Enhancement (View pull request) MongoDB Atlas integration package with "disk" data stream. |
8.13.0 |
| 0.0.8 | Enhancement (View pull request) MongoDB Atlas integration package with "alert" data stream. |
8.13.0 |
| 0.0.7 | Enhancement (View pull request) MongoDB Atlas integration package with "project" data stream. |
8.13.0 |
| 0.0.6 | Enhancement (View pull request) Add global filter on data_stream.dataset to improve performance. |
8.13.0 |
| 0.0.5 | Enhancement (View pull request) MongoDB Atlas integration package with "organization" data stream. |
8.13.0 |
| 0.0.4 | Enhancement (View pull request) MongoDB Atlas integration package with "hardware" data stream. |
8.13.0 |
| 0.0.3 | Enhancement (View pull request) MongoDB Atlas integration package with "mongod_database" data stream. |
8.13.0 |
| 0.0.2 | Enhancement (View pull request) MongoDB Atlas integration package with "mongod_audit" data stream. |
8.13.0 |
| 0.0.1 | Enhancement (View pull request) MongoDB Atlas integration package with "process" data stream. |
8.13.0 |