Oracle Integration
Elastic Cloud Serverless projects are autoscaled environments, fully managed by Elastic and available on Elastic Cloud. Availability This functionality is generally available and ready for production usage. Elastic Cloud Serverless projects are autoscaled environments, fully managed by Elastic and available on Elastic Cloud. Availability This functionality is generally available and ready for production usage. The Elastic Stack includes Elastic's core products such as Elasticsearch, Kibana, Logstash, and Beats. Availability This functionality is generally available and ready for production usage. Unless stated otherwise on the page, this functionality is available when your Elastic Stack is deployed on Elastic Cloud Hosted, Elastic Cloud Enterprise, Elastic Cloud on Kubernetes, and self-managed environments. This documentation corresponds to the latest patch available for each minor version. If you're not using the latest patch, check the release notes for changes.
Serverless Observability
Generally available
Serverless Security
Generally available
Stack
9.0+
Generally available since 9.0
| Version | 1.31.4 (View all) |
| Subscription level What's this? |
Basic |
| Developed by What's this? |
Elastic |
| Ingestion method(s) | Database, File |
| Minimum Kibana version(s) | 9.0.0 8.13.0 |
Use the Oracle integration to ingest Oracle Database audit logs and collect database metrics for operational visibility and troubleshooting.
This integration has been tested with Oracle Database 19c, and should work for 18c as well though it has not been tested.
This integration collects:
- Audit logs from Oracle Database audit trail files.
- Metrics covering tablespace usage, system metrics, memory, system statistics, and performance.
The Oracle integration expects an *.aud audit file that is generated from Oracle Databases by default. If disabled, refer to the Oracle Database Audit Trail Documentation.
Connectivity to Oracle can be facilitated in two ways: by using official Oracle libraries, or by using a JDBC driver. Connectivity through JDBC is currently not supported with Metricbeat.
To get connected with the Oracle Database, you must set the following environment variables: ORACLE_SID, ORACLE_BASE, ORACLE_HOME.
For example, let’s consider Oracle Database 21c installation using RPM manually by following the Oracle Installation instructions. The environment variables should be set as follows:
ORACLE_SID=ORCLCDBORACLE_BASE=/opt/oracle/oradataORACLE_HOME=/opt/oracle/product/21c/dbhome_1
Also, add $ORACLE_HOME/bin to the PATH environment variable.
- In Kibana, go to Management > Integrations.
- In the "Search for integrations" search bar, type Oracle.
- Click the Oracle integration from the search results.
- Click the Oracle button to add the integration.
- Configure:
- Logs (audit trail): point the Elastic Agent filestream input to the Oracle audit file location (*.aud).
- Metrics (SQL input): provide an Oracle DSN.
- Click Save and Continue to save the integration.
Oracle Instant Client (OCI) enables development and deployment of applications that connect to Oracle Database. The Instant Client libraries provide the necessary network connectivity and advanced data features to make full use of Oracle Database. If you have OCI Oracle server which comes with these libraries pre-installed, you don't need a separate client installation.
The OCI library installs few Client Shared Libraries that must be referenced on the machine where Metricbeat is installed. To set up the OCI Instant Client, follow the Oracle Client Installation instructions. The OCI Instant Client is available with the Oracle Universal Installer, RPM file or ZIP file that you can download from the Oracle Instant Client Download page.
If Elastic Agent is running as a systemd service and not using ldconfig is an option, to update the links to the shared libraries, you can use the LD_LIBRARY_PATH environment variable. Follow these steps to make sure that Elastic Agent and its spawned processes respect the LD_LIBRARY_PATH environment variable.
Make sure that you have administrative privileges to modify the Elastic Agent systemd service configuration.
Check the status of the Elastic Agent systemd service by running the following command:
systemctl status elastic-agent.serviceTake note of the path to theelastic-agent.servicefile, which is typically located in the systemd service directory. Example path:/etc/systemd/system/elastic-agent.serviceOpen the
elastic-agent.servicefile in your preferred text editor, find theEnvironmentFilekey (commonly found at/etc/sysconfig/elastic-agent), and verify its contents, as these configurations are essential for the elastic-agent's runtime environment initialization. If the EnvironmentFile is absent, create it and set the necessary permissions to ensure the elastic-agent has full access.Add the
LD_LIBRARY_PATHenvironment variable to the configuredEnvironmentFile. Set it to the directory where libraries (libclntsh.so) are located. For example, if your libraries are in the/opt/oracle/instantclient_21_1 directory, add the following line to theEnvironmentFile(for example,/etc/systemd/system/elastic-agent.service)LD_LIBRARY_PATH=/opt/oracle/instantclient_21_1Save the changes made to the configured
EnvironmentFile.Restart the Elastic Agent systemd service to apply the changes by running the following command:
systemctl restart elastic-agent.service
Make sure that you replace /opt/oracle/instantclient_21_1 with the actual path to the directory where the required libraries (libclntsh.so) are located. This will set the library search path for the Elastic Agent service to include the specified directory, allowing it to locate the required libraries.
The Oracle listener is a service that runs on the database host and receives requests from Oracle clients. Make sure that Listener is running by using this command:
lsnrctl STATUS
If the listener is not running, use the command to start:
lsnrctl START
Then, you can launch Metricbeat.
The following two configuration formats are supported:
oracle://<user>:<password>@<connection_string>
user="<user>" password="<password>" connectString="<connection_string>" sysdba=<true|false>
Example values are:
oracle://sys:Oradoc_db1@0.0.0.0:1521/ORCLCDB.localdomain?sysdba=1
user="sys" password="Oradoc_db1" connectString="0.0.0.0:1521/ORCLCDB.localdomain" sysdba=true
In the URL-based format, special characters should be URL encoded.
In the logfmt-encoded DSN format, if the password contains a backslash
character (\), it must be escaped with another backslash. For example, if the
password is my\_password, it must be written as my\\_password.
To mask the password shown in the DSN, remove the username and password from the DSN string, and configure the DSN to only include the host address and any additional parameters required for the connection. Subsquently, use the username and password fields under advanced options to configure them.
To configure Oracle Integration to connect to databases using TLS ports, configure the connection string using this format:
user="elastic_ro" password="" connectString="(DESCRIPTION = (ADDRESS_LIST = (ADDRESS = (PROTOCOL = TCPS)(HOST=0.0.0.0)(PORT=1832))) (CONNECT_DATA = (SERVICE_NAME = THESERVICENAME)))" sysdba=false
The database_audit dataset collects Oracle Audit logs.
ECS Field Reference
Refer to the following document for detailed information on ECS fields.
Exported fields
| Field | Description | Type |
|---|---|---|
| @timestamp | Event timestamp. | date |
| cloud.image.id | Image ID for the cloud instance. | keyword |
| data_stream.dataset | Data stream dataset. | constant_keyword |
| data_stream.namespace | Data stream namespace. | constant_keyword |
| data_stream.type | Data stream type. | constant_keyword |
| event.dataset | Event dataset | constant_keyword |
| event.module | Event module | constant_keyword |
| host.containerized | If the host is a container. | boolean |
| host.os.build | OS build information. | keyword |
| host.os.codename | OS codename, if any. | keyword |
| input.type | Input type | keyword |
| log.file.device_id | ID of the device containing the filesystem where the file resides. | keyword |
| log.file.fingerprint | The sha256 fingerprint identity of the file when fingerprinting is enabled. | keyword |
| log.file.idxhi | The high-order part of a unique identifier that is associated with a file. (Windows-only) | keyword |
| log.file.idxlo | The low-order part of a unique identifier that is associated with a file. (Windows-only) | keyword |
| log.file.inode | Inode number of the log file. | keyword |
| log.file.vol | The serial number of the volume that contains a file. (Windows-only) | keyword |
| log.flags | related log flags | |
| log.offset | Log offset | long |
| message | human-readable summary of the event | text |
| oracle.database_audit.action | The action performed during the audit event. This could for example be the raw query. | keyword |
| oracle.database_audit.action_number | Action is a numeric value representing the action the user performed. The corresponding name of the action type is in the AUDIT_ACTIONS table. For example, action 100 refers to LOGON. | keyword |
| oracle.database_audit.client.address | The IP Address or Domain used by the client. | keyword |
| oracle.database_audit.client.terminal | If available, the client terminal type, for example "pty". | keyword |
| oracle.database_audit.client.user | The user running the client or connection to the database. | keyword |
| oracle.database_audit.comment_text | Additional comments about the related audit record. | text |
| oracle.database_audit.database.host | Client host machine name. | keyword |
| oracle.database_audit.database.id | Database identifier calculated when the database is created. It corresponds to the DBID column of the V$DATABASE data dictionary view. | keyword |
| oracle.database_audit.database.user | The database user used to authenticate. | keyword |
| oracle.database_audit.entry.id | Indicates the current audit entry number, assigned to each audit trail record. The audit entry.id sequence number is shared between fine-grained audit records and regular audit records. | long |
| oracle.database_audit.length | Refers to the total number of bytes used in this audit record. This number includes the trailing newline bytes (\n), if any, at the end of the audit record. | long |
| oracle.database_audit.obj_creator | The owner of the object, equivalent field in DBA_AUDIT_Trail is OWNER. | keyword |
| oracle.database_audit.obj_name | The name of the object. | keyword |
| oracle.database_audit.os_userid | The related OS user. | keyword |
| oracle.database_audit.privilege | The privilege group related to the database user. | keyword |
| oracle.database_audit.returncode | Indicates if the audited action was successful. 0 indicates success. If the action fails, the return code lists the Oracle Database error number. | keyword |
| oracle.database_audit.ses_actions | Defines the type of action performed using 12 characters, each position indicates the result of an action. They are: ALTER, AUDIT, COMMENT, DELETE, GRANT, INDEX, INSERT, LOCK, RENAME, SELECT, UPDATE, and FLASHBACK. | keyword |
| oracle.database_audit.ses_tid | The ID of the object related to the audit event. | keyword |
| oracle.database_audit.session_id | Indicates the audit session ID number. | keyword |
| oracle.database_audit.statement | The statement ID related to the audit event. | keyword |
| oracle.database_audit.status | Database Audit Status. | keyword |
| oracle.database_audit.terminal | The terminal identifier. | keyword |
Example
{
    "@timestamp": "2020-10-07T14:57:51.000Z",
    "agent": {
        "ephemeral_id": "c8ada4ef-14e4-462f-b998-dd8c711b4ec7",
        "id": "50560b92-4232-4158-b79d-9e6be7098c58",
        "name": "docker-fleet-agent",
        "type": "filebeat",
        "version": "8.10.2"
    },
    "client": {
        "user": {
            "name": "oracle"
        }
    },
    "data_stream": {
        "dataset": "oracle.database_audit",
        "namespace": "ep",
        "type": "logs"
    },
    "ecs": {
        "version": "8.11.0"
    },
    "elastic_agent": {
        "id": "50560b92-4232-4158-b79d-9e6be7098c58",
        "snapshot": false,
        "version": "8.10.2"
    },
    "event": {
        "action": "database_audit",
        "agent_id_status": "verified",
        "category": [
            "database"
        ],
        "dataset": "oracle.database_audit",
        "ingested": "2023-10-05T12:18:05Z",
        "kind": "event",
        "outcome": "success",
        "timezone": "-04:00",
        "type": [
            "access"
        ]
    },
    "host": {
        "architecture": "x86_64",
        "containerized": true,
        "hostname": "docker-fleet-agent",
        "id": "efe661d97f0c4d9883075c393da6b0d8",
        "ip": [
            "172.28.0.7"
        ],
        "mac": [
            "02-42-AC-1C-00-07"
        ],
        "name": "docker-fleet-agent",
        "os": {
            "codename": "focal",
            "family": "debian",
            "kernel": "5.15.90.1-microsoft-standard-WSL2",
            "name": "Ubuntu",
            "platform": "ubuntu",
            "type": "linux",
            "version": "20.04.6 LTS (Focal Fossa)"
        }
    },
    "input": {
        "type": "filestream"
    },
    "log": {
        "file": {
            "device_id": 2080,
            "inode": 827222,
            "path": "/tmp/service_logs/ORCLCDB_ora_13765_20201007105751904399925443.aud.log"
        },
        "flags": [
            "multiline"
        ],
        "offset": 858
    },
    "oracle": {
        "database_audit": {
            "action": "CONNECT",
            "action_number": "100",
            "client": {
                "terminal": "pts/0"
            },
            "length": 253,
            "session_id": "4294967295",
            "status": "0"
        }
    },
    "process": {
        "pid": 13765
    },
    "related": {
        "hosts": [
            "testlab.local"
        ],
        "user": [
            "/",
            "oracle"
        ]
    },
    "server": {
        "address": "testlab.local",
        "domain": "testlab.local",
        "user": {
            "name": "/"
        }
    },
    "tags": [
        "oracle-database_audit"
    ],
    "user": {
        "roles": [
            "SYSDBA"
        ]
    }
}
Tablespace metrics describes the tablespace usage metrics of all types of tablespaces in the oracle database.
Tablespace metrics also describes extended space of all type of tablepaces.
To collect the Tablespace metrics, Oracle integration relies on a specific set of views. Make sure that the user configured within the Oracle DSN configuration has READ access permissions to the following views:
SYS.DBA_DATA_FILESSYS.DBA_TEMP_FILESDBA_FREE_SPACEDBA_TABLESPACE_USAGE_METRICSDBA_TABLESPACESDBA_TEMP_FREE_SPACE
ECS Field Reference
Refer to the following document for detailed information on ECS fields.
Exported fields
| Field | Description | Type | Unit | Metric Type |
|---|---|---|---|---|
| @timestamp | Event timestamp. | date | ||
| agent.id | Unique identifier of this agent (if one exists). Example: For Beats this would be beat.id. | keyword | ||
| cloud.account.id | The cloud account or organization id used to identify different entities in a multi-tenant environment. Examples: AWS account id, Google Cloud ORG Id, or other unique identifier. | keyword | ||
| cloud.availability_zone | Availability zone in which this host, resource, or service is located. | keyword | ||
| cloud.instance.id | Instance ID of the host machine. | keyword | ||
| cloud.provider | Name of the cloud provider. Example values are aws, azure, gcp, or digitalocean. | keyword | ||
| cloud.region | Region in which this host, resource, or service is located. | keyword | ||
| container.id | Unique container id. | keyword | ||
| data_stream.dataset | Data stream dataset. | constant_keyword | ||
| data_stream.namespace | Data stream namespace. | constant_keyword | ||
| data_stream.type | Data stream type. | constant_keyword | ||
| event.dataset | Event module | constant_keyword | ||
| event.module | Event module | constant_keyword | ||
| host.name | Name of the host. It can contain what hostname returns on Unix systems, the fully qualified domain name (FQDN), or a name specified by the user. The recommended value is the lowercase FQDN of the host. | keyword | ||
| oracle.tablespace.data_file.id | Tablespace unique identifier. | long | ||
| oracle.tablespace.data_file.name | Filename of the data file | keyword | ||
| oracle.tablespace.data_file.online_status | Last known online status of the data file. One of SYSOFF, SYSTEM, OFFLINE, ONLINE or RECOVER. | keyword | ||
| oracle.tablespace.data_file.size.bytes | Size of the file in bytes | long | byte | gauge |
| oracle.tablespace.data_file.size.free.bytes | The size of the file available for user data. The actual size of the file minus this value is used to store file related metadata. | long | byte | gauge |
| oracle.tablespace.data_file.size.max.bytes | Maximum file size in bytes | long | byte | gauge |
| oracle.tablespace.data_file.status | File status: AVAILABLE or INVALID (INVALID means that the file number is not in use, for example, a file in a tablespace that was dropped) | keyword | ||
| oracle.tablespace.extended_space.free.bytes | The total extended free tablespace. | long | byte | gauge |
| oracle.tablespace.extended_space.total.bytes | The total extended tablespace. | long | byte | gauge |
| oracle.tablespace.extended_space.used.bytes | The total extended used tablespace. | long | byte | gauge |
| oracle.tablespace.name | Tablespace name | keyword | ||
| oracle.tablespace.query_id | Autogenerated ID representing the Oracle query that is executed to fetch the results. | keyword | ||
| oracle.tablespace.space.free.bytes | Tablespace total free space available, in bytes. | long | byte | gauge |
| oracle.tablespace.space.total.bytes | Tablespace total size, in bytes. | long | byte | gauge |
| oracle.tablespace.space.used.bytes | Tablespace used space, in bytes. | long | byte | gauge |
| service.address | Address where data about this service was collected from. This should be a URI, network address (ipv4:port or [ipv6]:port) or a resource path (sockets). | keyword |
Example
{
    "@timestamp": "2024-07-16T06:22:19.048Z",
    "agent": {
        "ephemeral_id": "08f5dbe3-f515-4c7f-ab2c-711c048f294a",
        "id": "08b0c5bb-472a-42be-9e47-d06e205296b9",
        "name": "docker-custom-agent",
        "type": "metricbeat",
        "version": "8.13.0"
    },
    "data_stream": {
        "dataset": "oracle.tablespace",
        "namespace": "69805",
        "type": "metrics"
    },
    "ecs": {
        "version": "8.0.0"
    },
    "elastic_agent": {
        "id": "08b0c5bb-472a-42be-9e47-d06e205296b9",
        "snapshot": false,
        "version": "8.13.0"
    },
    "event": {
        "agent_id_status": "verified",
        "dataset": "oracle.tablespace",
        "duration": 1980031830,
        "ingested": "2024-07-16T06:22:31Z",
        "module": "sql"
    },
    "host": {
        "architecture": "x86_64",
        "containerized": true,
        "hostname": "docker-custom-agent",
        "id": "8259e024976a406e8a54cdbffeb84fec",
        "ip": [
            "192.168.253.5",
            "192.168.254.3"
        ],
        "mac": [
            "02-42-C0-A8-FD-05",
            "02-42-C0-A8-FE-03"
        ],
        "name": "docker-custom-agent",
        "os": {
            "codename": "focal",
            "family": "debian",
            "kernel": "4.18.0-348.7.1.el8_5.x86_64",
            "name": "Ubuntu",
            "platform": "ubuntu",
            "type": "linux",
            "version": "20.04.6 LTS (Focal Fossa)"
        }
    },
    "metricset": {
        "name": "query",
        "period": 60000
    },
    "oracle": {
        "tablespace": {
            "extended_space": {
                "free": {
                    "bytes": 32566738944
                },
                "total": {
                    "bytes": 32567787520
                }
            },
            "name": "USERS",
            "query_id": "0hxB8g4C+JnF8EuTG/7JQRJZ1oE="
        }
    },
    "service": {
        "address": "oracle:1521/ORCLCDB.localdomain",
        "type": "sql"
    }
}
The system metrics value captured for the most current time interval for the long duration (60-seconds) are listed in the following table.
To collect the Sysmetrics metrics, Oracle integration relies on a specific set of views. Make sure that the user configured within the Oracle DSN configuration has READ access permissions to the following view:
V$SYSMETRIC
ECS Field Reference
Refer to the following document for detailed information on ECS fields.
Exported fields
| Field | Description | Type | Unit | Metric Type |
|---|---|---|---|---|
| @timestamp | Date/time when the event originated. This is the date/time extracted from the event, typically representing when the event was generated by the source. If the event source has no original timestamp, this value is typically populated by the first time the event was received by the pipeline. Required field for all events. | date | ||
| agent.id | Unique identifier of this agent (if one exists). Example: For Beats this would be beat.id. | keyword | ||
| cloud.account.id | The cloud account or organization id used to identify different entities in a multi-tenant environment. Examples: AWS account id, Google Cloud ORG Id, or other unique identifier. | keyword | ||
| cloud.availability_zone | Availability zone in which this host, resource, or service is located. | keyword | ||
| cloud.project.id | The cloud project identifier. Examples: Google Cloud Project id, Azure Project id. | keyword | ||
| cloud.provider | Name of the cloud provider. Example values are aws, azure, gcp, or digitalocean. | keyword | ||
| cloud.region | Region in which this host, resource, or service is located. | keyword | ||
| container.id | Unique container id. | keyword | ||
| data_stream.dataset | The field can contain anything that makes sense to signify the source of the data. Examples include nginx.access, prometheus, endpoint etc. For data streams that otherwise fit, but that do not have dataset set we use the value "generic" for the dataset value. event.dataset should have the same value as data_stream.dataset. Beyond the Elasticsearch data stream naming criteria noted above, the dataset value has additional restrictions: * Must not contain - * No longer than 100 characters |
constant_keyword | ||
| data_stream.namespace | A user defined namespace. Namespaces are useful to allow grouping of data. Many users already organize their indices this way, and the data stream naming scheme now provides this best practice as a default. Many users will populate this field with default. If no value is used, it falls back to default. Beyond the Elasticsearch index naming criteria noted above, namespace value has the additional restrictions: * Must not contain - * No longer than 100 characters |
constant_keyword | ||
| data_stream.type | An overarching type for the data stream. Currently allowed values are "logs" and "metrics". We expect to also add "traces" and "synthetics" in the near future. | constant_keyword | ||
| event.dataset | Event module | constant_keyword | ||
| event.module | Event module | constant_keyword | ||
| host.name | Name of the host. It can contain what hostname returns on Unix systems, the fully qualified domain name (FQDN), or a name specified by the user. The recommended value is the lowercase FQDN of the host. | keyword | ||
| oracle.sysmetric.active_parallel_sessions | Active parallel sessions | double | gauge | |
| oracle.sysmetric.active_serial_sessions | Active serial sessions. | double | gauge | |
| oracle.sysmetric.average_active_sessions | Average active sessions. | double | gauge | |
| oracle.sysmetric.average_synchronous_single-block_read_latency | Average synchronous single-block read latency. | double | gauge | |
| oracle.sysmetric.background_checkpoints_per_sec | Background checkpoints per second. | double | gauge | |
| oracle.sysmetric.background_cpu_usage_per_sec | Background CPU usage per sec | double | gauge | |
| oracle.sysmetric.background_time_per_sec | Background time per second. | double | gauge | |
| oracle.sysmetric.branch_node_splits_per_sec | Branch node splits per second. | double | gauge | |
| oracle.sysmetric.branch_node_splits_per_txn | Branch node splits per transaction. | double | gauge | |
| oracle.sysmetric.buffer_cache_hit_ratio | Buffer cache hit ratio | double | gauge | |
| oracle.sysmetric.captured_user_calls | Captured user calls. | double | gauge | |
| oracle.sysmetric.cell_physical_io_interconnect_bytes | Cell physical io interconnect bytes. | double | gauge | |
| oracle.sysmetric.consistent_read_changes_per_sec | Consistent read changes per second. | double | gauge | |
| oracle.sysmetric.consistent_read_changes_per_txn | Consistent read changes per transaction. | double | gauge | |
| oracle.sysmetric.consistent_read_gets_per_sec | Consistent read gets per second. | double | gauge | |
| oracle.sysmetric.consistent_read_gets_per_txn | Consistent read gets per transaction. | double | gauge | |
| oracle.sysmetric.cpu_usage_per_sec | CPU usage per second. | double | gauge | |
| oracle.sysmetric.cpu_usage_per_txn | CPU usage per transaction. | double | gauge | |
| oracle.sysmetric.cr_blocks_created_per_sec | Cr blocks created per second. | double | gauge | |
| oracle.sysmetric.cr_blocks_created_per_txn | Cr blocks created per transaction. | double | gauge | |
| oracle.sysmetric.cr_undo_records_applied_per_sec | Cr undo records applied per second. | double | gauge | |
| oracle.sysmetric.cr_undo_records_applied_per_txn | Cr undo records applied per transaction. | double | gauge | |
| oracle.sysmetric.current_logons_count | Current logons count. | double | gauge | |
| oracle.sysmetric.current_open_cursors_count | Current open cursors count | double | gauge | |
| oracle.sysmetric.current_os_load | Current os load | double | gauge | |
| oracle.sysmetric.cursor_cache_hit_ratio | Cursor cache hit ratio. | double | gauge | |
| oracle.sysmetric.database_cpu_time_ratio | Database CPU time ratio | double | gauge | |
| oracle.sysmetric.database_time_per_sec | Database time per second. | double | gauge | |
| oracle.sysmetric.database_wait_time_ratio | Database wait time ratio. | double | gauge | |
| oracle.sysmetric.db_block_changes_per_sec | Db block changes per second. | double | gauge | |
| oracle.sysmetric.db_block_changes_per_txn | Db block changes per transaction. | double | gauge | |
| oracle.sysmetric.db_block_changes_per_user_call | Db block changes per user call. | double | gauge | |
| oracle.sysmetric.db_block_gets_per_sec | Db block gets per sec | double | gauge | |
| oracle.sysmetric.db_block_gets_per_txn | Db block gets per transaction | double | gauge | |
| oracle.sysmetric.db_block_gets_per_user_call | Db block gets per user call. | double | gauge | |
| oracle.sysmetric.dbwr_checkpoints_per_sec | Dbwr checkpoints per sec. | double | gauge | |
| oracle.sysmetric.ddl_statements_parallelized_per_sec | Ddl statements parallelized per sec | double | gauge | |
| oracle.sysmetric.disk_sort_per_sec | Disk sort per second. | double | gauge | |
| oracle.sysmetric.disk_sort_per_txn | Disk sort per transaction. | double | gauge | |
| oracle.sysmetric.dml_statements_parallelized_per_sec | Dml statements parallelized per sec | double | gauge | |
| oracle.sysmetric.enqueue_deadlocks_per_sec | Enqueue deadlocks per sec | double | gauge | |
| oracle.sysmetric.enqueue_deadlocks_per_txn | Enqueue deadlocks per transaction. | double | gauge | |
| oracle.sysmetric.enqueue_requests_per_sec | Enqueue requests per second. | double | gauge | |
| oracle.sysmetric.enqueue_requests_per_txn | Enqueue requests per transaction | double | gauge | |
| oracle.sysmetric.enqueue_timeouts_per_sec | Enqueue timeouts per second. | double | gauge | |
| oracle.sysmetric.enqueue_timeouts_per_txn | Enqueue timeouts per transaction. | double | gauge | |
| oracle.sysmetric.enqueue_waits_per_sec | Enqueue waits per second. | double | gauge | |
| oracle.sysmetric.enqueue_waits_per_txn | Enqueue waits per transaction. | double | gauge | |
| oracle.sysmetric.execute_without_parse_ratio | Execute without parse ratio | double | gauge | |
| oracle.sysmetric.executions_per_sec | Executions per second. | double | gauge | |
| oracle.sysmetric.executions_per_txn | Executions per transaction. | double | gauge | |
| oracle.sysmetric.executions_per_user_call | Executions per user call | double | gauge | |
| oracle.sysmetric.full_index_scans_per_sec | Full index scans per second. | double | gauge | |
| oracle.sysmetric.full_index_scans_per_txn | Full index scans per transaction. | double | gauge | |
| oracle.sysmetric.gc_cr_block_received_per_second | Gc cr block received per second. | double | gauge | |
| oracle.sysmetric.gc_cr_block_received_per_txn | Gc cr block received per transaction. | double | gauge | |
| oracle.sysmetric.gc_current_block_received_per_second | Gc current block received per second. | double | gauge | |
| oracle.sysmetric.gc_current_block_received_per_txn | Gc current block received per transaction | double | gauge | |
| oracle.sysmetric.global_cache_average_cr_get_time | Global cache average cr get time. | double | gauge | |
| oracle.sysmetric.global_cache_average_current_get_time | Global cache average current get time | double | gauge | |
| oracle.sysmetric.global_cache_blocks_corrupted | Global cache blocks corrupted. | double | gauge | |
| oracle.sysmetric.global_cache_blocks_lost | Global cache blocks lost. | double | gauge | |
| oracle.sysmetric.hard_parse_count_per_sec | Hard parse count per sec | double | gauge | |
| oracle.sysmetric.hard_parse_count_per_txn | Hard parse count per transaction. | double | gauge | |
| oracle.sysmetric.host_cpu_usage_per_sec | Host CPU usage per sec. | double | gauge | |
| oracle.sysmetric.host_cpu_utilization_pct | Host CPU utilization percentage. | double | percent | gauge |
| oracle.sysmetric.io_megabytes_per_second | IO megabytes per second | double | gauge | |
| oracle.sysmetric.io_requests_per_second | IO requests per second | double | gauge | |
| oracle.sysmetric.leaf_node_splits_per_sec | Leaf node splits per second. | double | gauge | |
| oracle.sysmetric.leaf_node_splits_per_txn | Leaf node splits per transaction. | double | gauge | |
| oracle.sysmetric.library_cache_hit_ratio | Library cache hit ratio. | double | gauge | |
| oracle.sysmetric.library_cache_miss_ratio | Library cache miss ratio. | double | gauge | |
| oracle.sysmetric.logical_reads_per_sec | Logical reads per sec. | double | gauge | |
| oracle.sysmetric.logical_reads_per_txn | Logical reads per transaction. | double | gauge | |
| oracle.sysmetric.logical_reads_per_user_call | Logical reads per user call. | double | gauge | |
| oracle.sysmetric.logons_per_sec | Logons per sec | double | gauge | |
| oracle.sysmetric.logons_per_txn | Logons per transaction. | double | gauge | |
| oracle.sysmetric.long_table_scans_per_sec | Long table scans per second. | double | gauge | |
| oracle.sysmetric.long_table_scans_per_txn | Long table scans per transaction. | double | gauge | |
| oracle.sysmetric.memory_sorts_ratio | Memory sorts ratio. | double | gauge | |
| oracle.sysmetric.network_traffic_volume_per_sec | Network traffic volume per second. | double | gauge | |
| oracle.sysmetric.open_cursors_per_sec | Open cursors per sec | double | gauge | |
| oracle.sysmetric.open_cursors_per_txn | Open cursors per transaction | double | gauge | |
| oracle.sysmetric.parse_failure_count_per_sec | Parse failure count per sec | double | gauge | |
| oracle.sysmetric.parse_failure_count_per_txn | Parse failure count per transaction. | double | gauge | |
| oracle.sysmetric.pga_cache_hit_pct | Pga cache hit percentage. | double | percent | gauge |
| oracle.sysmetric.physical_read_bytes_per_sec | Physical read bytes per second. | double | gauge | |
| oracle.sysmetric.physical_read_io_requests_per_sec | Physical read io requests per second. | double | gauge | |
| oracle.sysmetric.physical_read_total_bytes_per_sec | Physical read total bytes per second. | double | gauge | |
| oracle.sysmetric.physical_read_total_io_requests_per_sec | Physical read total io requests per sec | double | gauge | |
| oracle.sysmetric.physical_reads_direct_lobs_per_sec | Physical reads direct lobs per second. | double | gauge | |
| oracle.sysmetric.physical_reads_direct_lobs_per_txn | Physical reads direct lobs per transaction. | double | gauge | |
| oracle.sysmetric.physical_reads_direct_per_sec | Physical reads direct per second. | double | gauge | |
| oracle.sysmetric.physical_reads_direct_per_txn | Physical reads direct per transaction. | double | gauge | |
| oracle.sysmetric.physical_reads_per_sec | Physical reads per second. | double | gauge | |
| oracle.sysmetric.physical_reads_per_txn | Physical reads per transaction. | double | gauge | |
| oracle.sysmetric.physical_write_bytes_per_sec | Physical write bytes per second. | double | gauge | |
| oracle.sysmetric.physical_write_io_requests_per_sec | Physical write io requests per second. | double | gauge | |
| oracle.sysmetric.physical_write_total_bytes_per_sec | Physical write total bytes per second. | double | gauge | |
| oracle.sysmetric.physical_write_total_io_requests_per_sec | Physical write total io requests per second. | double | gauge | |
| oracle.sysmetric.physical_writes_direct_lobs__per_txn | Physical writes direct lobs per transaction | double | gauge | |
| oracle.sysmetric.physical_writes_direct_lobs_per_sec | Physical writes direct lobs per sec | double | gauge | |
| oracle.sysmetric.physical_writes_direct_per_sec | Physical writes direct per second. | double | gauge | |
| oracle.sysmetric.physical_writes_direct_per_txn | Physical writes direct per transaction. | double | gauge | |
| oracle.sysmetric.physical_writes_per_sec | Physical writes per second. | double | gauge | |
| oracle.sysmetric.physical_writes_per_txn | Physical writes per transaction. | double | gauge | |
| oracle.sysmetric.pq_qc_session_count | Pq qc session count. | double | gauge | |
| oracle.sysmetric.pq_slave_session_count | Pq slave session count. | double | gauge | |
| oracle.sysmetric.process_limit_pct | Process limit percentage. | double | percent | gauge |
| oracle.sysmetric.px_downgraded_1_to_25pct_per_sec | Px downgraded 1 to 25 percentage per second. | double | percent | gauge |
| oracle.sysmetric.px_downgraded_25_to_50pct_per_sec | Px downgraded 25 to 50 percentage per sec | double | percent | gauge |
| oracle.sysmetric.px_downgraded_50_to_75pct_per_sec | Px downgraded 50 to 75 percentage per second. | double | percent | gauge |
| oracle.sysmetric.px_downgraded_75_to_99pct_per_sec | Px downgraded 75 to 99 percentage per second. | double | percent | gauge |
| oracle.sysmetric.px_downgraded_to_serial_per_sec | Px downgraded to serial per sec. | double | gauge | |
| oracle.sysmetric.px_operations_not_downgraded_per_sec | Px operations not downgraded per second. | double | gauge | |
| oracle.sysmetric.queries_parallelized_per_sec | Queries parallelized per second. | double | gauge | |
| oracle.sysmetric.recursive_calls_per_sec | Recursive calls per second. | double | gauge | |
| oracle.sysmetric.recursive_calls_per_txn | Recursive calls per transaction. | double | gauge | |
| oracle.sysmetric.redo_allocation_hit_ratio | Redo allocation hit ratio. | double | gauge | |
| oracle.sysmetric.redo_generated_per_sec | Redo generated per second. | double | gauge | |
| oracle.sysmetric.redo_generated_per_txn | Redo generated per transaction | double | gauge | |
| oracle.sysmetric.redo_writes_per_sec | Redo writes per second. | double | gauge | |
| oracle.sysmetric.redo_writes_per_txn | Redo writes per transaction. | double | gauge | |
| oracle.sysmetric.replayed_user_calls | Replayed user calls | double | gauge | |
| oracle.sysmetric.response_time_per_txn | Response time per transaction. | double | gauge | |
| oracle.sysmetric.row_cache_hit_ratio | Row cache hit ratio. | double | gauge | |
| oracle.sysmetric.row_cache_miss_ratio | Row cache miss ratio. | double | gauge | |
| oracle.sysmetric.rows_per_sort | Rows per sort. | double | gauge | |
| oracle.sysmetric.run_queue_per_sec | Run queue per second. | double | gauge | |
| oracle.sysmetric.session_count | Session count. | double | gauge | |
| oracle.sysmetric.session_limit_pct | "Session limit percentage." | double | percent | gauge |
| oracle.sysmetric.shared_pool_free_pct | Shared pool free percentage. | double | percent | gauge |
| oracle.sysmetric.soft_parse_ratio | Soft parse ratio. | double | gauge | |
| oracle.sysmetric.sql_service_response_time | Sql service response time | double | gauge | |
| oracle.sysmetric.streams_pool_usage_percentage | Streams pool usage percentage. | double | gauge | |
| oracle.sysmetric.temp_space_used | Temp space used | double | gauge | |
| oracle.sysmetric.total_index_scans_per_sec | Total index scans per second. | double | gauge | |
| oracle.sysmetric.total_index_scans_per_txn | Total index scans per transaction. | double | gauge | |
| oracle.sysmetric.total_parse_count_per_sec | Total parse count per sec | double | gauge | |
| oracle.sysmetric.total_parse_count_per_txn | Total parse count per transaction. | double | gauge | |
| oracle.sysmetric.total_pga_allocated | Total pga allocated. | double | gauge | |
| oracle.sysmetric.total_pga_used_by_sql_workareas | Total pga used by sql workareas | double | gauge | |
| oracle.sysmetric.total_sorts_per_user_call | Total sorts per user call. | double | gauge | |
| oracle.sysmetric.total_table_scans_per_sec | Total table scans per second. | double | gauge | |
| oracle.sysmetric.total_table_scans_per_txn | Total table scans per transaction. | double | gauge | |
| oracle.sysmetric.total_table_scans_per_user_call | Total table scans per user call. | double | gauge | |
| oracle.sysmetric.txns_per_logon | transactions per logon. | double | gauge | |
| oracle.sysmetric.user_calls_per_sec | User calls per second. | double | gauge | |
| oracle.sysmetric.user_calls_per_txn | User calls per transaction | double | gauge | |
| oracle.sysmetric.user_calls_ratio | User calls ratio | double | gauge | |
| oracle.sysmetric.user_commits_per_sec | User commits per sec | double | gauge | |
| oracle.sysmetric.user_commits_percentage | User commits percentage. | double | gauge | |
| oracle.sysmetric.user_limit_pct | User limit percentage. | double | percent | gauge |
| oracle.sysmetric.user_rollback_undo_records_applied_per_txn | User rollback undo records applied per transaction. | double | gauge | |
| oracle.sysmetric.user_rollback_undorec_applied_per_sec | User rollback undorec applied per second. | double | gauge | |
| oracle.sysmetric.user_rollbacks_per_sec | User rollbacks per second. | double | gauge | |
| oracle.sysmetric.user_rollbacks_percentage | User rollbacks percentage. | double | gauge | |
| oracle.sysmetric.user_transaction_per_sec | User transaction per second. | double | gauge | |
| oracle.sysmetric.vm_in_bytes_per_sec | Vm in bytes per sec | double | gauge | |
| oracle.sysmetric.vm_out_bytes_per_sec | Vm out bytes per second. | double | gauge | |
| oracle.sysmetric.workload_capture_and_replay_status | Workload capture and replay status. | double | gauge | |
| service.address | Address where data about this service was collected from. This should be a URI, network address (ipv4:port or [ipv6]:port) or a resource path (sockets). | keyword |
Example
{
    "@timestamp": "2022-11-09T04:28:12.009Z",
    "agent": {
        "ephemeral_id": "4d613e69-65ae-4c3a-9f60-8b600554574c",
        "id": "f4169ed3-d5c6-4775-bcad-5f4c0cca8a9f",
        "name": "docker-custom-agent",
        "type": "metricbeat",
        "version": "8.4.3"
    },
    "cloud": {
        "account": {
            "id": "elastic-obs-integrations-dev"
        },
        "availability_zone": "asia-south1-c",
        "instance": {
            "id": "3010911784348669868",
            "name": "service-integration-dev-idc-01"
        },
        "machine": {
            "type": "n1-standard-8"
        },
        "project": {
            "id": "elastic-obs-integrations-dev"
        },
        "provider": "gcp",
        "service": {
            "name": "GCE"
        }
    },
    "data_stream": {
        "dataset": "oracle.sysmetric",
        "namespace": "ep",
        "type": "metrics"
    },
    "ecs": {
        "version": "8.11.0"
    },
    "elastic_agent": {
        "id": "f4169ed3-d5c6-4775-bcad-5f4c0cca8a9f",
        "snapshot": false,
        "version": "8.4.3"
    },
    "event": {
        "agent_id_status": "verified",
        "dataset": "oracle.sysmetric",
        "duration": 81013699,
        "ingested": "2022-11-09T04:28:12Z",
        "module": "sql"
    },
    "host": {
        "architecture": "x86_64",
        "containerized": true,
        "hostname": "docker-custom-agent",
        "id": "702b305d5bf3433b8efe81033888bd28",
        "ip": [
            "172.27.0.3",
            "192.168.240.4"
        ],
        "mac": [
            "02-42-AC-1F-00-07"
        ],
        "name": "docker-custom-agent",
        "os": {
            "codename": "focal",
            "family": "debian",
            "kernel": "5.4.0-1078-gcp",
            "name": "Ubuntu",
            "platform": "ubuntu",
            "type": "linux",
            "version": "20.04.5 LTS (Focal Fossa)"
        }
    },
    "metricset": {
        "name": "query",
        "period": 60000
    },
    "oracle": {
        "sysmetric": {
            "active_parallel_sessions": 0,
            "active_serial_sessions": 1,
            "average_active_sessions": 1.3158911021814,
            "average_synchronous_single-block_read_latency": 2.48382983655964,
            "background_checkpoints_per_sec": 0,
            "background_cpu_usage_per_sec": 5.41525258323766,
            "background_time_per_sec": 0.349192881745121,
            "branch_node_splits_per_sec": 0,
            "branch_node_splits_per_txn": 0,
            "buffer_cache_hit_ratio": 95.3592643642205,
            "captured_user_calls": 0,
            "cell_physical_io_interconnect_bytes": 2304267631,
            "consistent_read_changes_per_sec": 221.622655951014,
            "consistent_read_changes_per_txn": 214.481481481481,
            "consistent_read_gets_per_sec": 5360.58170685036,
            "consistent_read_gets_per_txn": 5187.85185185185,
            "cpu_usage_per_sec": 19.6512265595101,
            "cpu_usage_per_txn": 19.0180203703704,
            "cr_blocks_created_per_sec": 4.07577497129736,
            "cr_blocks_created_per_txn": 3.94444444444444,
            "cr_undo_records_applied_per_sec": 219.077688480674,
            "cr_undo_records_applied_per_txn": 212.018518518519,
            "current_logons_count": 58,
            "current_open_cursors_count": 23,
            "current_os_load": 2.939453125,
            "cursor_cache_hit_ratio": 290.424008021773,
            "database_cpu_time_ratio": 14.9337787351351,
            "database_time_per_sec": 131.58911021814,
            "database_wait_time_ratio": 85.0662212648649,
            "db_block_changes_per_sec": 631.094527363184,
            "db_block_changes_per_txn": 610.759259259259,
            "db_block_changes_per_user_call": 85.0025773195876,
            "db_block_gets_per_sec": 511.844623038653,
            "db_block_gets_per_txn": 495.351851851852,
            "db_block_gets_per_user_call": 68.9407216494845,
            "dbwr_checkpoints_per_sec": 0.0574052812858783,
            "ddl_statements_parallelized_per_sec": 0,
            "disk_sort_per_sec": 0,
            "disk_sort_per_txn": 0,
            "dml_statements_parallelized_per_sec": 0,
            "enqueue_deadlocks_per_sec": 0,
            "enqueue_deadlocks_per_txn": 0,
            "enqueue_requests_per_sec": 343.073096058171,
            "enqueue_requests_per_txn": 332.018518518519,
            "enqueue_timeouts_per_sec": 0.0765403750478377,
            "enqueue_timeouts_per_txn": 0.0740740740740741,
            "enqueue_waits_per_sec": 0.68886337543054,
            "enqueue_waits_per_txn": 0.666666666666667,
            "execute_without_parse_ratio": 57.5272325686462,
            "executions_per_sec": 762.380405663988,
            "executions_per_txn": 737.814814814815,
            "executions_per_user_call": 102.685567010309,
            "full_index_scans_per_sec": 13.4711060084194,
            "full_index_scans_per_txn": 13.037037037037,
            "gc_cr_block_received_per_second": 0,
            "gc_cr_block_received_per_txn": 0,
            "gc_current_block_received_per_second": 0,
            "gc_current_block_received_per_txn": 0,
            "global_cache_average_cr_get_time": 0,
            "global_cache_average_current_get_time": 0,
            "global_cache_blocks_corrupted": 0,
            "global_cache_blocks_lost": 0,
            "hard_parse_count_per_sec": 56.6398775353999,
            "hard_parse_count_per_txn": 54.8148148148148,
            "host_cpu_usage_per_sec": 118.637581324148,
            "host_cpu_utilization_pct": 14.8453213293746,
            "io_megabytes_per_second": 42.0398009950249,
            "io_requests_per_second": 209.395331037122,
            "leaf_node_splits_per_sec": 0.0765403750478377,
            "leaf_node_splits_per_txn": 0.0740740740740741,
            "library_cache_hit_ratio": 85.9758358371156,
            "library_cache_miss_ratio": 14.0241641628844,
            "logical_reads_per_sec": 5872.42632988902,
            "logical_reads_per_txn": 5683.2037037037,
            "logical_reads_per_user_call": 790.961340206186,
            "logons_per_sec": 2.39188672024493,
            "logons_per_txn": 2.31481481481481,
            "long_table_scans_per_sec": 0,
            "long_table_scans_per_txn": 0,
            "memory_sorts_ratio": 100,
            "network_traffic_volume_per_sec": 258.036739380023,
            "open_cursors_per_sec": 662.456946039036,
            "open_cursors_per_txn": 641.111111111111,
            "parse_failure_count_per_sec": 0.516647531572905,
            "parse_failure_count_per_txn": 0.5,
            "pga_cache_hit_pct": 100,
            "physical_read_bytes_per_sec": 2234538.07883659,
            "physical_read_io_requests_per_sec": 154.994259471871,
            "physical_read_total_bytes_per_sec": 23205621.1251435,
            "physical_read_total_io_requests_per_sec": 196.19211634137,
            "physical_reads_direct_lobs_per_sec": 0.0191350937619594,
            "physical_reads_direct_lobs_per_txn": 0.0185185185185185,
            "physical_reads_direct_per_sec": 0.248756218905473,
            "physical_reads_direct_per_txn": 0.240740740740741,
            "physical_reads_per_sec": 272.770761576732,
            "physical_reads_per_txn": 263.981481481481,
            "physical_write_bytes_per_sec": 3918.86720244929,
            "physical_write_io_requests_per_sec": 0.478377344048986,
            "physical_write_total_bytes_per_sec": 20886756.0466896,
            "physical_write_total_io_requests_per_sec": 34.7110600841944,
            "physical_writes_direct_lobs__per_txn": 0.0185185185185185,
            "physical_writes_direct_lobs_per_sec": 0.0191350937619594,
            "physical_writes_direct_per_sec": 0.191350937619594,
            "physical_writes_direct_per_txn": 0.185185185185185,
            "physical_writes_per_sec": 0.478377344048986,
            "physical_writes_per_txn": 0.462962962962963,
            "pq_qc_session_count": 0,
            "pq_slave_session_count": 0,
            "process_limit_pct": 32,
            "px_downgraded_1_to_25pct_per_sec": 0,
            "px_downgraded_25_to_50pct_per_sec": 0,
            "px_downgraded_50_to_75pct_per_sec": 0,
            "px_downgraded_75_to_99pct_per_sec": 0,
            "px_downgraded_to_serial_per_sec": 0,
            "px_operations_not_downgraded_per_sec": 0.114810562571757,
            "queries_parallelized_per_sec": 0.0382701875239189,
            "recursive_calls_per_sec": 3231.72598545733,
            "recursive_calls_per_txn": 3127.59259259259,
            "redo_allocation_hit_ratio": 99.9710060887214,
            "redo_generated_per_sec": 89624.2632988902,
            "redo_generated_per_txn": 86736.3703703704,
            "redo_writes_per_sec": 6.29544584768465,
            "redo_writes_per_txn": 6.09259259259259,
            "replayed_user_calls": 0,
            "response_time_per_txn": 127.349016666667,
            "row_cache_hit_ratio": 92.9547727525281,
            "row_cache_miss_ratio": 7.04522724747194,
            "rows_per_sort": 16.1167552157574,
            "run_queue_per_sec": 0,
            "session_count": 69,
            "session_limit_pct": 14.6186440677966,
            "shared_pool_free_pct": 15.3352475166321,
            "soft_parse_ratio": 82.5079777804042,
            "sql_service_response_time": 0.0406245755502782,
            "streams_pool_usage_percentage": 0,
            "temp_space_used": 0,
            "total_index_scans_per_sec": 732.548794489093,
            "total_index_scans_per_txn": 708.944444444445,
            "total_parse_count_per_sec": 323.804056639878,
            "total_parse_count_per_txn": 313.37037037037,
            "total_pga_allocated": 295197696,
            "total_pga_used_by_sql_workareas": 0,
            "total_sorts_per_user_call": 19.889175257732,
            "total_table_scans_per_sec": 42.7860696517413,
            "total_table_scans_per_txn": 41.4074074074074,
            "total_table_scans_per_user_call": 5.76288659793814,
            "txns_per_logon": 0.432,
            "user_calls_per_sec": 7.42441637964026,
            "user_calls_per_txn": 7.18518518518519,
            "user_calls_ratio": 0.229208757192311,
            "user_commits_per_sec": 1.01415996938385,
            "user_commits_percentage": 98.1481481481482,
            "user_limit_pct": 0.00000135041773350686,
            "user_rollback_undo_records_applied_per_txn": 25.7777777777778,
            "user_rollback_undorec_applied_per_sec": 26.6360505166475,
            "user_rollbacks_per_sec": 0.0191350937619594,
            "user_rollbacks_percentage": 1.85185185185185,
            "user_transaction_per_sec": 1.03329506314581,
            "vm_in_bytes_per_sec": 0,
            "vm_out_bytes_per_sec": 0,
            "workload_capture_and_replay_status": 0
        }
    },
    "service": {
        "address": "oracle:1521",
        "type": "sql"
    }
}
A Program Global Area (PGA) is a memory region that contains data and control information for a server process. It is nonshared memory created by Oracle Database when a server process is started. Access to the PGA is exclusive to the server process. Metrics concerning Program Global Area (PGA) memory are mentioned below.
To collect the Memory metrics, Oracle integration relies on a specific set of views. Make sure that the user configured within the Oracle DSN configuration has READ access permissions to the following views:
V$SGASTATV$PGASTAT
ECS Field Reference
Refer to the following document for detailed information on ECS fields.
Exported fields
| Field | Description | Type | Unit | Metric Type |
|---|---|---|---|---|
| @timestamp | Event timestamp. | date | ||
| agent.id | Unique identifier of this agent (if one exists). Example: For Beats this would be beat.id. | keyword | ||
| cloud.account.id | The cloud account or organization id used to identify different entities in a multi-tenant environment. Examples: AWS account id, Google Cloud ORG Id, or other unique identifier. | keyword | ||
| cloud.availability_zone | Availability zone in which this host, resource, or service is located. | keyword | ||
| cloud.instance.id | Instance ID of the host machine. | keyword | ||
| cloud.provider | Name of the cloud provider. Example values are aws, azure, gcp, or digitalocean. | keyword | ||
| cloud.region | Region in which this host, resource, or service is located. | keyword | ||
| container.id | Unique container id. | keyword | ||
| data_stream.dataset | Data stream dataset. | constant_keyword | ||
| data_stream.namespace | Data stream namespace. | constant_keyword | ||
| data_stream.type | Data stream type. | constant_keyword | ||
| event.dataset | Event module | constant_keyword | ||
| event.module | Event module | constant_keyword | ||
| host.name | Name of the host. It can contain what hostname returns on Unix systems, the fully qualified domain name (FQDN), or a name specified by the user. The recommended value is the lowercase FQDN of the host. | keyword | ||
| oracle.memory.pga.aggregate_auto_target | Amount of PGA memory the Oracle Database can use for work areas running in automatic mode. | double | byte | gauge |
| oracle.memory.pga.aggregate_target_parameter | Current value of the PGA_AGGREGATE_TARGET initialization parameter. If this parameter is not set, then its value is 0 and automatic management of PGA memory is disabled. | double | byte | gauge |
| oracle.memory.pga.cache_hit_pct | A metric computed by the Oracle Database to reflect the performance of the PGA memory component, cumulative since instance startup. | double | percent | gauge |
| oracle.memory.pga.global_memory_bound | Maximum size of a work area executed in automatic mode. | double | byte | gauge |
| oracle.memory.pga.maximum_allocated | Maximum number of bytes of PGA memory allocated at one time since instance startup. | double | byte | gauge |
| oracle.memory.pga.total_allocated | Current amount of PGA memory allocated by the instance. | double | byte | gauge |
| oracle.memory.pga.total_freeable_memory | Number of bytes of PGA memory in all processes that could be freed back to the operating system. | double | byte | gauge |
| oracle.memory.pga.total_inuse | Indicates how much PGA memory is currently consumed by work areas. This number can be used to determine how much memory is consumed by other consumers of the PGA memory (for example, PL/SQL or Java). | double | byte | gauge |
| oracle.memory.pga.total_used_for_auto_workareas | Indicates how much PGA memory is currently consumed by work areas running under the automatic memory management mode. This number can be used to determine how much memory is consumed by other consumers of the PGA memory (for example, PL/SQL or Java). | double | byte | gauge |
| oracle.memory.sga.free_memory | Amount of free memory in the Shared pool. | double | byte | gauge |
| oracle.memory.sga.total_memory | Amount of total memory in the Shared pool. | double | byte | gauge |
| service.address | Address where data about this service was collected from. This should be a URI, network address (ipv4:port or [ipv6]:port) or a resource path (sockets). | keyword |
Example
{
    "@timestamp": "2022-11-09T04:21:05.327Z",
    "agent": {
        "ephemeral_id": "df8a2ae5-c832-4b31-a31d-226a455aff19",
        "id": "c2cd9bb5-503e-492f-b6b7-fd5c845a7574",
        "name": "docker-custom-agent",
        "type": "metricbeat",
        "version": "8.4.3"
    },
    "cloud": {
        "account": {
            "id": "elastic-obs-integrations-dev"
        },
        "availability_zone": "asia-south1-c",
        "instance": {
            "id": "3010911784348669868",
            "name": "service-integration-dev-idc-01"
        },
        "machine": {
            "type": "n1-standard-8"
        },
        "project": {
            "id": "elastic-obs-integrations-dev"
        },
        "provider": "gcp",
        "service": {
            "name": "GCE"
        }
    },
    "data_stream": {
        "dataset": "oracle.memory",
        "namespace": "ep",
        "type": "metrics"
    },
    "ecs": {
        "version": "8.11.0"
    },
    "elastic_agent": {
        "id": "c2cd9bb5-503e-492f-b6b7-fd5c845a7574",
        "snapshot": false,
        "version": "8.4.3"
    },
    "event": {
        "agent_id_status": "verified",
        "dataset": "oracle.memory",
        "duration": 104106525,
        "ingested": "2022-11-09T04:21:06Z",
        "module": "sql"
    },
    "host": {
        "architecture": "x86_64",
        "containerized": true,
        "hostname": "docker-custom-agent",
        "id": "702b305d5bf3433b8efe81033888bd28",
        "ip": [
            "172.25.0.3",
            "192.168.240.4"
        ],
        "mac": [
            "02-42-AC-1F-00-07"
        ],
        "name": "docker-custom-agent",
        "os": {
            "codename": "focal",
            "family": "debian",
            "kernel": "5.4.0-1078-gcp",
            "name": "Ubuntu",
            "platform": "ubuntu",
            "type": "linux",
            "version": "20.04.5 LTS (Focal Fossa)"
        }
    },
    "metricset": {
        "name": "query",
        "period": 60000
    },
    "oracle": {
        "memory": {
            "pga": {
                "aggregate_auto_target": 593971200,
                "aggregate_target_parameter": 805306368,
                "cache_hit_pct": 100,
                "global_memory_bound": 104857600,
                "maximum_allocated": 361708544,
                "total_allocated": 197623808,
                "total_freeable_memory": 35061760,
                "total_inuse": 147043328,
                "total_used_for_auto_workareas": 0
            },
            "sga": {
                "free_memory": 33630360,
                "total_memory": 335544320
            }
        }
    },
    "service": {
        "address": "oracle:1521",
        "type": "sql"
    }
}
The System Global Area (SGA) is a group of shared memory structures that contain data and control information for one Oracle Database instance. Metrics concerning System Global Area (SGA) memory are mentioned below.
To collect the System Statistics metrics, Oracle integration relies on a specific set of views. Make sure that the user configured within the Oracle DSN configuration has READ access permissions to the following view:
V$SYSSTAT
ECS Field Reference
Refer to the following document for detailed information on ECS fields.
Exported fields
| Field | Description | Type | Unit | Metric Type |
|---|---|---|---|---|
| @timestamp | Event timestamp. | date | ||
| agent.id | Unique identifier of this agent (if one exists). Example: For Beats this would be beat.id. | keyword | ||
| cloud.account.id | The cloud account or organization id used to identify different entities in a multi-tenant environment. Examples: AWS account id, Google Cloud ORG Id, or other unique identifier. | keyword | ||
| cloud.availability_zone | Availability zone in which this host, resource, or service is located. | keyword | ||
| cloud.instance.id | Instance ID of the host machine. | keyword | ||
| cloud.provider | Name of the cloud provider. Example values are aws, azure, gcp, or digitalocean. | keyword | ||
| cloud.region | Region in which this host, resource, or service is located. | keyword | ||
| container.id | Unique container id. | keyword | ||
| data_stream.dataset | Data stream dataset. | constant_keyword | ||
| data_stream.namespace | Data stream namespace. | constant_keyword | ||
| data_stream.type | Data stream type. | constant_keyword | ||
| event.dataset | Event module | constant_keyword | ||
| event.module | Event module | constant_keyword | ||
| host.name | Name of the host. It can contain what hostname returns on Unix systems, the fully qualified domain name (FQDN), or a name specified by the user. The recommended value is the lowercase FQDN of the host. | keyword | ||
| oracle.system_statistics.bytes_received_via_sqlnet_from_client | Total number of bytes received from the client over Oracle Net Services. | double | byte | counter |
| oracle.system_statistics.bytes_received_via_sqlnet_from_dblink | Total number of bytes received from a database link over Oracle Net Services | double | byte | counter |
| oracle.system_statistics.bytes_sent_via_sqlnet_to_client | Total number of bytes sent to the client from the foreground processes. | double | byte | counter |
| oracle.system_statistics.bytes_sent_via_sqlnet_to_dblink | Total number of bytes sent over a database link. | double | byte | counter |
| oracle.system_statistics.cpu_used_by_this_session | Amount of CPU time (in 10s of milliseconds) used by a session from the time a user call starts until it ends. | double | ms | counter |
| oracle.system_statistics.db_block_changes | This statistic counts the total number of changes that were part of an update or delete operation that were made to all blocks in the SGA. | double | counter | |
| oracle.system_statistics.db_block_gets_from_cache | The number of times a CURRENT block was requested from the buffer cache. | double | counter | |
| oracle.system_statistics.db_time | The sum of CPU consumption of all the Oracle process and the sum of non-idle wait time. | double | counter | |
| oracle.system_statistics.dbwr_checkpoint_buffers_written | The number of buffers that were written for checkpoints. | double | counter | |
| oracle.system_statistics.dbwr_checkpoints | The number of times the DBWR was asked to scan the cache and write all blocks marked for a checkpoint or the end of recovery. | double | counter | |
| oracle.system_statistics.dml_statements_parallelized | The number of DML statements that were executed in parallel. | double | counter | |
| oracle.system_statistics.enqueue_conversions | Total number of conversions of the state of table or row lock. | double | counter | |
| oracle.system_statistics.enqueue_deadlocks | Total number of deadlocks between table or row locks in different sessions. | double | counter | |
| oracle.system_statistics.enqueue_releases | Total number of table or row locks released. | double | counter | |
| oracle.system_statistics.enqueue_requests | Total number of table or row locks acquired | double | counter | |
| oracle.system_statistics.enqueue_timeouts | Total number of table and row locks (acquired and converted) that timed out before they could complete. | double | counter | |
| oracle.system_statistics.enqueue_waits | Total number of waits that occurred during an enqueue convert or get because the enqueue get was deferred. | double | counter | |
| oracle.system_statistics.exchange_deadlocks | Number of times that a process detected a potential deadlock when exchanging two buffers and raised an internal, restartable error. Index scans are the only operations that perform exchanges. | double | counter | |
| oracle.system_statistics.execute_count | Total number of calls (user and recursive) that executed SQL statements. | double | counter | |
| oracle.system_statistics.gc_current_block_receive_time | The total time required for consistent read requests to complete. It records the round-trip time for all requests for consistent read blocks. | double | counter | |
| oracle.system_statistics.index_fast_full_scans_direct_read | The number of fast full scans initiated using direct read. | double | counter | |
| oracle.system_statistics.index_fast_full_scans_full | The number of fast full scans initiated using direct read. | double | counter | |
| oracle.system_statistics.index_fast_full_scans_rowid_ranges | The number of fast full scans initiated with rowid endpoints specified. | double | counter | |
| oracle.system_statistics.java_call_heap_live_size | The Java call heap live size. | double | counter | |
| oracle.system_statistics.java_call_heap_total_size | The total Java call heap size. | double | byte | counter |
| oracle.system_statistics.java_call_heap_used_size | The Java call heap used size. | double | counter | |
| oracle.system_statistics.lob_reads | The number of LOB API read operations performed in the session/system. | double | counter | |
| oracle.system_statistics.lob_writes | The number of LOB API write operations performed in the session/system. | double | counter | |
| oracle.system_statistics.logons_current | Total number of current logons. | double | counter | |
| oracle.system_statistics.opened_cursors_current | Total number of current open cursors. | double | counter | |
| oracle.system_statistics.os_system_time_used | The total CPU time used for system calls. | double | counter | |
| oracle.system_statistics.os_user_time_used | The total CPU time used for user calls. | double | counter | |
| oracle.system_statistics.parallel_operations_not_downgraded | Number of times parallel execution was executed at the requested degree of parallelism | double | counter | |
| oracle.system_statistics.parse_count_hard | Total number of parse calls (real parses). | double | counter | |
| oracle.system_statistics.parse_count_total | Total number of parse calls (hard, soft, and describe). | double | counter | |
| oracle.system_statistics.parse_time_cpu | Total CPU time used for parsing (hard and soft) in 10s of milliseconds | double | ms | counter |
| oracle.system_statistics.parse_time_elapsed | Total elapsed time for parsing, in 10s of milliseconds. | double | ms | counter |
| oracle.system_statistics.physical_read_bytes | Total size in bytes of all disk reads by application activity (and not other instance activity) only. | double | byte | counter |
| oracle.system_statistics.physical_read_io_requests | Number of read requests for application activity (mainly buffer cache and direct load operation) which read one or more database blocks per request. | double | counter | |
| oracle.system_statistics.physical_read_total_bytes | Total size in bytes of disk reads by all database instance activity including application reads, backup and recovery, and other utilities. | double | byte | counter |
| oracle.system_statistics.physical_read_total_io_requests | The number of read requests which read one or more database blocks for all instance activity including application, backup and recovery, and other utilities. | double | counter | |
| oracle.system_statistics.physical_reads | Total number of data blocks read from disk. | double | counter | |
| oracle.system_statistics.physical_write_bytes | Total size in bytes of all disk writes from the database application activity (and not other kinds of instance activity). | double | byte | counter |
| oracle.system_statistics.physical_write_io_requests | Number of write requests for application activity (mainly buffer cache and direct load operation) which wrote one or more database blocks per request. | double | counter | |
| oracle.system_statistics.physical_write_total_bytes | Total size in bytes of all disk writes for the database instance including application activity, backup and recovery, and other utilities. | double | byte | counter |
| oracle.system_statistics.physical_write_total_io_requests | The number of write requests which wrote one or more database blocks from all instance activity including application activity, backup and recovery, and other utilities. | double | counter | |
| oracle.system_statistics.physical_writes | Total number of data blocks written to disk. This statistics value equals the sum of physical writes direct and physical writes from cache values. | double | counter | |
| oracle.system_statistics.physical_writes_direct | Number of writes directly to disk, bypassing the buffer cache (as in a direct load operation). | double | counter | |
| oracle.system_statistics.physical_writes_from_cache | Total number of data blocks written to disk from the buffer cache. This is a subset of "physical writes" statistic. | double | counter | |
| oracle.system_statistics.process_last_non_idle_time | The last time this process executed. | double | counter | |
| oracle.system_statistics.queries_parallelized | Number of SELECT statements executed in parallel. | double | counter | |
| oracle.system_statistics.recovery_blocks_read | The number of blocks read during recovery. | double | counter | |
| oracle.system_statistics.recursive_calls | The number of recursive calls generated at both the user and system level. | double | counter | |
| oracle.system_statistics.recursive_cpu_usage | Total CPU time used by non-user calls (recursive calls). | double | counter | |
| oracle.system_statistics.redo_blocks_written | Total number of redo blocks written. | double | counter | |
| oracle.system_statistics.redo_buffer_allocation_retries | Total number of retries necessary to allocate space in the redo buffer. | double | counter | |
| oracle.system_statistics.redo_log_space_requests | The number of times the active log file is full and Oracle must wait for disk space to be allocated for the redo log entries. | double | counter | |
| oracle.system_statistics.redo_log_space_wait_time | Total time waited in centiseconds for available space in the redo log buffer. | double | counter | |
| oracle.system_statistics.redo_size | Total amount of redo generated in bytes. | double | byte | counter |
| oracle.system_statistics.redo_synch_time | Elapsed time of all redo synch writes calls in 10s of milliseconds. | double | ms | counter |
| oracle.system_statistics.redo_write_time | Total elapsed time of the write from the redo log buffer to the current redo log file in microseconds. | double | micros | counter |
| oracle.system_statistics.redo_writes | Total number of writes by LGWR to the redo log files. | double | counter | |
| oracle.system_statistics.session_cursor_cache_count | Total number of cursors cached. | double | counter | |
| oracle.system_statistics.session_cursor_cache_hits | Total number of cursors cached. | double | counter | |
| oracle.system_statistics.session_logical_reads | The sum of db block gets plus consistent gets. This includes logical reads of database blocks from either the buffer cache or process private memory. | double | counter | |
| oracle.system_statistics.session_stored_procedure_space | Amount of memory this session is using for stored procedures. | double | counter | |
| oracle.system_statistics.smon_posted_for_instance_recovery | The total count or number of times SMON posted for instance recovery. | double | counter | |
| oracle.system_statistics.smon_posted_for_txn_recovery_for_other_instances | The total count or number of times SMON posted for instance recovery | double | counter | |
| oracle.system_statistics.sorts_disk | The number of sort operations that required at least one disk write. | double | counter | |
| oracle.system_statistics.sorts_memory | The number of sort operations that were performed completely in memory and did not require any disk writes. | double | counter | |
| oracle.system_statistics.sorts_rows | Total number of rows sorted. | double | counter | |
| oracle.system_statistics.table_scan_rows_gotten | Number of rows that are processed during scanning operations. | double | counter | |
| oracle.system_statistics.table_scans_direct_read | The number of table scans performed with direct read (bypassing the buffer cache). | double | counter | |
| oracle.system_statistics.table_scans_long_tables | Long (or conversely short) tables can be defined as tables that do not meet the short table criteria. | double | counter | |
| oracle.system_statistics.table_scans_rowid_ranges | During parallel query, the number of table scans conducted with specified ROWID ranges. | double | counter | |
| oracle.system_statistics.transaction_rollbacks | Number of transactions being successfully rolled back. | double | counter | |
| oracle.system_statistics.user_calls | Number of user calls such as login, parse, fetch, or execute. | double | counter | |
| oracle.system_statistics.user_commits | Number of user commits. When a user commits a transaction, the redo generated that reflects the changes made to database blocks must be written to disk. | double | counter | |
| oracle.system_statistics.user_rollbacks | Number of times users manually issue the ROLLBACK statement or an error occurs during a user's transactions. | double | counter | |
| service.address | Address where data about this service was collected from. This should be a URI, network address (ipv4:port or [ipv6]:port) or a resource path (sockets). | keyword |
Example
{
    "@timestamp": "2022-11-09T04:31:54.386Z",
    "agent": {
        "ephemeral_id": "a4fc8cc8-ffc8-41ca-95c0-84e4f17bf1d1",
        "id": "cb76e254-12e8-4c08-9044-4fe4255975da",
        "name": "docker-custom-agent",
        "type": "metricbeat",
        "version": "8.4.3"
    },
    "cloud": {
        "account": {
            "id": "elastic-obs-integrations-dev"
        },
        "availability_zone": "asia-south1-c",
        "instance": {
            "id": "3010911784348669868",
            "name": "service-integration-dev-idc-01"
        },
        "machine": {
            "type": "n1-standard-8"
        },
        "project": {
            "id": "elastic-obs-integrations-dev"
        },
        "provider": "gcp",
        "service": {
            "name": "GCE"
        }
    },
    "data_stream": {
        "dataset": "oracle.system_statistics",
        "namespace": "ep",
        "type": "metrics"
    },
    "ecs": {
        "version": "8.11.0"
    },
    "elastic_agent": {
        "id": "cb76e254-12e8-4c08-9044-4fe4255975da",
        "snapshot": false,
        "version": "8.4.3"
    },
    "event": {
        "agent_id_status": "verified",
        "dataset": "oracle.system_statistics",
        "duration": 79970148,
        "ingested": "2022-11-09T04:31:55Z",
        "module": "sql"
    },
    "host": {
        "architecture": "x86_64",
        "containerized": true,
        "hostname": "docker-custom-agent",
        "id": "702b305d5bf3433b8efe81033888bd28",
        "ip": [
            "172.28.0.3",
            "192.168.240.4"
        ],
        "mac": [
            "02-42-AC-1F-00-07"
        ],
        "name": "docker-custom-agent",
        "os": {
            "codename": "focal",
            "family": "debian",
            "kernel": "5.4.0-1078-gcp",
            "name": "Ubuntu",
            "platform": "ubuntu",
            "type": "linux",
            "version": "20.04.5 LTS (Focal Fossa)"
        }
    },
    "metricset": {
        "name": "query",
        "period": 60000
    },
    "oracle": {
        "system_statistics": {
            "bytes_received_via_sqlnet_from_client": 15982,
            "bytes_received_via_sqlnet_from_dblink": 0,
            "bytes_sent_via_sqlnet_to_client": 25891,
            "bytes_sent_via_sqlnet_to_dblink": 0,
            "cpu_used_by_this_session": 1794,
            "db_block_changes": 31677,
            "db_block_gets_from_cache": 27540,
            "db_time": 64115,
            "dbwr_checkpoint_buffers_written": 0,
            "dbwr_checkpoints": 3,
            "dml_statements_parallelized": 0,
            "enqueue_conversions": 610,
            "enqueue_deadlocks": 0,
            "enqueue_releases": 28193,
            "enqueue_requests": 28233,
            "enqueue_timeouts": 9,
            "enqueue_waits": 53,
            "exchange_deadlocks": 0,
            "execute_count": 53587,
            "gc_current_block_receive_time": 0,
            "index_fast_full_scans_direct_read": 0,
            "index_fast_full_scans_full": 858,
            "index_fast_full_scans_rowid_ranges": 0,
            "java_call_heap_live_size": 0,
            "java_call_heap_total_size": 0,
            "java_call_heap_used_size": 0,
            "lob_reads": 126,
            "lob_writes": 206,
            "logons_current": 41,
            "opened_cursors_current": 25,
            "os_system_time_used": 0,
            "os_user_time_used": 0,
            "parallel_operations_not_downgraded": 8,
            "parse_count_hard": 4131,
            "parse_count_total": 20224,
            "parse_time_cpu": 560,
            "parse_time_elapsed": 1338,
            "physical_read_bytes": 143785984,
            "physical_read_io_requests": 10758,
            "physical_read_total_bytes": 1264044544,
            "physical_read_total_io_requests": 13539,
            "physical_reads": 17552,
            "physical_write_bytes": 188416,
            "physical_write_io_requests": 23,
            "physical_write_total_bytes": 1094185289,
            "physical_write_total_io_requests": 2209,
            "physical_writes": 23,
            "physical_writes_direct": 14,
            "physical_writes_from_cache": 9,
            "process_last_non_idle_time": 1667968313,
            "queries_parallelized": 2,
            "recovery_blocks_read": 0,
            "recursive_calls": 220113,
            "recursive_cpu_usage": 1462,
            "redo_blocks_written": 9478,
            "redo_buffer_allocation_retries": 4,
            "redo_log_space_requests": 4,
            "redo_log_space_wait_time": 2,
            "redo_size": 4568196,
            "redo_synch_time": 73,
            "redo_write_time": 277,
            "redo_writes": 476,
            "session_cursor_cache_count": 4017,
            "session_cursor_cache_hits": 52537,
            "session_logical_reads": 371800,
            "session_stored_procedure_space": 0,
            "smon_posted_for_instance_recovery": 0,
            "smon_posted_for_txn_recovery_for_other_instances": 0,
            "sorts_disk": 0,
            "sorts_memory": 11360,
            "sorts_rows": 153397,
            "table_scan_rows_gotten": 3049493,
            "table_scans_direct_read": 0,
            "table_scans_long_tables": 0,
            "table_scans_rowid_ranges": 0,
            "transaction_rollbacks": 6,
            "user_calls": 564,
            "user_commits": 62,
            "user_rollbacks": 1
        }
    },
    "service": {
        "address": "oracle:1521",
        "type": "sql"
    }
}
Performance metrics give an overview of where time is spent in the system and enable comparisons of wait times across the system.
To collect the Performance metrics, Oracle integration relies on a specific set of views. Make sure that the user configured within the Oracle DSN configuration has READ access permissions to the following views:
V$BUFFER_POOL_STATISTICSV$SESSTATV$SYSSTATV$LIBRARYCACHEDBA_JOBSGV$SESSIONV$SYSTEM_WAIT_CLASS
ECS Field Reference
Refer to the following document for detailed information on ECS fields.
Exported fields
| Field | Description | Type | Unit | Metric Type |
|---|---|---|---|---|
| @timestamp | Date/time when the event originated. This is the date/time extracted from the event, typically representing when the event was generated by the source. If the event source has no original timestamp, this value is typically populated by the first time the event was received by the pipeline. Required field for all events. | date | ||
| agent.id | Unique identifier of this agent (if one exists). Example: For Beats this would be beat.id. | keyword | ||
| cloud.account.id | The cloud account or organization id used to identify different entities in a multi-tenant environment. Examples: AWS account id, Google Cloud ORG Id, or other unique identifier. | keyword | ||
| cloud.availability_zone | Availability zone in which this host, resource, or service is located. | keyword | ||
| cloud.instance.id | Instance ID of the host machine. | keyword | ||
| cloud.provider | Name of the cloud provider. Example values are aws, azure, gcp, or digitalocean. | keyword | ||
| cloud.region | Region in which this host, resource, or service is located. | keyword | ||
| container.id | Unique container id. | keyword | ||
| data_stream.dataset | The field can contain anything that makes sense to signify the source of the data. Examples include nginx.access, prometheus, endpoint etc. For data streams that otherwise fit, but that do not have dataset set we use the value "generic" for the dataset value. event.dataset should have the same value as data_stream.dataset. Beyond the Elasticsearch data stream naming criteria noted above, the dataset value has additional restrictions: * Must not contain - * No longer than 100 characters |
constant_keyword | ||
| data_stream.namespace | A user defined namespace. Namespaces are useful to allow grouping of data. Many users already organize their indices this way, and the data stream naming scheme now provides this best practice as a default. Many users will populate this field with default. If no value is used, it falls back to default. Beyond the Elasticsearch index naming criteria noted above, namespace value has the additional restrictions: * Must not contain - * No longer than 100 characters |
constant_keyword | ||
| data_stream.type | An overarching type for the data stream. Currently allowed values are "logs" and "metrics". We expect to also add "traces" and "synthetics" in the near future. | constant_keyword | ||
| event.dataset | Event module | constant_keyword | ||
| event.module | Event module | constant_keyword | ||
| host.name | Name of the host. It can contain what hostname returns on Unix systems, the fully qualified domain name (FQDN), or a name specified by the user. The recommended value is the lowercase FQDN of the host. | keyword | ||
| oracle.performance.buffer_pool | Name of the buffer pool in the instance. | keyword | ||
| oracle.performance.cache.buffer.hit.pct | The cache hit ratio of the specified buffer pool. | double | percent | gauge |
| oracle.performance.cache.get.consistent | Consistent gets statistic. | long | gauge | |
| oracle.performance.cache.get.db_blocks | Database blocks gotten. | long | gauge | |
| oracle.performance.cache.physical_reads | Physical reads. This metric represents the number of data blocks read from disk per second during a time period. | long | gauge | |
| oracle.performance.cursors.avg | Average cursors opened by username and machine. | double | gauge | |
| oracle.performance.cursors.cache_hit.pct | Ratio of session cursor cache hits from total number of cursors. | double | percent | gauge |
| oracle.performance.cursors.max | Max cursors opened by username and machine. | double | gauge | |
| oracle.performance.cursors.opened.current | Total number of current open cursors. | long | gauge | |
| oracle.performance.cursors.opened.total | Total number of cursors opened since the instance started. | long | counter | |
| oracle.performance.cursors.parse.real | "Real number of parses that occurred: session cursor cache hits - parse count (total)." | double | gauge | |
| oracle.performance.cursors.parse.total | Total number of parse calls (hard and soft). A soft parse is a check on an object already in the shared pool, to verify that the permissions on the underlying object have not changed. | long | gauge | |
| oracle.performance.cursors.session.cache_hits | Number of hits in the session cursor cache. A hit means that the SQL statement did not have to be reparsed. | double | gauge | |
| oracle.performance.cursors.total | Total opened cursors by username and machine. | double | gauge | |
| oracle.performance.failed_db_jobs | This metric checks for failed DBMS jobs. | double | gauge | |
| oracle.performance.io_reloads | Reloads by Pins ratio. A Reload is any PIN of an object that is not the first PIN performed since the object handle was created, and which requires loading the object from disk. Pins are the number of times a PIN was requested for objects of this namespace. | double | gauge | |
| oracle.performance.lock_requests | Average of the ratio between 'gethits' and 'gets', where 'gethits' the number of times an object's handle was found in memory and 'gets' is the number of times a lock was requested for objects of this namespace. | double | gauge | |
| oracle.performance.machine | Operating system machine name. | keyword | ||
| oracle.performance.pin_requests | Average of all pinhits/pins ratios, where 'PinHits' is the number of times all of the metadata pieces of the library object were found in memory and 'pins' is the number of times a PIN was requested for objects of this namespace. | double | gauge | |
| oracle.performance.query_id | Autogenerated ID representing the Oracle query that is executed to fetch the results. | keyword | ||
| oracle.performance.session_count.active | Total count of sessions. | double | gauge | |
| oracle.performance.session_count.inactive | Total count of Inactive sessions. | double | gauge | |
| oracle.performance.session_count.inactive_morethan_onehr | Total inactive sessions more than one hour. | double | gauge | |
| oracle.performance.username | Oracle username | keyword | ||
| oracle.performance.wait.pct_time | Percentage of time waits that are not Idle wait class. | double | percent | gauge |
| oracle.performance.wait.pct_waits | Percentage of number of pct time waits that are not of Idle wait class. | double | percent | gauge |
| oracle.performance.wait.time_waited_secs | Amount of time spent in the wait class by the session. | double | s | gauge |
| oracle.performance.wait.total_waits | Number of times waits of the class occurred for the session. | double | counter | |
| oracle.performance.wait.wait_class | Every wait event belongs to a class of wait event. Wait classes can be one of the following - Administrative, Application, Cluster, Commit, Concurrency, Configuration, Idle, Network, Other, Scheduler, System IO, User IO | keyword | ||
| service.address | Address where data about this service was collected from. This should be a URI, network address (ipv4:port or [ipv6]:port) or a resource path (sockets). | keyword |
Example
{
    "@timestamp": "2022-11-09T04:24:38.581Z",
    "agent": {
        "ephemeral_id": "622d8585-de9d-4fbf-8a16-0f16a7cc5429",
        "id": "a7ec6f52-409e-4f25-80e6-a221e04812c7",
        "name": "docker-custom-agent",
        "type": "metricbeat",
        "version": "8.4.3"
    },
    "cloud": {
        "account": {
            "id": "elastic-obs-integrations-dev"
        },
        "availability_zone": "asia-south1-c",
        "instance": {
            "id": "3010911784348669868",
            "name": "service-integration-dev-idc-01"
        },
        "machine": {
            "type": "n1-standard-8"
        },
        "project": {
            "id": "elastic-obs-integrations-dev"
        },
        "provider": "gcp",
        "service": {
            "name": "GCE"
        }
    },
    "data_stream": {
        "dataset": "oracle.performance",
        "namespace": "ep",
        "type": "metrics"
    },
    "ecs": {
        "version": "8.11.0"
    },
    "elastic_agent": {
        "id": "a7ec6f52-409e-4f25-80e6-a221e04812c7",
        "snapshot": false,
        "version": "8.4.3"
    },
    "event": {
        "agent_id_status": "verified",
        "dataset": "oracle.performance",
        "duration": 93046359,
        "ingested": "2022-11-09T04:24:38Z",
        "module": "sql"
    },
    "host": {
        "architecture": "x86_64",
        "containerized": true,
        "hostname": "docker-custom-agent",
        "id": "702b305d5bf3433b8efe81033888bd28",
        "ip": [
            "172.26.0.3",
            "192.168.240.4"
        ],
        "mac": [
            "02-42-AC-1F-00-07"
        ],
        "name": "docker-custom-agent",
        "os": {
            "codename": "focal",
            "family": "debian",
            "kernel": "5.4.0-1078-gcp",
            "name": "Ubuntu",
            "platform": "ubuntu",
            "type": "linux",
            "version": "20.04.5 LTS (Focal Fossa)"
        }
    },
    "metricset": {
        "name": "query",
        "period": 60000
    },
    "oracle": {
        "performance": {
            "buffer_pool": "DEFAULT",
            "cache": {
                "buffer": {
                    "hit": {
                        "pct": 0.952424765502866
                    }
                },
                "get": {
                    "consistent": 344187,
                    "db_blocks": 24261
                },
                "physical_reads": 17529
            }
        }
    },
    "service": {
        "address": "oracle:1521",
        "type": "sql"
    }
}
This integration includes one or more Kibana dashboards that visualizes the data collected by the integration. The screenshots below illustrate how the ingested data is displayed.
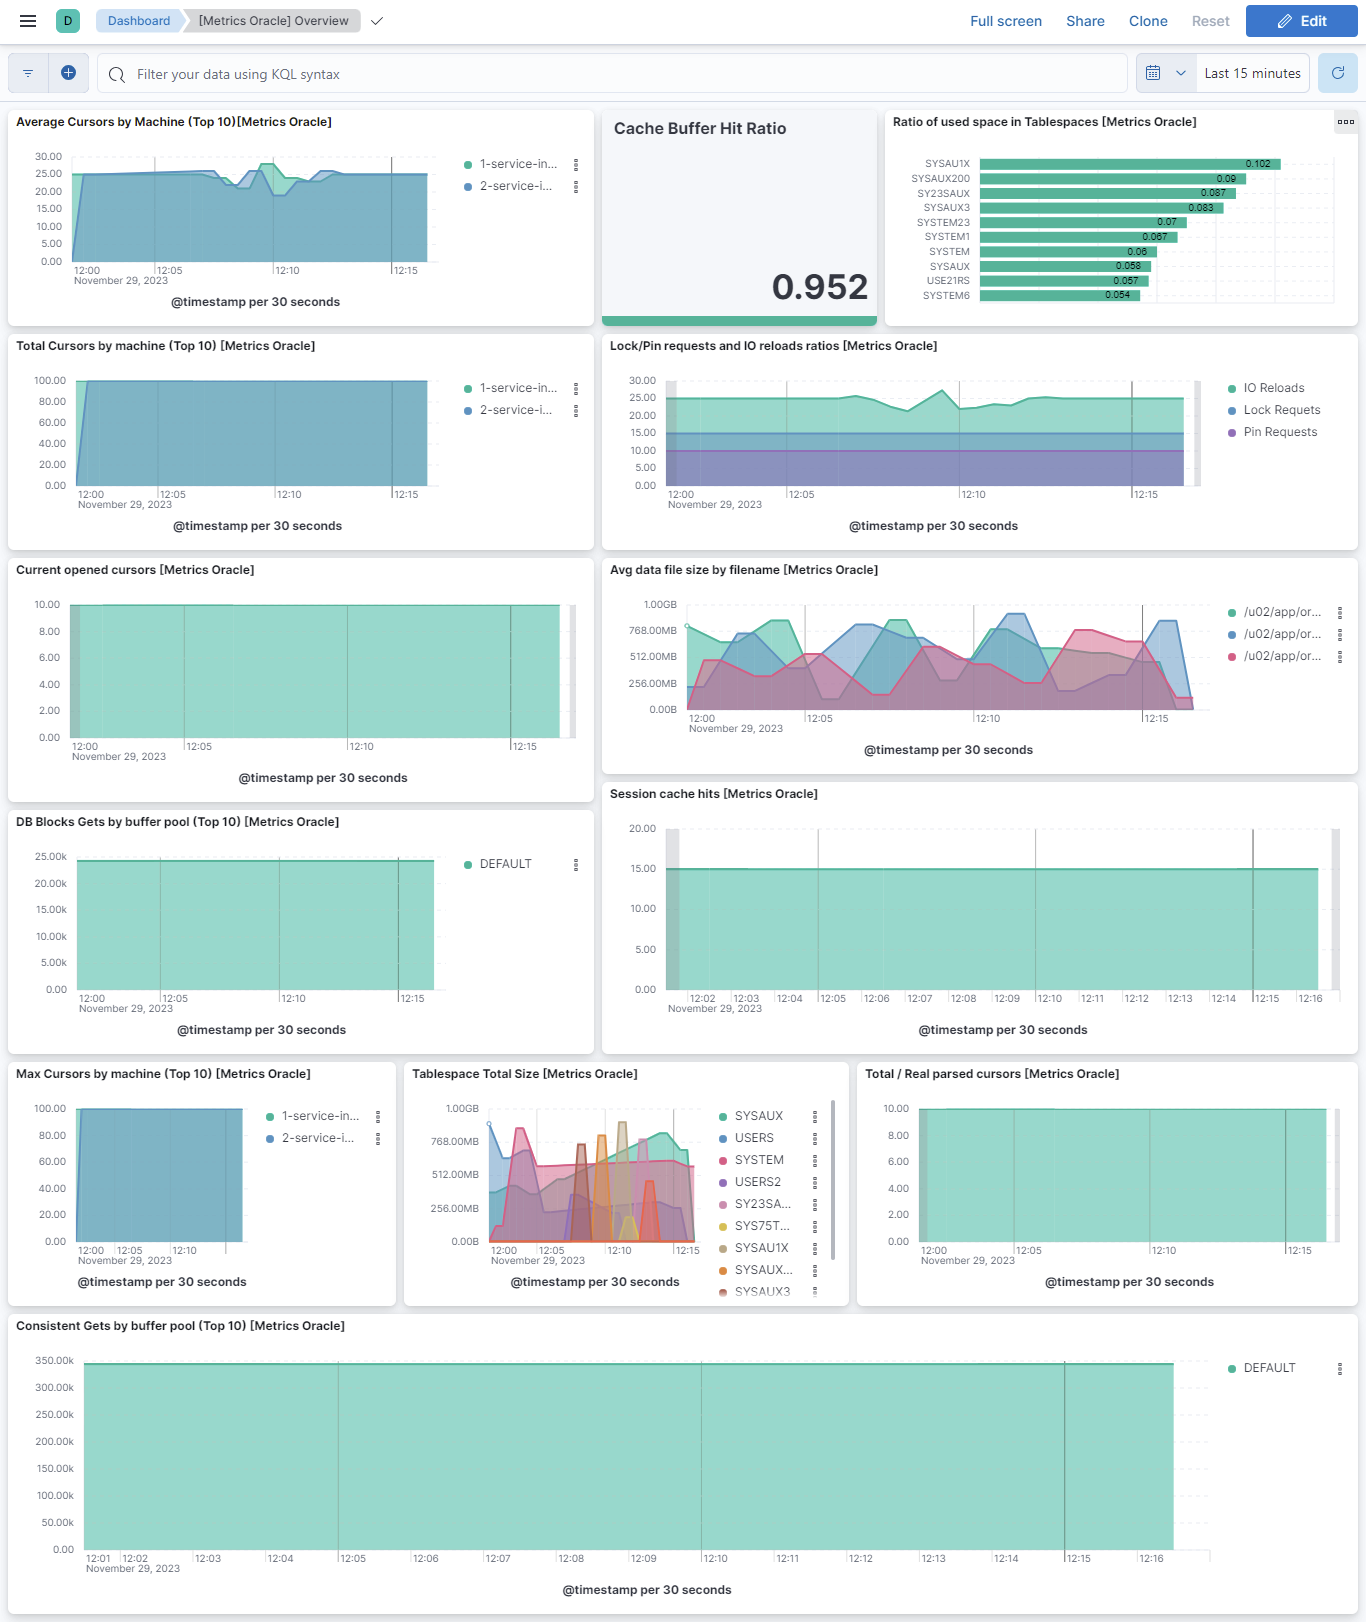
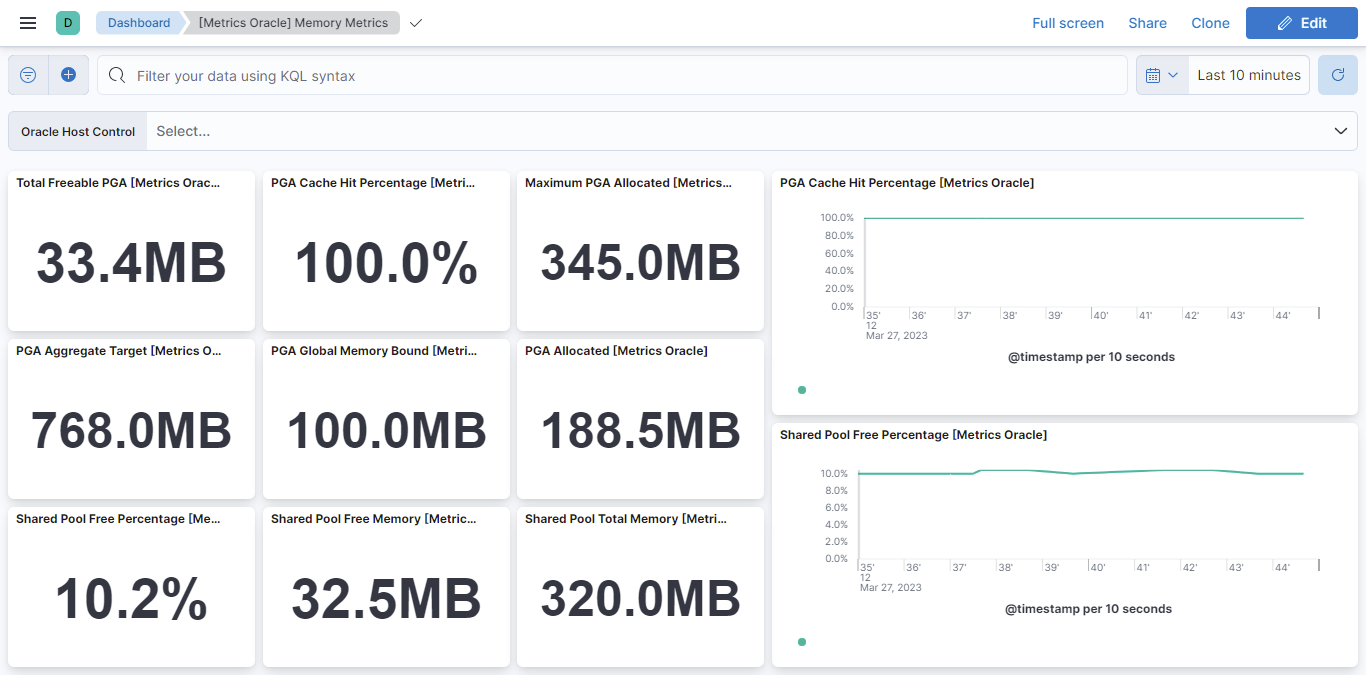
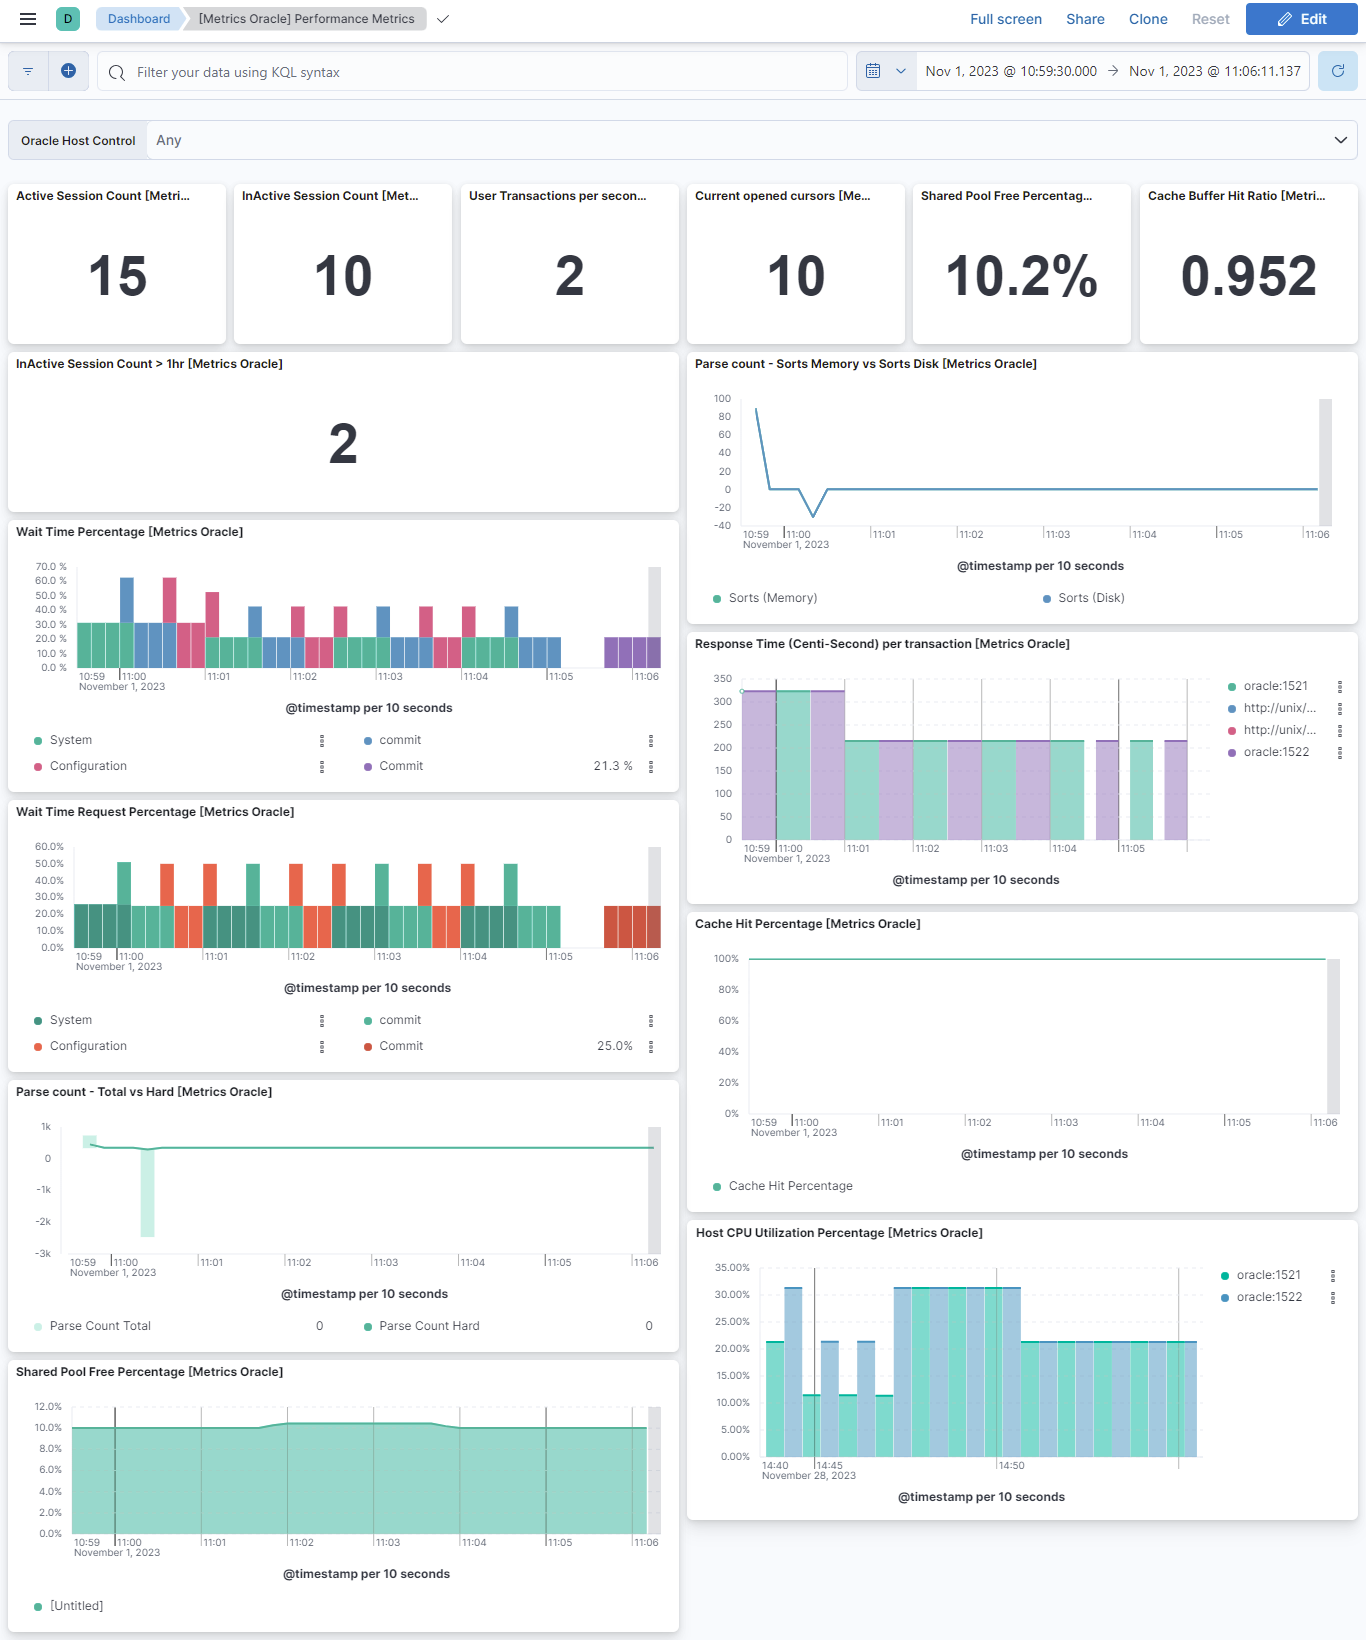
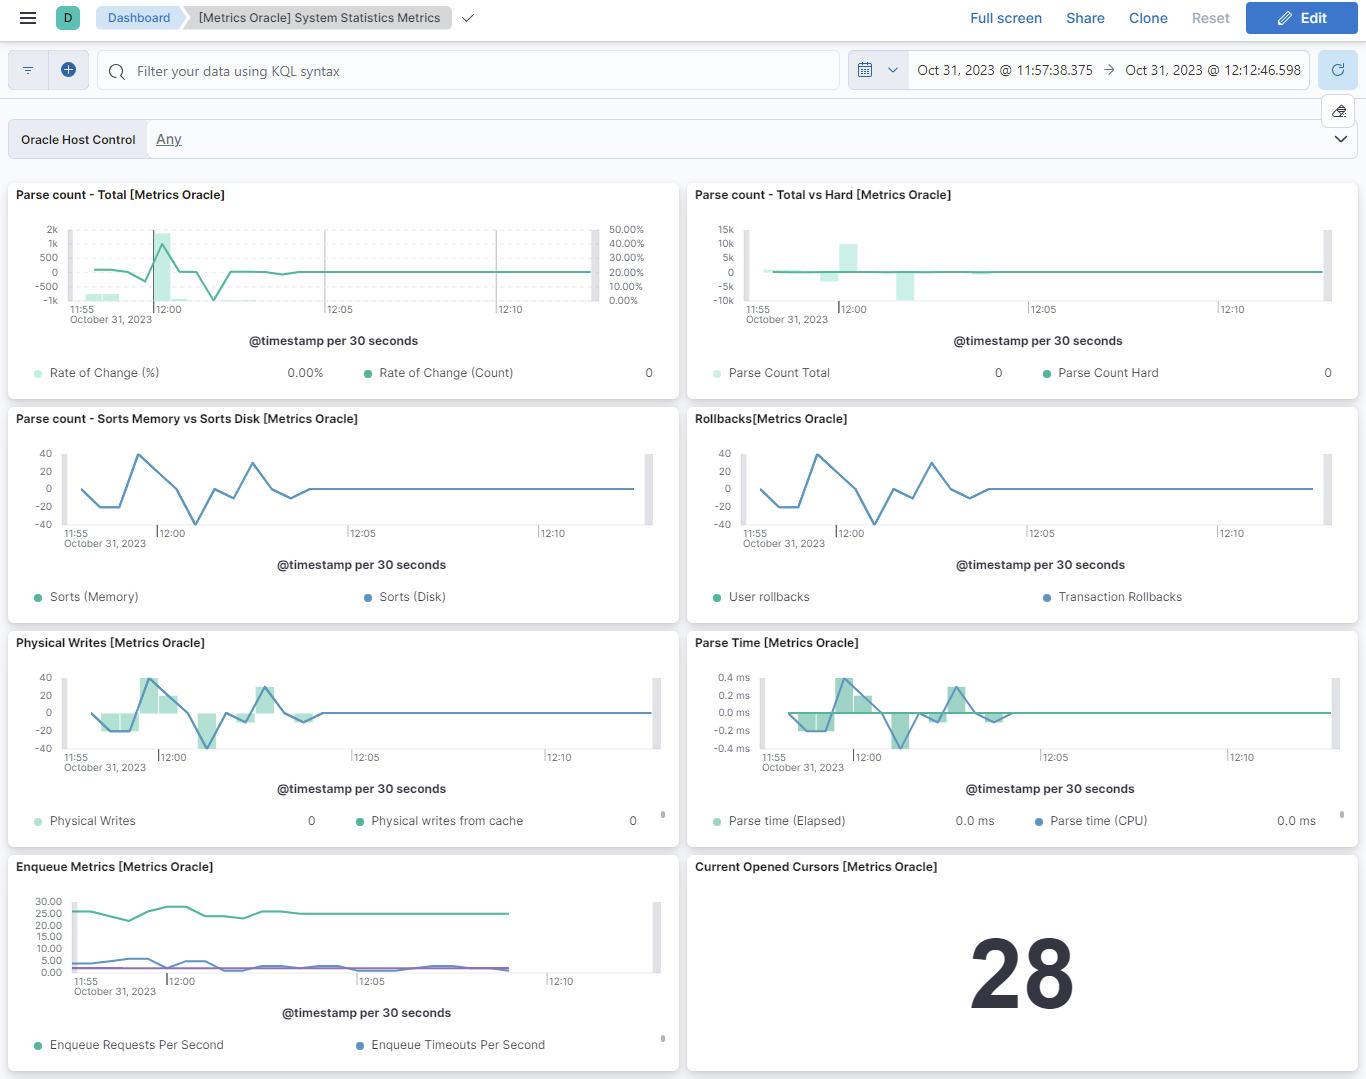
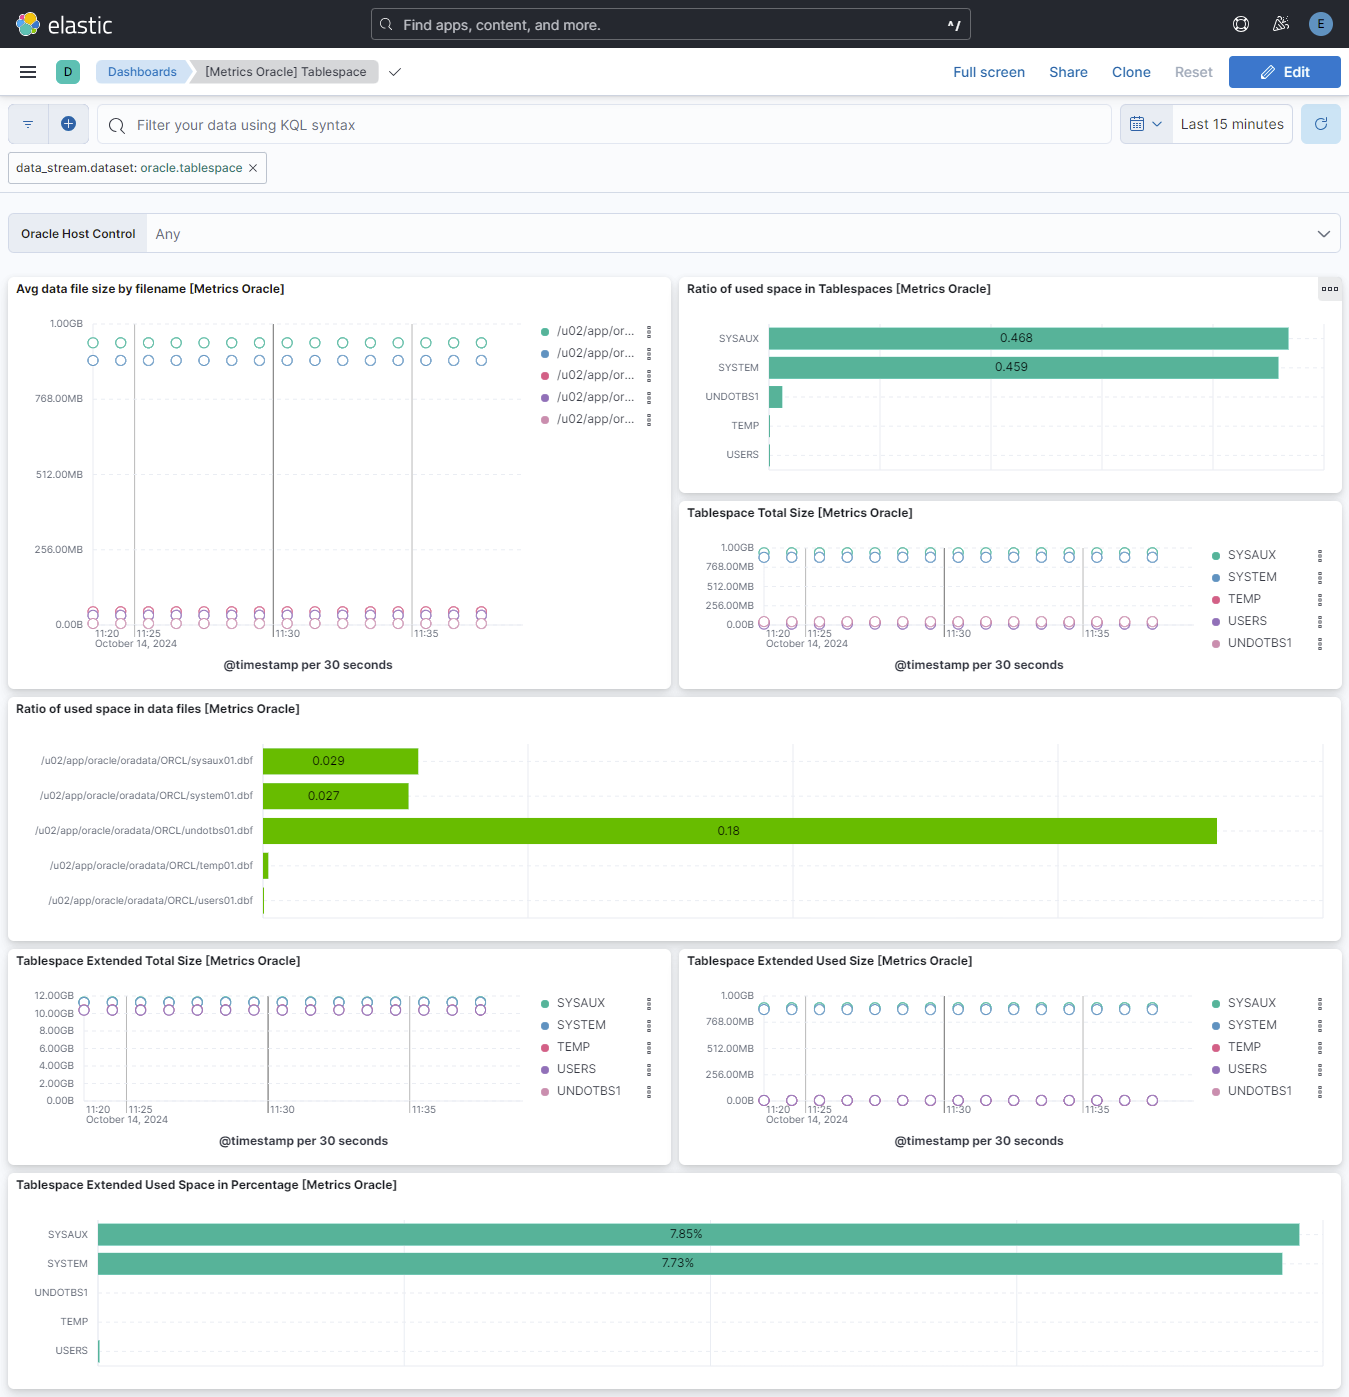
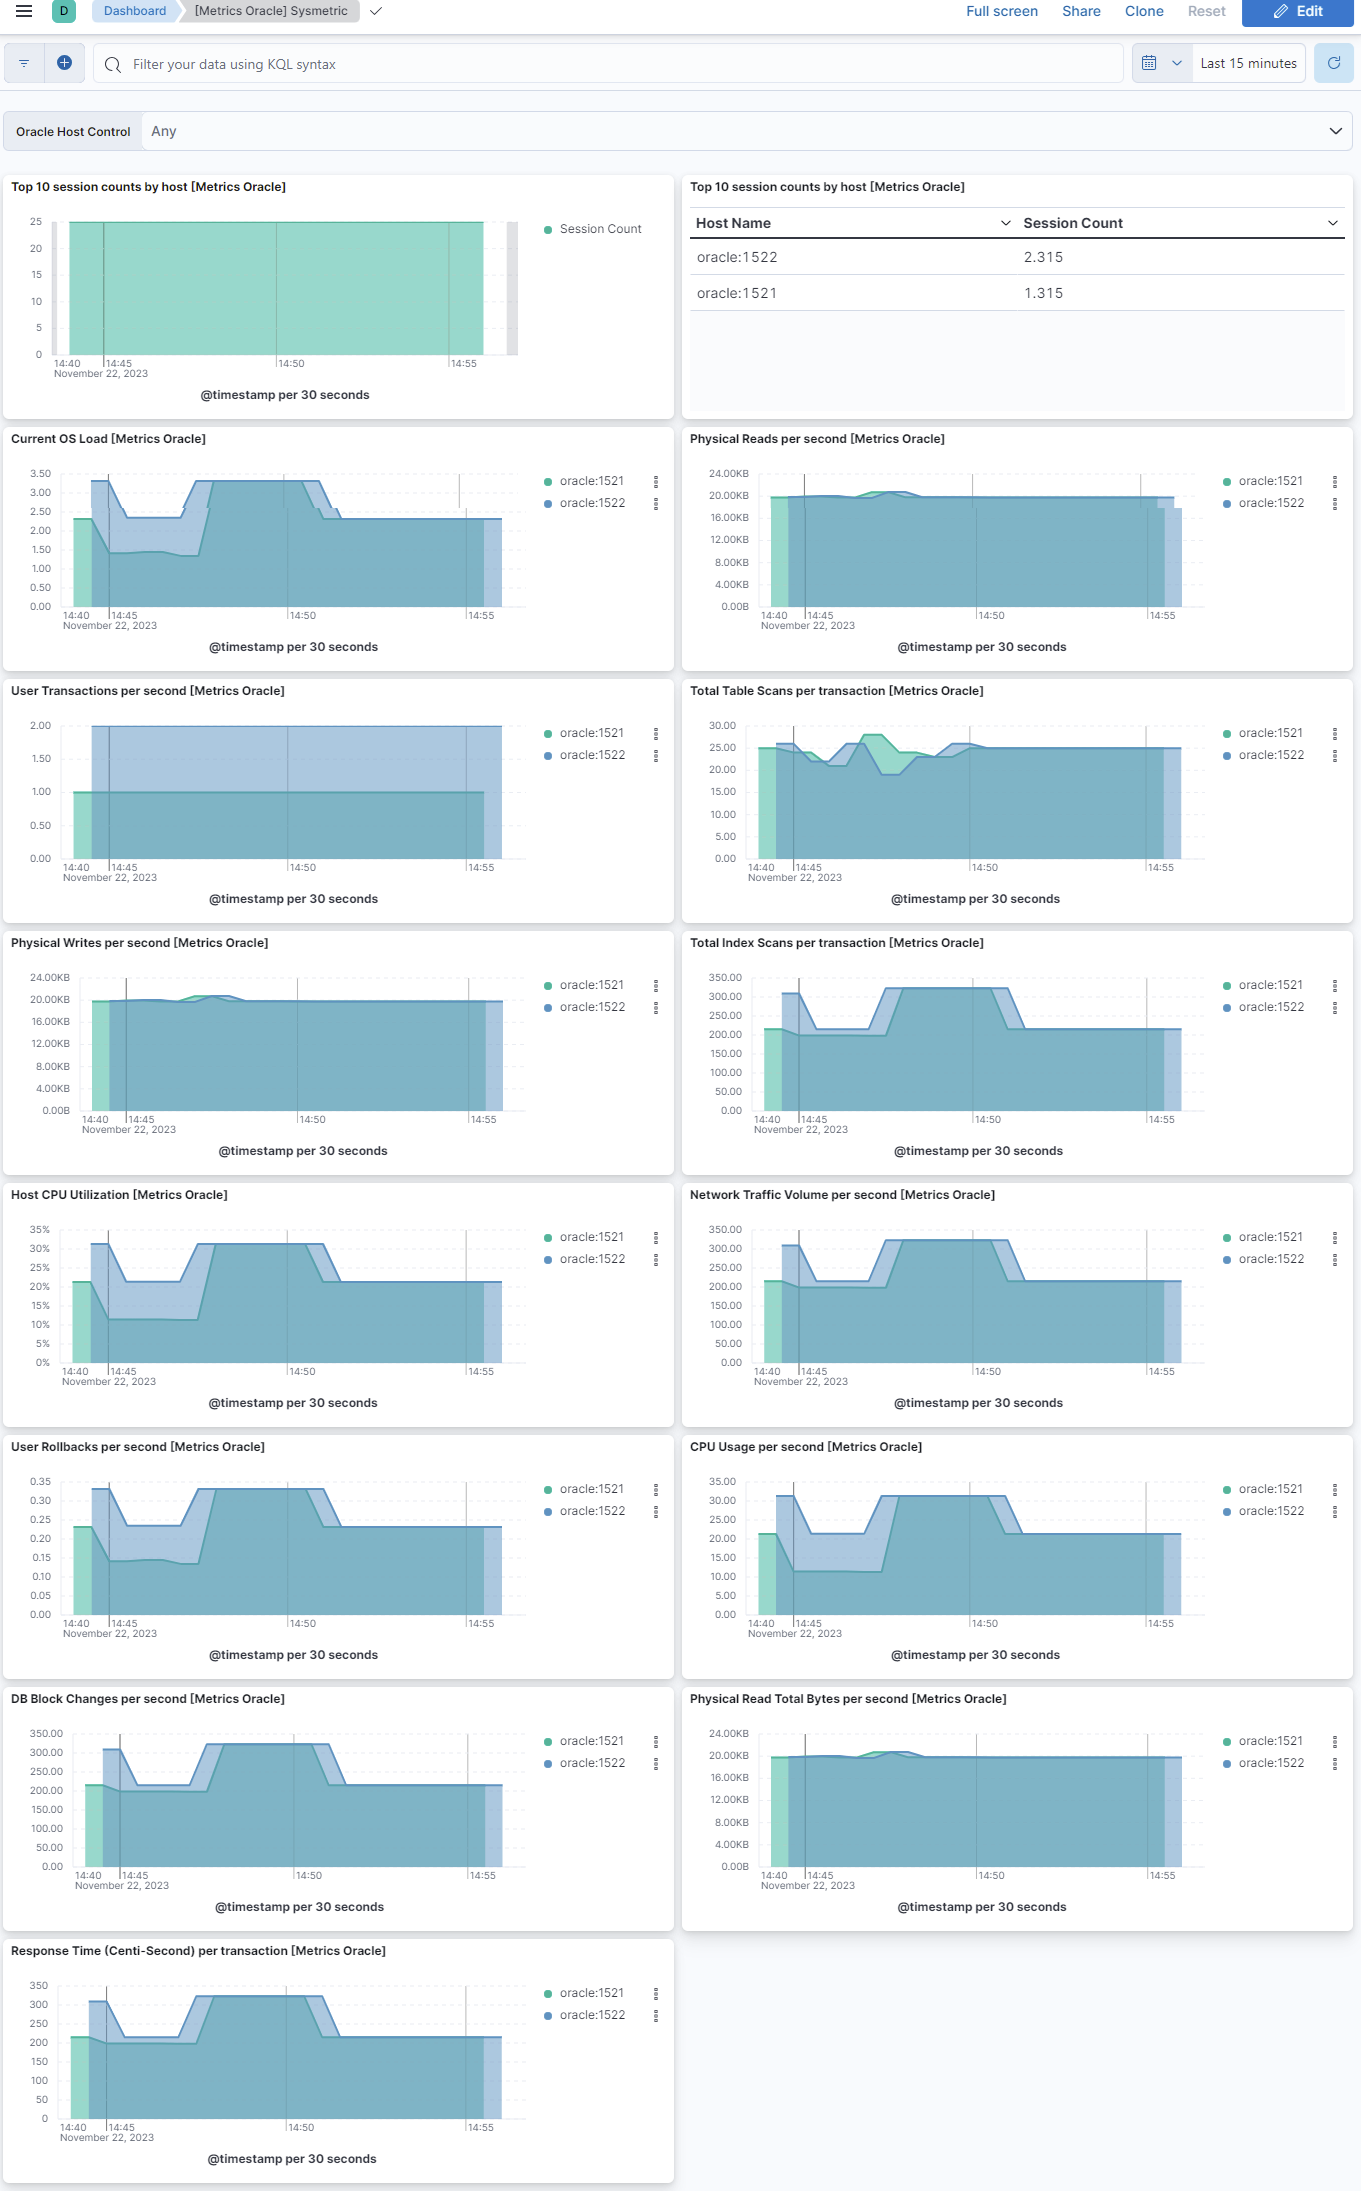
Changelog
| Version | Details | Minimum Kibana version |
|---|---|---|
| 1.31.4 | Bug fix (View pull request) Convert multi-line double-quoted SQL queries to single-line format. |
9.0.0 8.13.0 |
| 1.31.3 | Enhancement (View pull request) Update the Oracle Integration documentation regarding tablespace permissions. |
9.0.0 8.13.0 |
| 1.31.2 | Bug fix (View pull request) Stabilize system tests by requiring multiple consecutive successful probes before declaring the Oracle listener ready. |
9.0.0 8.13.0 |
| 1.31.1 | Enhancement (View pull request) Update the Oracle Integration documentation. |
9.0.0 8.13.0 |
| 1.31.0 | Enhancement (View pull request) Allow @custom pipeline access to event.original without setting preserve_original_event. |
9.0.0 8.13.0 |
| 1.30.0 | Enhancement (View pull request) Add a flag fips_compatible to control whether the package is allowed in the ECH FedRAMP High environment. |
9.0.0 8.13.0 |
| 1.29.0 | Enhancement (View pull request) Add support for Kibana 9.0.0. |
9.0.0 8.13.0 |
| 1.28.0 | Enhancement (View pull request) Add extended tablespace metrics. |
8.13.0 |
| 1.27.0 | Enhancement (View pull request) ECS version updated to 8.11.0. Update the kibana constraint to ^8.13.0. Modified the field definitions to remove ECS fields made redundant by the ecs@mappings component template. |
8.13.0 |
| 1.26.1 | Bug fix (View pull request) Fix oracle.tablespace.space.used.bytes logic for tablespace datastream. |
8.12.0 |
| 1.26.0 | Enhancement (View pull request) Enable secret for the password field and add username and password fields. |
8.12.0 |
| 1.25.0 | Enhancement (View pull request) Add global filter on data_stream.dataset to improve performance. |
8.10.2 |
| 1.24.3 | Bug fix (View pull request) README updates regarding mandatory user permission. |
8.10.2 |
| 1.24.2 | Bug fix (View pull request) README updates regarding DSN formats. |
8.10.2 |
| 1.24.1 | Enhancement (View pull request) Make Oracle DSN configuration details more discoverable. |
8.10.2 |
| 1.24.0 | Enhancement (View pull request) Document alternate method of adding runtime library path. |
8.10.2 |
| 1.23.0 | Enhancement (View pull request) Add custom number formatting to visualizations. |
8.10.2 |
| 1.22.0 | Enhancement (View pull request) Update the package format_version to 3.0.0. |
8.8.0 |
| 1.21.0 | Enhancement (View pull request) Adapt fields for changes in file system info |
8.8.0 |
| 1.20.2 | Bug fix (View pull request) Add null check and ignore_missing check to the rename processor |
8.8.0 |
| 1.20.1 | Bug fix (View pull request) Resolved ORA-01476 error in Performance datastream. |
8.8.0 |
| 1.20.0 | Enhancement (View pull request) Add support for processors |
8.8.0 |
| 1.19.0 | Enhancement (View pull request) Enable time series data streams for the metrics datasets. This dramatically reduces storage for metrics and is expected to progressively improve query performance. For more details, see https://www.elastic.co/guide/en/elasticsearch/reference/current/tsds.html. |
8.8.0 |
| 1.18.0 | Enhancement (View pull request) Rename ownership from obs-service-integrations to obs-infraobs-integrations |
8.6.0 |
| 1.17.2 | Bug fix (View pull request) Fixed dimension fields for all datastreams. |
8.6.0 |
| 1.17.1 | Bug fix (View pull request) Fix aggregation of Performance data stream visualization. |
8.6.0 |
| 1.17.0 | Enhancement (View pull request) Migrate Overview dashboard visualizations to lens |
8.6.0 |
| 1.16.0 | Enhancement (View pull request) Migrate Performance dashboard visualizations to lens |
— |
| 1.15.0 | Enhancement (View pull request) Migrate System Statistics dashboard visualizations to lens |
— |
| 1.14.0 | Enhancement (View pull request) Migrate Tablespace dashboard visualizations to lens |
— |
| 1.13.0 | Enhancement (View pull request) Migrate Memory dashboard visualizations to lens |
— |
| 1.12.0 | Enhancement (View pull request) Migrate Sysmetric dashboard visualizations to lens |
— |
| 1.11.2 | Enhancement (View pull request) Updated dimension field mapping for all datastream. |
8.3.0 |
| 1.11.1 | Enhancement (View pull request) Added categories and/or subcategories. |
8.3.0 |
| 1.11.0 | Enhancement (View pull request) Add dimension fields to all dataset to support TSDB enablement. |
8.3.0 |
| 1.10.1 | Bug fix (View pull request) Dashboard fixes to represent Parse Count and Cache Hit Percentage Value" |
8.3.0 |
| 1.10.0 | Enhancement (View pull request) Update package to ECS 8.6.0. |
8.3.0 |
| 1.9.2 | Enhancement (View pull request) Included the details of supported host configurations in README. |
8.3.0 |
| 1.9.1 | Enhancement (View pull request) Added system testing files. |
8.3.0 |
| 1.9.0 | Enhancement (View pull request) Added infrastructure category. |
8.3.0 |
| 1.8.0 | Enhancement (View pull request) Update package to ECS 8.5.0. |
8.3.0 |
| 1.7.0 | Enhancement (View pull request) Added support for additional database audit events that only include actions. |
8.3.0 |
| 1.6.0 | Enhancement (View pull request) Added support for database audit events, originally it was only supporting objects. |
8.3.0 |
| 1.5.0 | Bug fix (View pull request) Add support for specially crafted action lines. |
8.3.0 |
| 1.4.2 | Bug fix (View pull request) Pipeline issue fixes in Performance datastream. |
8.3.0 |
| 1.4.1 | Bug fix (View pull request) Remove duplicate field. |
8.3.0 |
| 1.4.0 | Enhancement (View pull request) Enhancement to capture system statistics metrics, pga metrics, sga metrics. |
8.3.0 |
| 1.3.0 | Enhancement (View pull request) Update package to ECS 8.4.0 |
8.3.0 |
| 1.2.0 | Enhancement (View pull request) Enhancement to capture performance, tablespace and sysmetrics metric data for Oracle database |
8.3.0 |
| 1.1.1 | Enhancement (View pull request) Update package name and description to align with standard wording |
8.0.0 7.17.0 |
| 1.1.0 | Enhancement (View pull request) Update package to ECS 8.3.0. |
8.0.0 7.17.0 |
| 1.0.2 | Bug fix (View pull request) Supporting the double digit date parsing in ingest pipeline for oracle logs |
8.0.0 7.17.0 |
| 1.0.1 | Enhancement (View pull request) Add documentation for multi-fields |
8.0.0 7.17.0 |
| 1.0.0 | Enhancement (View pull request) Initial Release |
8.0.0 7.17.0 |