Claude Code
Elastic Cloud Serverless projects are autoscaled environments, fully managed by Elastic and available on Elastic Cloud. Availability This functionality is in technical preview and is ready for evaluation. Use with caution in production; it is not recommended for mission-critical workloads. Elastic will work to fix any issues, but features in technical preview are not subject to the support SLA of official GA features. Specific Support terms apply. Elastic Cloud Serverless projects are autoscaled environments, fully managed by Elastic and available on Elastic Cloud. Availability This functionality is in technical preview and is ready for evaluation. Use with caution in production; it is not recommended for mission-critical workloads. Elastic will work to fix any issues, but features in technical preview are not subject to the support SLA of official GA features. Specific Support terms apply. The Elastic Stack includes Elastic's core products such as Elasticsearch, Kibana, Logstash, and Beats. Availability This functionality is in technical preview and is ready for evaluation. Use with caution in production; it is not recommended for mission-critical workloads. Elastic will work to fix any issues, but features in technical preview are not subject to the support SLA of official GA features. Specific Support terms apply. Unless stated otherwise on the page, this functionality is available when your Elastic Stack is deployed on Elastic Cloud Hosted, Elastic Cloud Enterprise, Elastic Cloud on Kubernetes, and self-managed environments. This documentation corresponds to the latest patch available for each minor version. If you're not using the latest patch, check the release notes for changes.
Serverless Observability
Preview
Preview
Serverless Security
Preview
Preview
Stack
Preview
9.4+
Preview since 9.4
| Version | 0.3.0 Availability Preview This functionality is in technical preview and is ready for evaluation. Use with caution in production; it is not recommended for mission-critical workloads. Elastic will work to fix any issues, but features in technical preview are not subject to the support SLA of official GA features. Specific Support terms apply. (View all) |
| Subscription level What's this? |
Basic |
| Developed by What's this? |
Elastic |
| Minimum Kibana version(s) | 9.4.0 |
To use pre-release integrations, go to the Integrations page in Kibana, scroll down, and toggle on the Display beta integrations option.
The Claude Code integration collects OpenTelemetry log events and traces emitted by Anthropic Claude Code, the AI coding agent. It provides typed field mappings, ingest pipelines for structured queries, security-focused dashboards for tool invocation auditing, cost monitoring, and permission analysis, and a traces overview dashboard for LLM usage, latency, and tool activity.
Claude Code exports telemetry as OTLP (OpenTelemetry Protocol) logs and, optionally, traces. Each log event represents an action in an agentic session: tool calls (shell commands, file operations, MCP tool invocations), API requests, user prompts, permission decisions, and lifecycle events. Trace spans connect interactions, LLM requests, and tool calls into one trace per user turn. Trace export is in beta.
This integration requires Claude Code CLI version 2.1.0 or later, which supports OTLP log export. Traces require version 2.1.101 or later. Earlier versions emit beta trace spans but don't apply the verbosity gates to them, so spans can include prompts and tool content even when the gates are off.
Claude Code emits structured OTLP log records during agentic sessions. Each record carries an event name attribute identifying its type (mapped to event.action in ECS), along with event-specific attributes namespaced under claude_code.*. The Elastic Agent receives these events via its built-in OTLP HTTP receiver, applies an ingest pipeline that parses JSON-encoded tool parameters, extracts security-relevant fields, and categorizes events using ECS. The processed events are indexed into the logs-claude_code.events.otel-* data stream.
Trace spans are indexed into the traces-claude_code.otel-* data stream. Span attributes stay under attributes and use Elastic's native OTel mappings. The traces ingest pipeline adds ECS categorization based on span.type.
| Data stream | Description |
|---|---|
events |
All Claude Code OTLP log events — tool executions, API requests, permission decisions, MCP connections, hooks, plugins, and session lifecycle. |
traces (beta) |
Claude Code OTLP trace spans — interactions, LLM requests, and tool calls. |
The integration processes these event types:
| Event | Description | ECS category |
|---|---|---|
tool_result |
Tool execution outcome (success/failure, duration, parameters). | process |
tool_decision |
Permission decision for a tool call (accept/reject, source). | iam |
api_request |
API call to Anthropic (model, cost, tokens, duration). | api |
user_prompt |
User prompt submission (length, command, optionally text). | — |
api_error |
API request failure (error, status code, retry attempt). | api |
api_refusal |
Content safety refusal from the model. | api |
permission_mode_changed |
Permission mode change (from/to mode, trigger). | configuration |
mcp_server_connection |
MCP server connection attempt (status, transport type). | network |
hook_registered |
Hook registration (name, event type, matcher). | configuration |
hook_execution_start |
Hook execution start. | process |
hook_execution_complete |
Hook execution result (success/failure counts, duration). | process |
plugin_loaded |
Plugin loaded (name, scope, paths). | library |
skill_activated |
Skill activation (name, source, trigger). | — |
And these span types:
span.type |
Description | ECS category |
|---|---|---|
interaction |
Root span for one user turn. | session |
llm_request |
A model request (tokens, latency, stop reason). | api |
tool |
A tool invocation within an interaction. | process |
Claude Code also emits other span types (for example hook, and nested tool.blocked_on_user/tool.execution spans). These are indexed into the traces data stream but aren't ECS-categorized by the ingest pipeline.
- An Elastic deployment running version 9.4.0 or later.
- Claude Code CLI with telemetry enabled (
CLAUDE_CODE_ENABLE_TELEMETRY=1). - For traces:
CLAUDE_CODE_ENHANCED_TELEMETRY_BETA=1.
Claude Code has four environment variables that control how much detail is included in log events and spans:
| Variable | What it enables | Default |
|---|---|---|
OTEL_LOG_USER_PROMPTS |
Include the prompt text in user_prompt events and spans. |
Off |
OTEL_LOG_TOOL_DETAILS |
Include tool_parameters and tool_input in tool events and spans. |
Off |
OTEL_LOG_TOOL_CONTENT |
Include tool_result content in tool events and spans. |
Off |
OTEL_LOG_RAW_API_BODIES |
Include raw API request/response bodies. | Off |
Enabling these gates provides richer forensic data but indexes potentially sensitive content (commands, file contents, prompts). When a gate is disabled, the corresponding fields are absent from the document — the pipeline handles this gracefully.
Organizations can enforce telemetry and verbosity gates fleet-wide via MDM profiles or the admin console. Managed settings cannot be overridden by user environment variables. This ensures telemetry cannot be silently redirected or disabled on managed devices.
For general instructions on installing integrations and deploying Elastic Agent, refer to the Getting started guide.
Prerequisites: Install this integration in Fleet before sending data. The installation creates the ingest pipelines, field mappings, and dashboards required for processing Claude Code events and spans.
Claude Code exports telemetry via OTLP. There are three deployment paths.
If your Elastic Cloud deployment supports managed OTLP ingestion, point Claude Code directly at the Elastic Cloud OTLP endpoint, no agent or collector infrastructure required. Configure the environment:
export CLAUDE_CODE_ENABLE_TELEMETRY=1
export CLAUDE_CODE_ENHANCED_TELEMETRY_BETA=1
export OTEL_LOGS_EXPORTER=otlp
export OTEL_TRACES_EXPORTER=otlp
export OTEL_EXPORTER_OTLP_PROTOCOL=http/protobuf
export OTEL_EXPORTER_OTLP_ENDPOINT="<your-elastic-cloud-otlp-endpoint>"
export OTEL_EXPORTER_OTLP_HEADERS="Authorization=ApiKey <your-api-key>"
export OTEL_RESOURCE_ATTRIBUTES="data_stream.dataset=claude_code.events.otel"
OTEL_RESOURCE_ATTRIBUTES applies to both logs and traces, so spans also arrive with the events dataset, in traces-claude_code.events.otel-*. Run the following in Kibana Dev Tools to reroute them to traces-claude_code.otel-*. The same pipeline handles Claude Code Desktop spans, which land in traces-generic.otel-* (see Claude Code Desktop traces).
PUT _ingest/pipeline/traces-claude-code-reroute{ "processors": [ { "reroute": { "if": "['claude-code', 'claude-code-desktop'].contains(ctx.resource?.attributes?.get('service.name'))", "dataset": "claude_code.otel", "namespace": ["{{data_stream.namespace}}", "default"] } } ] }PUT _index_template/traces-claude-code-reroute{ "index_patterns": ["traces-claude_code.events.otel-*", "traces-generic.otel-*"], "priority": 150, "composed_of": ["traces@mappings", "traces@settings", "otel@mappings", "otel@settings", "traces-otel@mappings", "semconv-resource-to-ecs@mappings", "traces@custom", "traces-otel@custom", "ecs@mappings"], "ignore_missing_component_templates": ["traces@custom", "traces-otel@custom"], "template": { "settings": { "index.default_pipeline": "traces-claude-code-reroute" }, "mappings": { "properties": { "data_stream.type": { "type": "constant_keyword", "value": "traces" } } } }, "data_stream": { "hidden": false, "allow_custom_routing": false }, "allow_auto_create": true }
If either data stream already exists, roll it over so it picks up the new template, for example POST traces-generic.otel-default/_rollover. Run a rollover for each namespace you use.
The Elastic Agent exposes an OTLP HTTP receiver for each data stream on its configured HTTP endpoint (default port: 4318 for events, 4320 for traces). Configure Claude Code to send events and spans to the agent:
export CLAUDE_CODE_ENABLE_TELEMETRY=1
export CLAUDE_CODE_ENHANCED_TELEMETRY_BETA=1
export OTEL_LOGS_EXPORTER=otlp
export OTEL_TRACES_EXPORTER=otlp
export OTEL_EXPORTER_OTLP_PROTOCOL=http/protobuf
export OTEL_EXPORTER_OTLP_LOGS_ENDPOINT="http://<agent-host>:4318/v1/logs"
export OTEL_EXPORTER_OTLP_TRACES_ENDPOINT="http://<agent-host>:4320/v1/traces"
export OTEL_RESOURCE_ATTRIBUTES="data_stream.dataset=claude_code.events.otel"
Run the Elastic Distribution of the OpenTelemetry Collector as a gateway for your Claude Code clients. The collector sets the dataset for each signal, so Claude Code doesn't need OTEL_RESOURCE_ATTRIBUTES or auth headers. Configure Claude Code to send events and spans to the collector:
export CLAUDE_CODE_ENABLE_TELEMETRY=1
export CLAUDE_CODE_ENHANCED_TELEMETRY_BETA=1
export OTEL_LOGS_EXPORTER=otlp
export OTEL_TRACES_EXPORTER=otlp
export OTEL_EXPORTER_OTLP_PROTOCOL=http/protobuf
export OTEL_EXPORTER_OTLP_ENDPOINT="http://<collector-host>:4318"
Example collector configuration:
receivers:
  otlp:
    protocols:
      grpc:
        endpoint: 0.0.0.0:4317
      http:
        endpoint: 0.0.0.0:4318

connectors:
  elasticapm:

processors:
  elasticapm:
  transform/claude_code_logs:
    log_statements:
      - context: log
        statements:
          - set(attributes["data_stream.dataset"], "claude_code.events")
  transform/claude_code_traces:
    trace_statements:
      - context: span
        statements:
          - set(attributes["data_stream.dataset"], "claude_code")
      - context: spanevent
        statements:
          - set(attributes["data_stream.dataset"], "claude_code.events")

exporters:
  otlphttp/elasticsearch:
    endpoint: ${env:ELASTIC_ENDPOINT}/_otlp
    headers:
      Authorization: "ApiKey ${env:ELASTIC_API_KEY}"

service:
  pipelines:
    logs:
      receivers: [otlp]
      processors: [transform/claude_code_logs]
      exporters: [otlphttp/elasticsearch]
    traces:
      receivers: [otlp]
      processors: [transform/claude_code_traces, elasticapm]
      exporters: [elasticapm, otlphttp/elasticsearch]
    metrics/aggregated-otel-metrics:
      receivers: [elasticapm]
      processors: []
      exporters: [otlphttp/elasticsearch]
Without the transform processors, data goes to logs-generic.otel-* and traces-generic.otel-*. Elasticsearch adds the .otel suffix to the dataset.
After deploying, run a short Claude Code session with telemetry enabled and confirm events appear in the logs-claude_code.events.otel-* data stream. For example, in Kibana Discover, filter on data_stream.dataset: claude_code.events.otel. For traces, filter on data_stream.dataset: claude_code.otel.
Claude Code Desktop ignores OTEL_RESOURCE_ATTRIBUTES (open issue) and reports resource.attributes.service.name: claude-code-desktop. When Desktop sends traces directly to Elasticsearch, its spans go to traces-generic.otel-*. Option B and Option C set the dataset for you. For Option A, the reroute pipeline in Option A moves Desktop spans to traces-claude_code.otel-* by service.name.
- Verify
CLAUDE_CODE_ENABLE_TELEMETRY=1is set in the environment where Claude Code runs. - Check that the logs OTLP endpoint is reachable from the Claude Code host (
curl -v http://<agent-host>:<port>/v1/logs, where<port>matches the HTTP Endpoint configured in the integration policy, default4318). - Confirm the Elastic Agent is running and the integration policy is assigned.
- Verify
CLAUDE_CODE_ENHANCED_TELEMETRY_BETA=1andOTEL_TRACES_EXPORTER=otlpare set. - Check that the traces endpoint is reachable (
curl -v http://<agent-host>:<port>/v1/traces, default port4320). - For Option A, check
traces-claude_code.events.otel-*andtraces-generic.otel-*. If Claude Code spans are there, confirm the reroute pipeline and template from Option A are installed and that the data streams were rolled over.
Tool parameters, tool input, and prompt text are gated by environment variables (see Verbosity gates). If these fields are absent, enable the relevant gate. On managed devices, these may be controlled by organizational policy and cannot be overridden locally.
Events with event.kind: pipeline_error and a preserve_original_event tag indicate the events ingest pipeline encountered an error (typically malformed JSON in tool_parameters or tool_input). The original event is preserved for inspection. Spans with event.kind: pipeline_error indicate the traces ingest pipeline encountered an error. The failure details are in error.message.
Events — parses JSON-encoded tool parameters and inputs into structured fields for querying:
tool_parameters(JSON string) →tool_parameters_flattened(flattened object)tool_input(JSON string) →tool_input_flattened(flattened object)
It also extracts:
process.command_linefrom Bash toolfull_commandmcp_server_nameandmcp_tool_namefrom MCP tool parametersfile.pathfrom file operation tool parametersurl.fullfrom web tool parameters
Traces — sets event.category and event.type from span.type, related.user from the user attributes, and extracts process.command_line and file.path from tool spans.
Tool invocation auditing — query all Bash commands executed by a user:
claude_code.tool_name: "Bash" AND event.action: "tool_result"
Permission decision analysis — find user_permanent auto-approvals (potential risk signal):
event.action: "tool_decision" AND claude_code.decision_source: "user_permanent"
Cost anomaly detection — aggregate cost_usd per user per day to detect unusual spending patterns.
MCP server access monitoring — track which MCP servers users connect to and which tools they invoke:
event.action: "mcp_server_connection" OR (event.action: "tool_result" AND claude_code.tool_name: "mcp_tool")
Example
{
    "@timestamp": "2026-07-06T03:25:40.439Z",
    "claude_code": {
        "events": {
            "event": {
                "name": "user_prompt",
                "sequence": 0,
                "timestamp": "2026-07-06T03:25:40.439Z"
            },
            "has_hooks": true,
            "has_mcp": true,
            "prompt": {
                "id": "11111111-2222-3333-4444-555555555555"
            },
            "prompt_length": 18,
            "prompt_text": "What is 2 plus 2?",
            "session": {
                "id": "aaaaaaaa-bbbb-cccc-dddd-eeeeeeeeeeee"
            },
            "terminal": {
                "type": "xterm-256color"
            },
            "user": {
                "account_id": "user_01ExampleAccountId00000",
                "account_uuid": "00000000-1111-2222-3333-444444444444"
            }
        }
    },
    "data_stream": {
        "dataset": "claude_code.events.otel",
        "namespace": "55955",
        "type": "logs"
    },
    "ecs": {
        "version": "9.3.0"
    },
    "event": {
        "action": "user_prompt",
        "agent_id_status": "missing",
        "dataset": "claude_code.events.otel",
        "ingested": "2026-07-06T03:25:50Z",
        "kind": "event",
        "original": "{\"observed_timestamp\":\"1783308340439.840708\",\"@timestamp\":\"1783308340439.834018\",\"resource\":{\"attributes\":{\"service.name\":\"claude-code\",\"service.version\":\"2.1.175\",\"host.arch\":\"amd64\",\"os.type\":\"linux\",\"os.version\":\"6.17.0-14-generic\"}},\"data_stream\":{\"namespace\":\"55955\",\"type\":\"logs\",\"dataset\":\"claude_code.events.otel\"},\"scope\":{\"name\":\"com.anthropic.claude_code.events\",\"version\":\"2.1.175\"},\"event_name\":\"user_prompt\",\"attributes\":{\"user.id\":\"a1b2c3d4e5f6a7b8c9d0e1f2a3b4c5d6e7f8a9b0c1d2e3f4a5b6c7d8e9f0a1b2\",\"user.account_uuid\":\"00000000-1111-2222-3333-444444444444\",\"terminal.type\":\"xterm-256color\",\"event.name\":\"user_prompt\",\"event.timestamp\":\"2026-07-06T03:25:40.439819114Z\",\"prompt.id\":\"11111111-2222-3333-4444-555555555555\",\"event.sequence\":0,\"user.email\":\"test@example.com\",\"prompt_length\":18,\"elastic.preserve_original_event\":\"true\",\"organization.id\":\"00000000-0000-0000-0000-000000000001\",\"has_mcp\":\"true\",\"user.account_id\":\"user_01ExampleAccountId00000\",\"prompt\":\"What is 2 plus 2?\",\"session.id\":\"aaaaaaaa-bbbb-cccc-dddd-eeeeeeeeeeee\",\"has_hooks\":\"true\"},\"body\":{\"text\":\"claude_code.user_prompt\"},\"event\":{},\"_version_type\":\"internal\",\"_index\":\"logs-claude_code.events.otel-55955\",\"_id\":null,\"_version\":-4}",
        "outcome": "unknown",
        "provider": "claude-code"
    },
    "gen_ai": {
        "provider": {
            "name": "anthropic"
        }
    },
    "host": {
        "arch": "amd64",
        "architecture": "amd64",
        "os": {
            "platform": "linux",
            "version": "6.17.0-14-generic"
        }
    },
    "observed_timestamp": "2026-07-06T03:25:40.439840708Z",
    "organization": {
        "id": "00000000-0000-0000-0000-000000000001"
    },
    "os": {
        "type": "linux",
        "version": "6.17.0-14-generic"
    },
    "related": {
        "user": [
            "test@example.com",
            "a1b2c3d4e5f6a7b8c9d0e1f2a3b4c5d6e7f8a9b0c1d2e3f4a5b6c7d8e9f0a1b2"
        ]
    },
    "resource": {
        "attributes": {
            "host": {
                "arch": "amd64"
            },
            "os": {
                "type": "linux",
                "version": "6.17.0-14-generic"
            },
            "service": {
                "name": "claude-code",
                "version": "2.1.175"
            }
        }
    },
    "scope": {
        "name": "com.anthropic.claude_code.events",
        "version": "2.1.175"
    },
    "service": {
        "name": "claude-code",
        "version": "2.1.175"
    },
    "tags": "preserve_original_event",
    "user": {
        "email": "test@example.com",
        "id": "a1b2c3d4e5f6a7b8c9d0e1f2a3b4c5d6e7f8a9b0c1d2e3f4a5b6c7d8e9f0a1b2"
    }
}
Exported fields
| Field | Description | Type |
|---|---|---|
| @timestamp | Event timestamp. | date |
| claude_code.events.agent_path_count | Number of agent paths in the plugin. | long |
| claude_code.events.command_name | Slash command name from user_prompt events. | keyword |
| claude_code.events.command_path_count | Number of command paths in the plugin. | long |
| claude_code.events.cost_usd | Cost of the API request in USD. | double |
| claude_code.events.cost_usd_micros | Cost of the API request in millionths of a USD. | long |
| claude_code.events.decision | Permission decision (accept, reject). | keyword |
| claude_code.events.decision_source | Source of the permission decision (config, user_temporary, user_permanent). | keyword |
| claude_code.events.decision_type | Decision type (accept, reject). | keyword |
| claude_code.events.effort | Thinking effort level (high, medium, low). | keyword |
| claude_code.events.enabled_via | How the plugin was enabled (for example user-install). | keyword |
| claude_code.events.error | Error message from a failed operation. | keyword |
| claude_code.events.event.name | Event name from OTel attributes. | keyword |
| claude_code.events.event.sequence | Event sequence number within a prompt turn. | long |
| claude_code.events.event.timestamp | Event timestamp from OTel attributes. | date |
| claude_code.events.from_mode | Permission mode before the change. | keyword |
| claude_code.events.has_hooks | Whether the session has registered hooks. | boolean |
| claude_code.events.has_mcp | Whether the session has MCP servers. | boolean |
| claude_code.events.hook_event | Hook event type (for example SessionStart, PreToolUse). | keyword |
| claude_code.events.hook_matcher | Pattern the hook matches against (for example Bash). | keyword |
| claude_code.events.hook_name | Name of the registered hook. | keyword |
| claude_code.events.hook_source | Source of the hook definition (for example settings.json). | keyword |
| claude_code.events.hook_type | Hook type (for example command). | keyword |
| claude_code.events.host_owned_mcp | Whether MCP servers are host-owned ("true" or "false"). | boolean |
| claude_code.events.invocation_trigger | How the skill was invoked (for example user-slash). | keyword |
| claude_code.events.is_plugin | Whether the MCP server is a plugin. | boolean |
| claude_code.events.managed_only | Whether the MCP server is managed-only ("true" or "false"). | keyword |
| claude_code.events.marketplace.name | Name of the marketplace entry. | keyword |
| claude_code.events.mcp_server_name | Name of the MCP server. Extracted from tool_parameters_flattened by the ingest pipeline. | keyword |
| claude_code.events.mcp_server_scope | MCP server scope from tool_parameters. | keyword |
| claude_code.events.num_blocking | Number of hooks that blocked execution. | long |
| claude_code.events.num_cancelled | Number of hooks that were cancelled. | long |
| claude_code.events.num_hooks | Number of hooks registered for this event. | long |
| claude_code.events.num_non_blocking_error | Number of hooks that failed without blocking. | long |
| claude_code.events.num_success | Number of hooks that completed successfully. | long |
| claude_code.events.plugin.name | Plugin name. | keyword |
| claude_code.events.plugin.scope | Plugin scope (for example project, user). | keyword |
| claude_code.events.plugin.version | Plugin version. | keyword |
| claude_code.events.plugin_id_hash | Hash of the plugin identifier. | keyword |
| claude_code.events.prompt.id | Prompt turn identifier within a session. | keyword |
| claude_code.events.prompt_length | Length of the user prompt in characters. | long |
| claude_code.events.prompt_text | User prompt text. Only present when OTEL_LOG_USER_PROMPTS is enabled. Renamed from OTel attribute 'prompt' to avoid conflict with prompt.id path. | text |
| claude_code.events.safe_mode | Whether safe mode is active ("true" or "false"). | keyword |
| claude_code.events.server_name | MCP server name from connection events. | keyword |
| claude_code.events.server_scope | MCP server scope (for example project, user). | keyword |
| claude_code.events.session.id | Claude Code session identifier. | keyword |
| claude_code.events.skill.name | Activated skill name. | keyword |
| claude_code.events.skill.source | Source of the skill definition. | keyword |
| claude_code.events.skill_path_count | Number of skill paths in the plugin. | long |
| claude_code.events.source | Source of the event (for example user, system). | keyword |
| claude_code.events.speed | Request speed tier (normal, fast). | keyword |
| claude_code.events.status | Connection status (for example connected, failed). | keyword |
| claude_code.events.success | Whether the tool call succeeded ("true" or "false"). | keyword |
| claude_code.events.terminal.type | Terminal emulator type or "non-interactive" for Cowork. | keyword |
| claude_code.events.to_mode | Permission mode after the change. | keyword |
| claude_code.events.tool_input | JSON-encoded tool input. Only present when OTEL_LOG_TOOL_DETAILS is enabled. | text |
| claude_code.events.tool_input_size_bytes | Size of tool input in bytes. | long |
| claude_code.events.tool_parameters | JSON-encoded tool parameters. Only present when OTEL_LOG_TOOL_DETAILS is enabled. | text |
| claude_code.events.tool_parameters_flattened | Parsed tool_parameters as a flattened object for structured queries. Populated by the ingest pipeline. | flattened |
| claude_code.events.tool_result_size_bytes | Size of tool result in bytes. | long |
| claude_code.events.total_duration_ms | Total duration of all hook executions in milliseconds. | long |
| claude_code.events.transport_type | MCP transport type (for example stdio, sse). | keyword |
| claude_code.events.trigger | What triggered the permission mode change. | keyword |
| claude_code.events.user.account_id | Anthropic account identifier. | keyword |
| claude_code.events.user.account_uuid | Anthropic account UUID. | keyword |
| data_stream.dataset | Data stream dataset. | constant_keyword |
| data_stream.namespace | Data stream namespace. | constant_keyword |
| data_stream.type | Data stream type. | constant_keyword |
| ecs.version | ECS version this event conforms to. ecs.version is a required field and must exist in all events. When querying across multiple indices -- which may conform to slightly different ECS versions -- this field lets integrations adjust to the schema version of the events. |
keyword |
| error.code | Error code describing the error. | keyword |
| error.message | Error message. | match_only_text |
| error.type | The type of the error, for example the class name of the exception. | keyword |
| event.action | The action captured by the event. This describes the information in the event. It is more specific than event.category. Examples are group-add, process-started, file-created. The value is normally defined by the implementer. |
keyword |
| event.category | This is one of four ECS Categorization Fields, and indicates the second level in the ECS category hierarchy. event.category represents the "big buckets" of ECS categories. For example, filtering on event.category:process yields all events relating to process activity. This field is closely related to event.type, which is used as a subcategory. This field is an array. This will allow proper categorization of some events that fall in multiple categories. |
keyword |
| event.duration | Duration of the event in nanoseconds. If event.start and event.end are known this value should be the difference between the end and start time. |
long |
| event.kind | This is one of four ECS Categorization Fields, and indicates the highest level in the ECS category hierarchy. event.kind gives high-level information about what type of information the event contains, without being specific to the contents of the event. For example, values of this field distinguish alert events from metric events. The value of this field can be used to inform how these kinds of events should be handled. They may warrant different retention, different access control, it may also help understand whether the data is coming in at a regular interval or not. |
keyword |
| event.original | Raw text message of entire event. Used to demonstrate log integrity or where the full log message (before splitting it up in multiple parts) may be required, e.g. for reindex. This field is not indexed and doc_values are disabled. It cannot be searched, but it can be retrieved from _source. If users wish to override this and index this field, please see Field data types in the Elasticsearch Reference. |
keyword |
| event.outcome | This is one of four ECS Categorization Fields, and indicates the lowest level in the ECS category hierarchy. event.outcome simply denotes whether the event represents a success or a failure from the perspective of the entity that produced the event. Note that when a single transaction is described in multiple events, each event may populate different values of event.outcome, according to their perspective. Also note that in the case of a compound event (a single event that contains multiple logical events), this field should be populated with the value that best captures the overall success or failure from the perspective of the event producer. Further note that not all events will have an associated outcome. For example, this field is generally not populated for metric events, events with event.type:info, or any events for which an outcome does not make logical sense. |
keyword |
| event.provider | Source of the event. Event transports such as Syslog or the Windows Event Log typically mention the source of an event. It can be the name of the software that generated the event (e.g. Sysmon, httpd), or of a subsystem of the operating system (kernel, Microsoft-Windows-Security-Auditing). | keyword |
| event.reason | Reason why this event happened, according to the source. This describes the why of a particular action or outcome captured in the event. Where event.action captures the action from the event, event.reason describes why that action was taken. For example, a web proxy with an event.action which denied the request may also populate event.reason with the reason why (e.g. blocked site). |
keyword |
| event.sequence | Sequence number of the event. The sequence number is a value published by some event sources, to make the exact ordering of events unambiguous, regardless of the timestamp precision. | long |
| event.type | This is one of four ECS Categorization Fields, and indicates the third level in the ECS category hierarchy. event.type represents a categorization "sub-bucket" that, when used along with the event.category field values, enables filtering events down to a level appropriate for single visualization. This field is an array. This will allow proper categorization of some events that fall in multiple event types. |
keyword |
| file.path | Full path to the file, including the file name. It should include the drive letter, when appropriate. | keyword |
| file.path.text | Multi-field of file.path. |
match_only_text |
| gen_ai.operation.name | Source or type of the generative AI operation. | keyword |
| gen_ai.provider.name | Generative AI provider name. | constant_keyword |
| gen_ai.request.model | Model used for the generative AI request. | keyword |
| gen_ai.response.id | Identifier for the generative AI response. | keyword |
| gen_ai.response.model | Model that generated the response. | keyword |
| gen_ai.tool.call.arguments | Arguments passed to the tool call. | flattened |
| gen_ai.tool.call.id | Unique identifier for the tool call. | keyword |
| gen_ai.tool.name | Name of the tool invoked by the model. | keyword |
| gen_ai.usage.cache_creation.input_tokens | Number of input tokens used for cache creation. | long |
| gen_ai.usage.cache_read.input_tokens | Number of input tokens served from cache. | long |
| gen_ai.usage.input_tokens | Number of input tokens consumed. | long |
| gen_ai.usage.output_tokens | Number of output tokens generated. | long |
| organization.id | Unique identifier for the organization. | keyword |
| process.command_line | Full command line that started the process, including the absolute path to the executable, and all arguments. Some arguments may be filtered to protect sensitive information. | wildcard |
| process.command_line.text | Multi-field of process.command_line. |
match_only_text |
| related.user | All the user names or other user identifiers seen on the event. | keyword |
| tags | List of keywords used to tag each event. | keyword |
| url.full | If full URLs are important to your use case, they should be stored in url.full, whether this field is reconstructed or present in the event source. |
wildcard |
| url.full.text | Multi-field of url.full. |
match_only_text |
| user.email | User email address. | keyword |
| user.id | Unique identifier of the user. | keyword |
Example
{
    "@timestamp": "2026-10-07T17:19:12.905Z",
    "attributes": {
        "interaction": {
            "duration_ms": 12545,
            "sequence": 1
        },
        "organization": {
            "id": "00000000-0000-0000-0000-000000000001"
        },
        "parent": {
            "source": "none"
        },
        "queued_sends": 0,
        "session": {
            "id": "aaaaaaaa-bbbb-cccc-dddd-eeeeeeeeeeee"
        },
        "span": {
            "type": "interaction"
        },
        "terminal": {
            "type": "xterm-256color"
        },
        "user": {
            "account_id": "user_01ExampleAccountId00000",
            "account_uuid": "00000000-1111-2222-3333-444444444444",
            "email": "test@example.com",
            "id": "a1b2c3d4e5f6a7b8c9d0e1f2a3b4c5d6e7f8a9b0c1d2e3f4a5b6c7d8e9f0a1b2"
        },
        "user_prompt_length": 17
    },
    "data_stream": {
        "dataset": "claude_code.otel",
        "namespace": "44902",
        "type": "traces"
    },
    "duration": 12545000000,
    "ecs": {
        "version": "9.3.0"
    },
    "event": {
        "agent_id_status": "missing",
        "category": [
            "session"
        ],
        "dataset": "claude_code.otel",
        "ingested": "2026-10-07T17:19:35Z",
        "kind": "event",
        "type": [
            "info"
        ]
    },
    "host": {
        "arch": "amd64",
        "architecture": "amd64",
        "os": {
            "platform": "linux",
            "version": "6.17.0-14-generic"
        }
    },
    "interaction": {
        "duration_ms": 12545,
        "sequence": 1
    },
    "kind": "Internal",
    "name": "claude_code.interaction",
    "organization": {
        "id": "00000000-0000-0000-0000-000000000001"
    },
    "os": {
        "type": "linux",
        "version": "6.17.0-14-generic"
    },
    "parent": {
        "source": "none"
    },
    "queued_sends": 0,
    "related": {
        "user": [
            "test@example.com",
            "a1b2c3d4e5f6a7b8c9d0e1f2a3b4c5d6e7f8a9b0c1d2e3f4a5b6c7d8e9f0a1b2"
        ]
    },
    "resource": {
        "attributes": {
            "host": {
                "arch": "amd64"
            },
            "os": {
                "type": "linux",
                "version": "6.17.0-14-generic"
            },
            "service": {
                "name": "claude-code",
                "version": "2.1.175"
            }
        }
    },
    "scope": {
        "name": "com.anthropic.claude_code.tracing",
        "version": "1.0.0"
    },
    "service": {
        "name": "claude-code",
        "version": "2.1.175"
    },
    "session": {
        "id": "aaaaaaaa-bbbb-cccc-dddd-eeeeeeeeeeee"
    },
    "span": {
        "id": "4a33403362f74185",
        "name": "claude_code.interaction",
        "type": "interaction"
    },
    "span_id": "4a33403362f74185",
    "terminal": {
        "type": "xterm-256color"
    },
    "trace": {
        "id": "84487adcee70a28b25f95b793b93b3fc"
    },
    "trace_id": "84487adcee70a28b25f95b793b93b3fc",
    "user": {
        "account_id": "user_01ExampleAccountId00000",
        "account_uuid": "00000000-1111-2222-3333-444444444444",
        "email": "test@example.com",
        "id": "a1b2c3d4e5f6a7b8c9d0e1f2a3b4c5d6e7f8a9b0c1d2e3f4a5b6c7d8e9f0a1b2"
    },
    "user_prompt_length": 17
}
Exported fields
| Field | Description | Type |
|---|---|---|
| @timestamp | Date/time when the event originated. This is the date/time extracted from the event, typically representing when the event was generated by the source. If the event source has no original timestamp, this value is typically populated by the first time the event was received by the pipeline. Required field for all events. | date |
| data_stream.dataset | The field can contain anything that makes sense to signify the source of the data. Examples include nginx.access, prometheus, endpoint etc. For data streams that otherwise fit, but that do not have dataset set we use the value "generic" for the dataset value. event.dataset should have the same value as data_stream.dataset. Beyond the Elasticsearch data stream naming criteria noted above, the dataset value has additional restrictions: * Must not contain - * No longer than 100 characters |
constant_keyword |
| data_stream.namespace | A user defined namespace. Namespaces are useful to allow grouping of data. Many users already organize their indices this way, and the data stream naming scheme now provides this best practice as a default. Many users will populate this field with default. If no value is used, it falls back to default. Beyond the Elasticsearch index naming criteria noted above, namespace value has the additional restrictions: * Must not contain - * No longer than 100 characters |
constant_keyword |
| data_stream.type | An overarching type for the data stream. Currently allowed values are "logs" and "metrics". We expect to also add "traces" and "synthetics" in the near future. | constant_keyword |
| ecs.version | ECS version this event conforms to. ecs.version is a required field and must exist in all events. When querying across multiple indices -- which may conform to slightly different ECS versions -- this field lets integrations adjust to the schema version of the events. |
keyword |
| error.message | Error message. | match_only_text |
| event.category | This is one of four ECS Categorization Fields, and indicates the second level in the ECS category hierarchy. event.category represents the "big buckets" of ECS categories. For example, filtering on event.category:process yields all events relating to process activity. This field is closely related to event.type, which is used as a subcategory. This field is an array. This will allow proper categorization of some events that fall in multiple categories. |
keyword |
| event.kind | This is one of four ECS Categorization Fields, and indicates the highest level in the ECS category hierarchy. event.kind gives high-level information about what type of information the event contains, without being specific to the contents of the event. For example, values of this field distinguish alert events from metric events. The value of this field can be used to inform how these kinds of events should be handled. They may warrant different retention, different access control, it may also help understand whether the data is coming in at a regular interval or not. |
keyword |
| event.type | This is one of four ECS Categorization Fields, and indicates the third level in the ECS category hierarchy. event.type represents a categorization "sub-bucket" that, when used along with the event.category field values, enables filtering events down to a level appropriate for single visualization. This field is an array. This will allow proper categorization of some events that fall in multiple event types. |
keyword |
| file.path | Full path to the file, including the file name. It should include the drive letter, when appropriate. | keyword |
| file.path.text | Multi-field of file.path. |
match_only_text |
| process.command_line | Full command line that started the process, including the absolute path to the executable, and all arguments. Some arguments may be filtered to protect sensitive information. | wildcard |
| process.command_line.text | Multi-field of process.command_line. |
match_only_text |
| related.user | All the user names or other user identifiers seen on the event. | keyword |
| tags | List of keywords used to tag each event. | keyword |
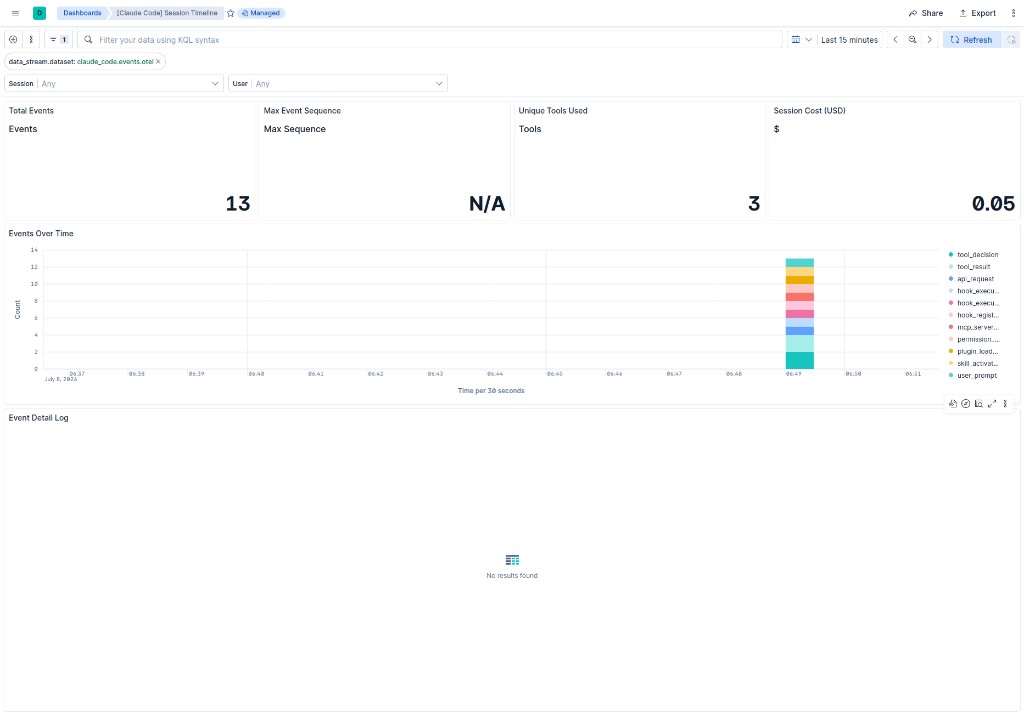
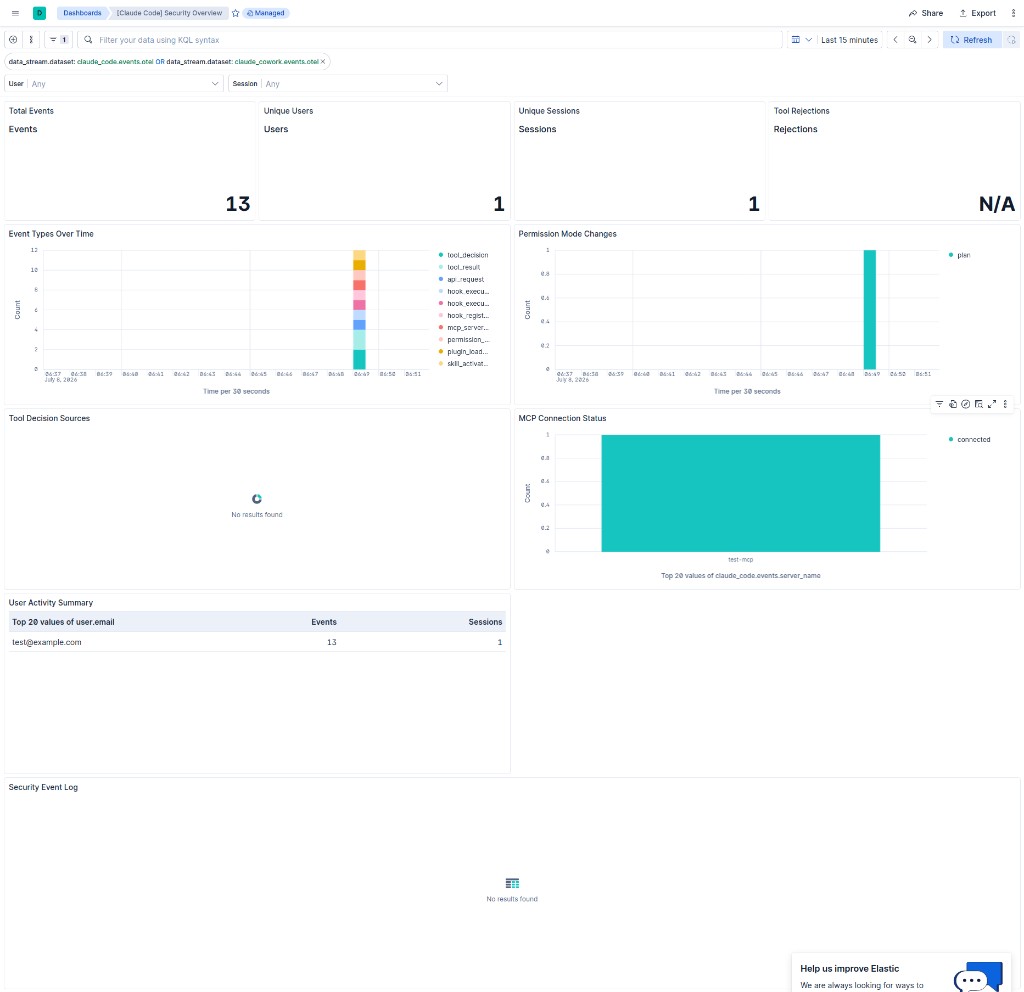
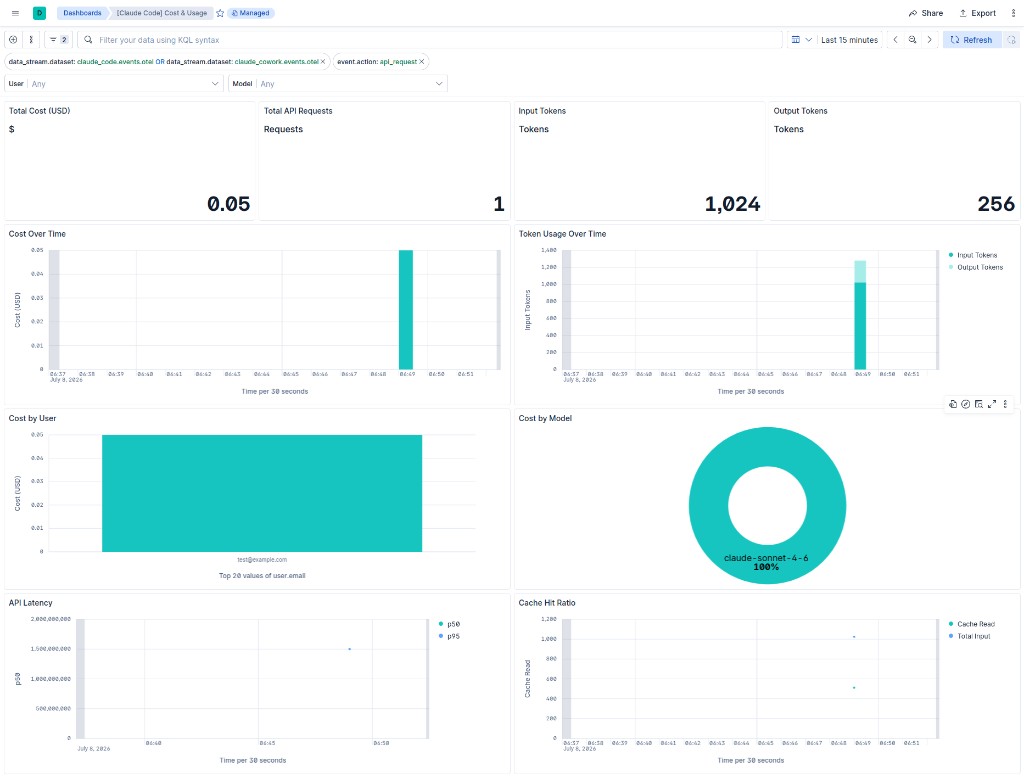
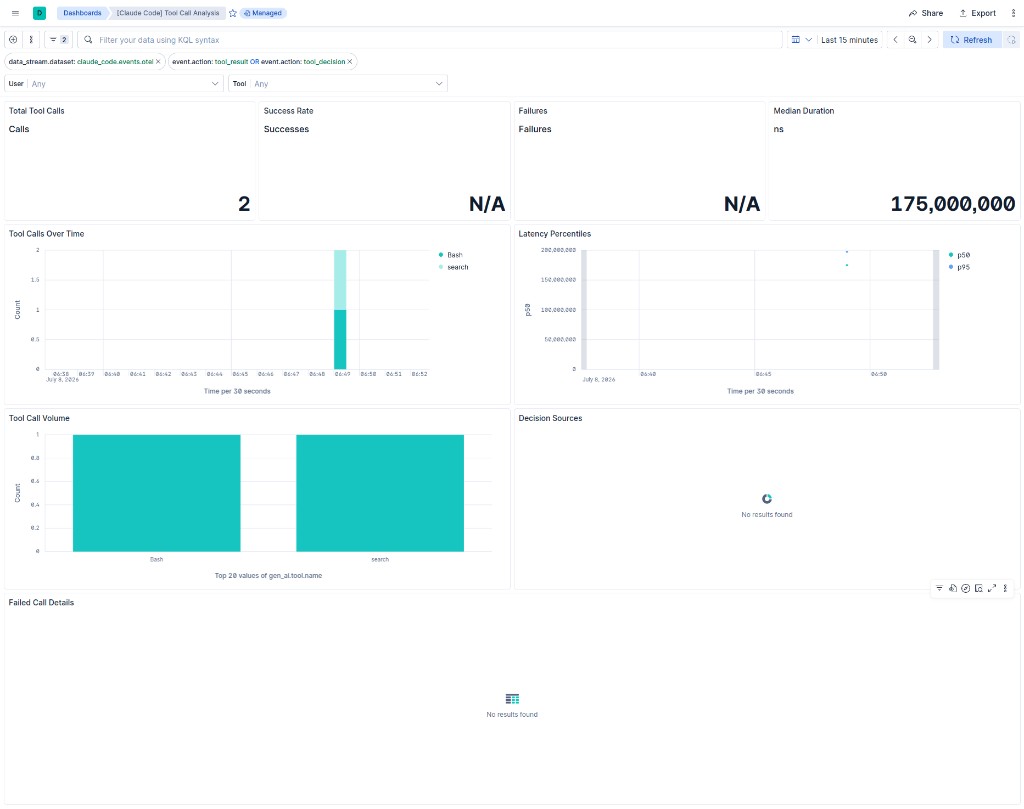
This integration includes one or more Kibana dashboards that visualizes the data collected by the integration. The screenshots below illustrate how the ingested data is displayed.
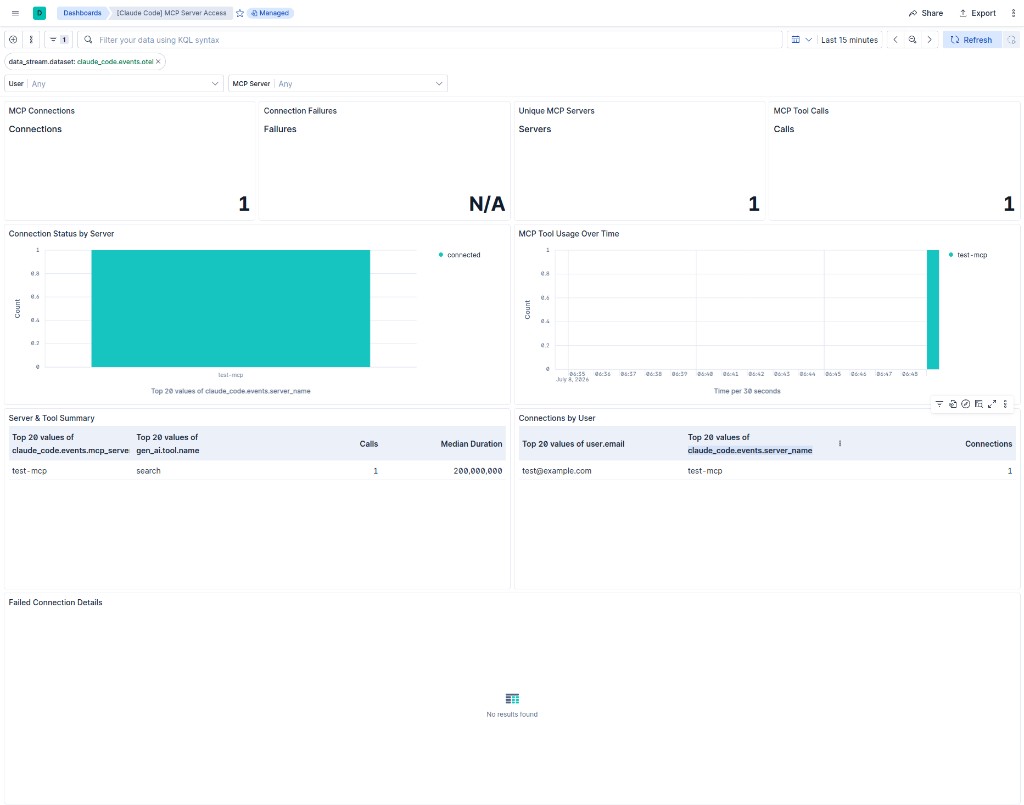
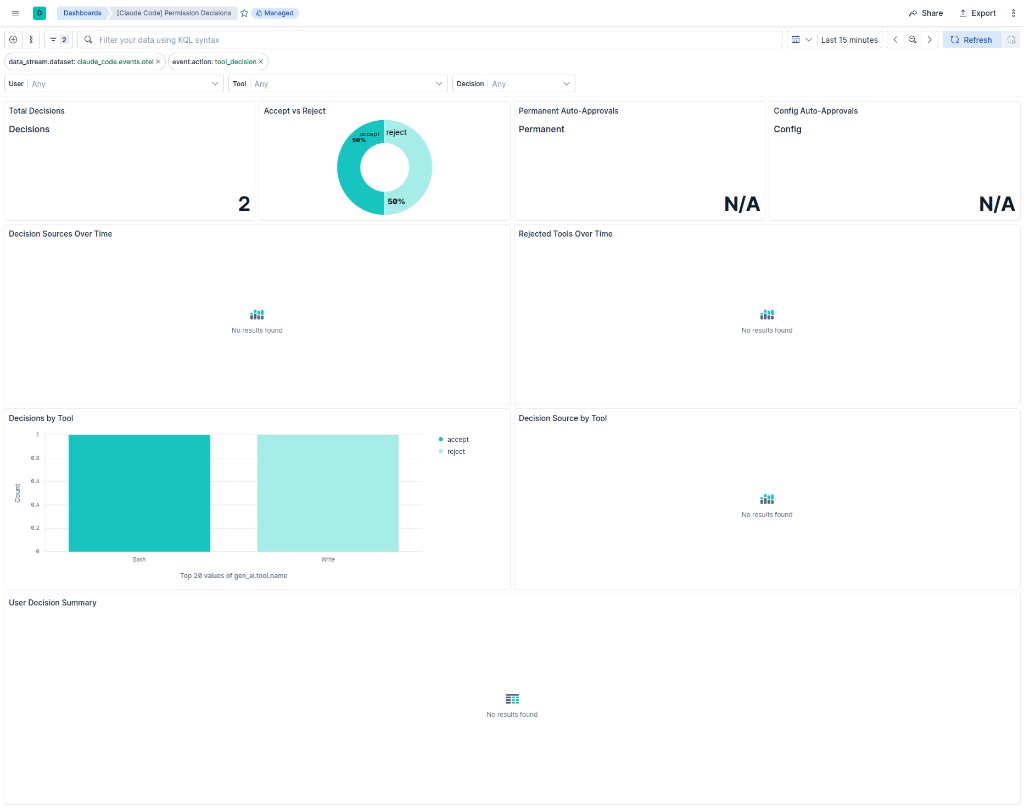
Changelog
| Version | Details | Minimum Kibana version |
|---|---|---|
| 0.3.0 | Enhancement (View pull request) Add traces data stream to collect Claude Code OTLP trace spans (beta), with a dedicated ingest pipeline and dashboard. |
9.4.0 |
| 0.2.2 | Bug fix (View pull request) Expose configurable HTTP endpoint to prevent port conflicts. |
9.4.0 |
| 0.2.1 | Bug fix (View pull request) Remove incorrect mapping of claude_code.events.server_name to related.hosts. |
9.4.0 |
| 0.2.0 | Enhancement (View pull request) Map fields to ECS gen_ai.* fieldset and core ECS fields; fix event.category assignments per event type. |
9.4.0 |
| 0.1.0 | Enhancement (View pull request) Initial release. |
9.4.0 |