IIS OpenTelemetry Assets
Elastic Cloud Serverless projects are autoscaled environments, fully managed by Elastic and available on Elastic Cloud. Availability This functionality is in technical preview and is ready for evaluation. Use with caution in production; it is not recommended for mission-critical workloads. Elastic will work to fix any issues, but features in technical preview are not subject to the support SLA of official GA features. Specific Support terms apply. Elastic Cloud Serverless projects are autoscaled environments, fully managed by Elastic and available on Elastic Cloud. Availability This functionality is in technical preview and is ready for evaluation. Use with caution in production; it is not recommended for mission-critical workloads. Elastic will work to fix any issues, but features in technical preview are not subject to the support SLA of official GA features. Specific Support terms apply. The Elastic Stack includes Elastic's core products such as Elasticsearch, Kibana, Logstash, and Beats. Availability This functionality is in technical preview and is ready for evaluation. Use with caution in production; it is not recommended for mission-critical workloads. Elastic will work to fix any issues, but features in technical preview are not subject to the support SLA of official GA features. Specific Support terms apply. Unless stated otherwise on the page, this functionality is available when your Elastic Stack is deployed on Elastic Cloud Hosted, Elastic Cloud Enterprise, Elastic Cloud on Kubernetes, and self-managed environments. This documentation corresponds to the latest patch available for each minor version. If you're not using the latest patch, check the release notes for changes.
Serverless Observability
Preview
Preview
Serverless Security
Preview
Preview
Stack
Preview
9.4+
Preview since 9.4
| Version | 0.5.2 Availability Preview This functionality is in technical preview and is ready for evaluation. Use with caution in production; it is not recommended for mission-critical workloads. Elastic will work to fix any issues, but features in technical preview are not subject to the support SLA of official GA features. Specific Support terms apply. (View all) |
| Subscription level What's this? |
Basic |
| Developed by What's this? |
Elastic |
| Minimum Kibana version(s) | 9.4.0 |
To use pre-release integrations, go to the Integrations page in Kibana, scroll down, and toggle on the Display beta integrations option.
Internet Information Services (IIS) is Microsoft's extensible web server for Windows, used to host websites, web applications, and services such as ASP.NET, WCF, and static content. It is the primary HTTP server on the Windows platform.
This content pack provides dashboards, alert rules, and SLO templates that use metrics from the OpenTelemetry IIS receiver. The assets cover application pool health, request handling capacity, traffic patterns, and resource utilization.
The IIS OpenTelemetry assets have been tested with OpenTelemetry IIS receiver v0.146.1.
IIS tested against:
- IIS 10.0 (Windows Server 2016/2019/2022)
You need Elasticsearch for storing and searching your data and Kibana for visualizing and managing it. You can use our hosted Elasticsearch Service on Elastic Cloud, which is recommended, or self-manage the Elastic Stack on your own hardware.
IIS must be running on the Windows host where you deploy the OpenTelemetry Collector. The collector uses Windows Performance Counters to gather IIS metrics, so the counters must be accessible.
To verify IIS is running:
Get-Service W3SVC
To list available web service counters:
Get-Counter -ListSet "Web Service"
If counters are corrupted or missing, rebuild them:
lodctr /r
Add the following configuration to your OpenTelemetry Collector or Elastic Observability Distribution of OpenTelemetry (EDOT) Collector. The IIS receiver runs on the Windows host that runs IIS; it collects metrics from local performance counters and exports them to Elasticsearch.
| Placeholder | Description | Example |
|---|---|---|
<ES_ENDPOINT> |
Your Elasticsearch endpoint URL | https://my-cluster.es.us-central1.gcp.cloud.es.io:443 |
<ES_API_KEY> |
Elasticsearch API key with privileges to ingest metrics | Set via ES_API_KEY environment variable |
receivers:
  iis:
    collection_interval: 30s

processors:
  resourcedetection/system:
    detectors: ["system"]
    system:
      hostname_sources: ["os"]

exporters:
  elasticsearch/otel:
    endpoints: [ '<ES_ENDPOINT>' ]
    api_key: '${env:ES_API_KEY}'
    mapping:
      mode: otel

service:
  pipelines:
    metrics:
      receivers: [ iis ]
      processors: [ resourcedetection/system ]
      exporters: [ elasticsearch/otel ]
Run the collector on the same Windows host as IIS so it can read local performance counters. The receiver has no remote collection capability.
The resourcedetection/system processor is required to populate host information (resource.attributes.host.name) used by the dashboards. Without it, host-level fields will be empty.
Refer to the metadata.yaml of the OpenTelemetry IIS receiver for details on available metrics.
| Dashboard | Description |
|---|---|
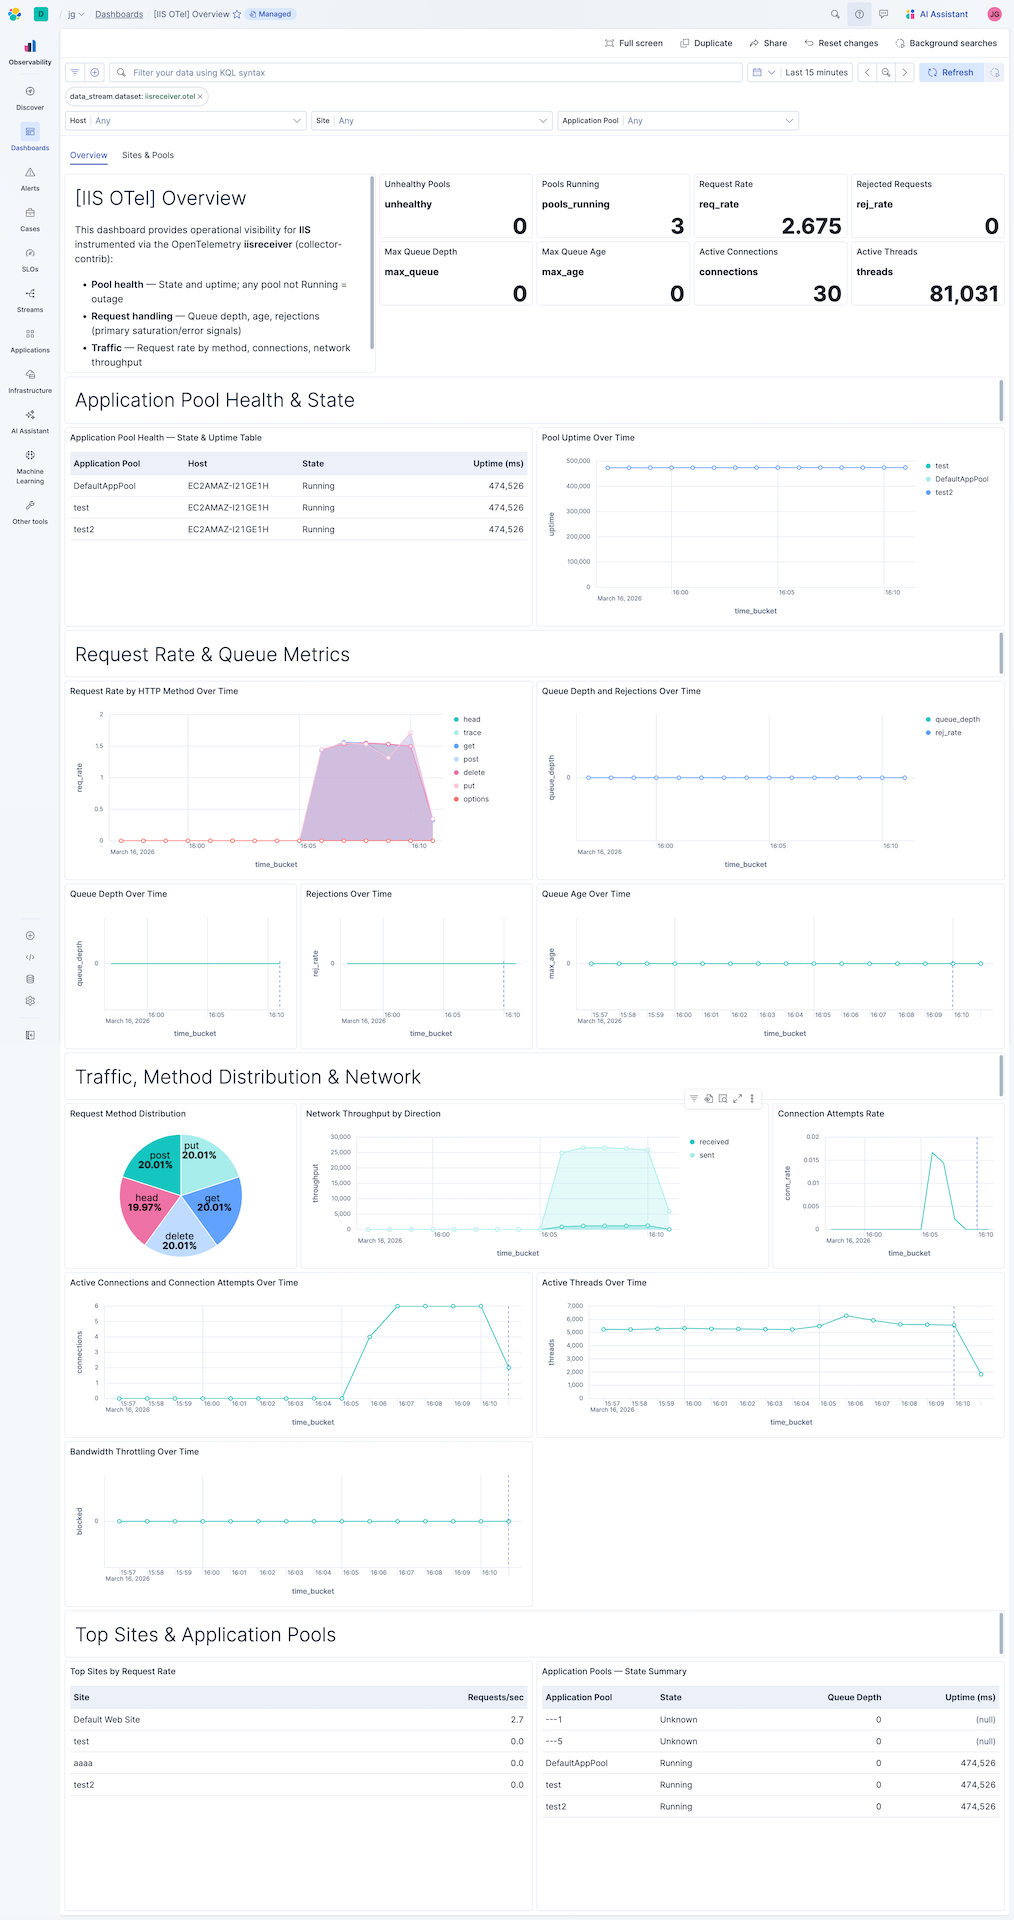
| [IIS OTel] Overview | Key metrics for IIS web server health — application pool state, request handling, traffic, and resource utilization. |
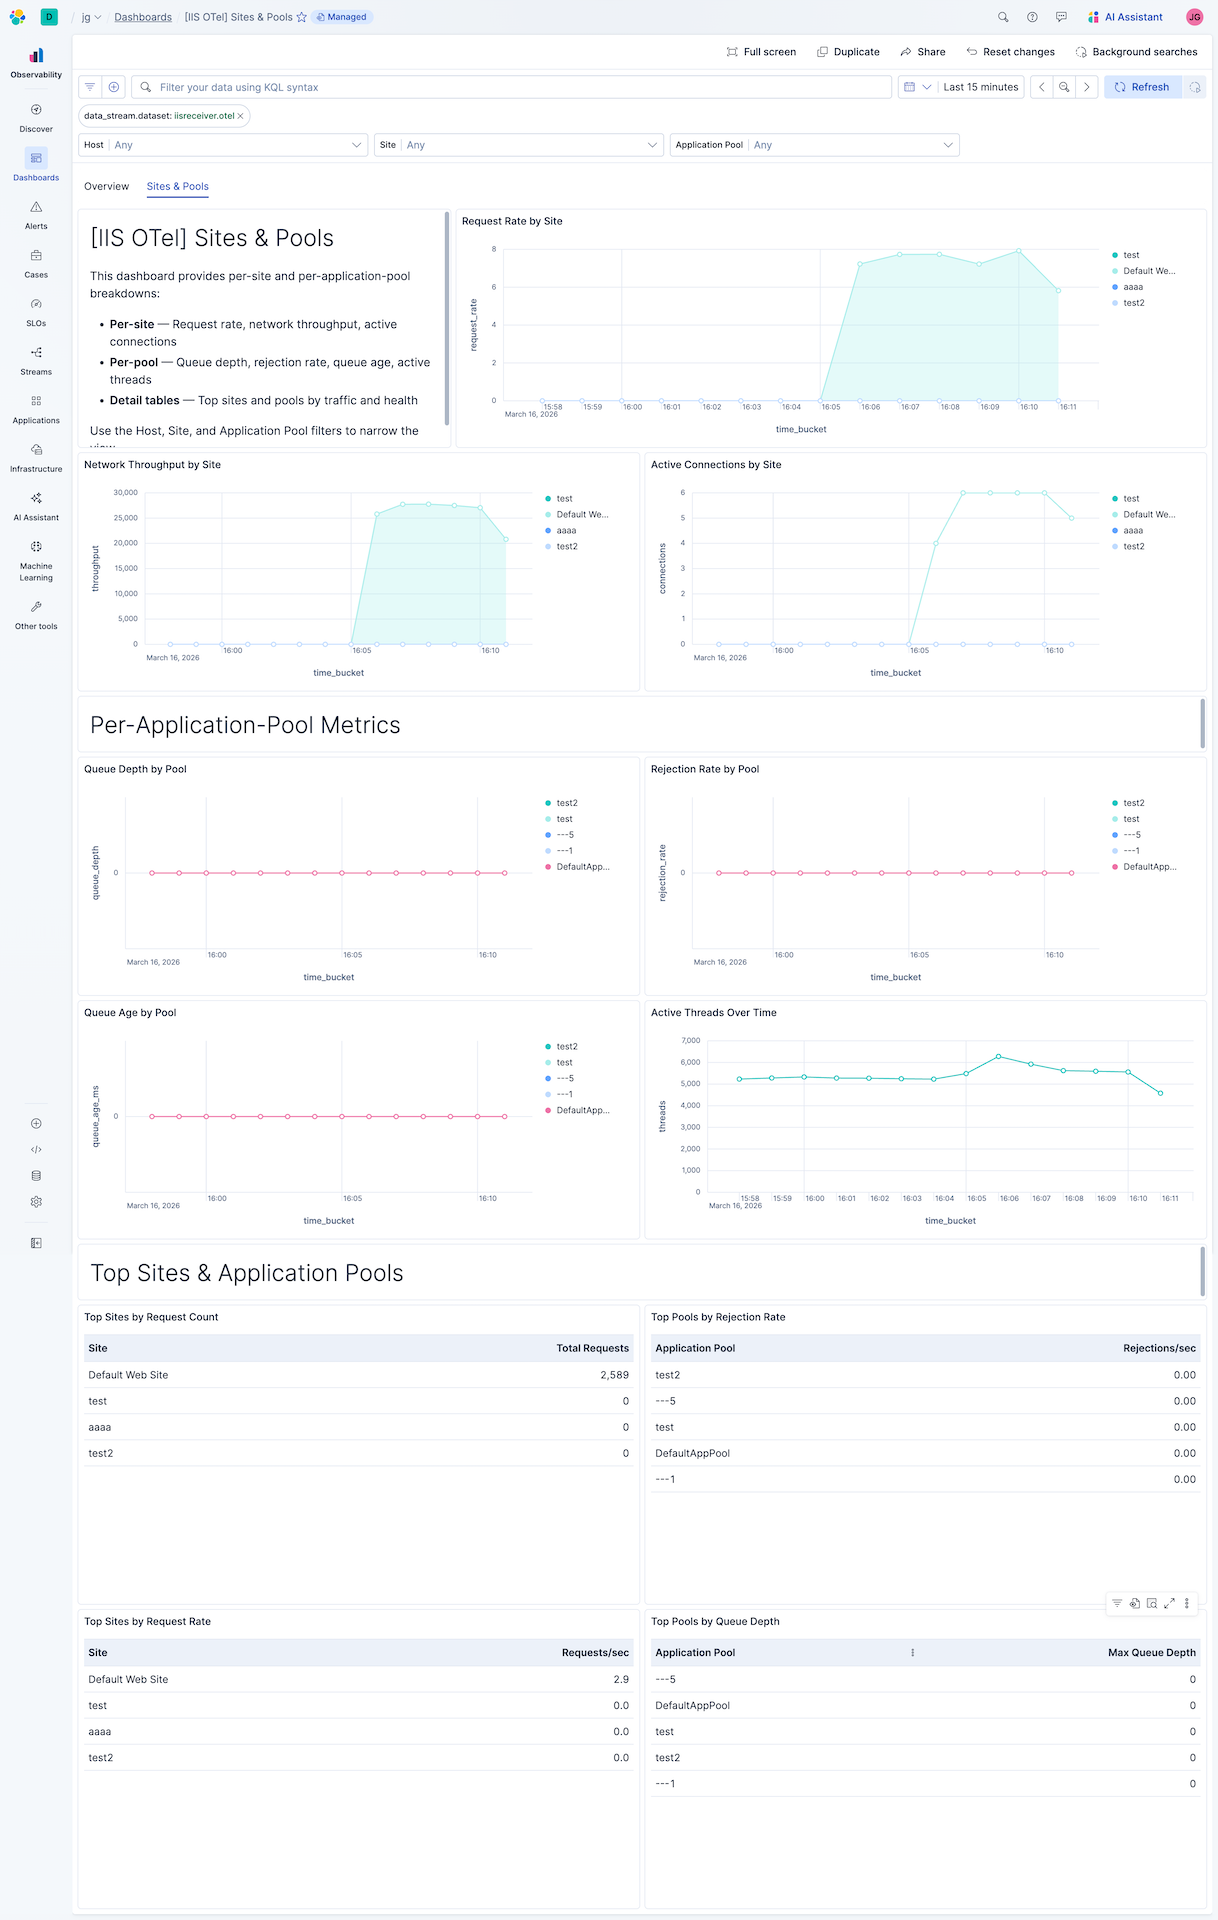
| [IIS OTel] Sites & Pools | Per-site and per-application-pool breakdown of request handling, traffic, and resource utilization. |
| Alert | Trigger | Severity |
|---|---|---|
| [IIS OTel] Application pool not running | Application pool state is not Running (3) | Critical |
| [IIS OTel] Request rejections detected | One or more requests rejected in the evaluation window | High |
| [IIS OTel] Request queue depth elevated | Request queue depth exceeds 10 | High |
| [IIS OTel] Request queue age elevated | Oldest queued request age exceeds 5000 ms | Medium |
| [IIS OTel] Bandwidth throttling detected | Bytes blocked by bandwidth throttling in the evaluation window | Warning |
SLO templates require Elastic Stack version 9.4.0 or later.
| SLO | Target | Window | Description |
|---|---|---|---|
| [IIS OTel] Zero request rejections 99.5% rolling 30 days | 99.5% | 30-day rolling | Proportion of 1-minute intervals with zero request rejections; non-zero rejections indicate the server failed to serve clients. |
| [IIS OTel] Request queue age 99.5% rolling 30 days | 99.5% | 30-day rolling | Proportion of 1-minute intervals where the oldest queued request age stays below 1000 ms; queue age is the primary latency proxy. |
This integration includes one or more Kibana dashboards that visualizes the data collected by the integration. The screenshots below illustrate how the ingested data is displayed.
Changelog
| Version | Details | Minimum Kibana version |
|---|---|---|
| 0.5.2 | Enhancement (View pull request) Add group field to package manifest. |
9.4.0 |
| 0.5.1 | Bug fix (View pull request) Regenerate Kibana dashboards so ES|QL Lens panels include populated adHocDataViews, internalReferences, and per-layer index, fixing the broken "Explore in Discover" action on Kibana 9.3+. |
9.4.0 |
| 0.5.0 | Enhancement (View pull request) Add tags to Kibana assets |
9.4.0 |
| 0.4.0 | Enhancement (View pull request) Add description and artifact fields to alerting rule template. |
9.4.0 |
| 0.3.0 | Enhancement (View pull request) Add new assets |
9.3.0 |
| 0.2.0 | Enhancement (View pull request) Add discovery field to support auto-install |
9.2.0 |
| 0.1.2 | Enhancement (View pull request) Add opentelemetry category |
9.1.0 |
| 0.1.1 | Bug fix (View pull request) Remove mentions of "Content Pack" and EDOT Collector from README |
9.1.0 |
| 0.1.0 | Enhancement (View pull request) First release of the IIS OpenTelemetry content package |
9.1.0 |