MongoDB Integration
Elastic Cloud Serverless projects are autoscaled environments, fully managed by Elastic and available on Elastic Cloud. Availability This functionality is generally available and ready for production usage. Elastic Cloud Serverless projects are autoscaled environments, fully managed by Elastic and available on Elastic Cloud. Availability This functionality is generally available and ready for production usage. The Elastic Stack includes Elastic's core products such as Elasticsearch, Kibana, Logstash, and Beats. Availability This functionality is generally available and ready for production usage. Unless stated otherwise on the page, this functionality is available when your Elastic Stack is deployed on Elastic Cloud Hosted, Elastic Cloud Enterprise, Elastic Cloud on Kubernetes, and self-managed environments. This documentation corresponds to the latest patch available for each minor version. If you're not using the latest patch, check the release notes for changes.
Serverless Observability
Generally available
Serverless Security
Generally available
Stack
9.2+
Generally available since 9.2
| Version | 1.24.0 (View all) |
| Subscription level What's this? |
Basic |
| Developed by What's this? |
Elastic |
| Ingestion method(s) | Database, File |
| Minimum Kibana version(s) | 9.2.1 8.19.0 |
This integration is used to fetch logs and metrics from MongoDB.
When configuring the hosts option, MongoDB URIs must adhere to the following formats:
- Simple:
mongodb://[user:pass@]host[:port][?options] - Complex:
mongodb://[username:password@]host1[:port1][,...hostN[:portN]][/[defaultauthdb][?options]]
Examples of URIs can vary from simple to complex:
- Simple:
localhost - Complex:
mongodb://myuser:mypass@localhost:40001", "otherhost:40001
Additional supported URI examples include:
- Replica set:
mongodb://localhost:27017,localhost:27022,localhost:27023/?replicaSet=dbrs - Direct connection:
mongodb://localhost:27017/?directConnection=true
When using the directConnection=true parameter in the connection URI, all operations are executed on the specified host. It's important to explicitly include directConnection=true in the URI as it won't be automatically added.
- Authentication:
mongodb://username:password@host:port/authSource=$external?authMechanism=PLAIN
When specifying authMechanism as PLAIN, it indicates the use of the PLAIN authentication mechanism, which is commonly associated with LDAP.
authSource can be used to specify the name of the database that has the collection with the user credentials.
In MongoDB, authSource=$external is a special authentication database used for authenticating users externally, such as via LDAP.
The username and password can either be included in the URI or set using the respective configuration options. If included in the URI, these credentials take precedence over any configured username and password configuration options.
The log dataset is tested with logs from versions v3.2.11 and v4.4.4 in
plaintext and json formats.
The collstats, dbstats, metrics, replstatus and status datasets are
tested with MongoDB 5.0 and are expected to work with all versions >= 5.0.
In order to use the metrics datasets, the MongoDB user specified in the package configuration needs to have certain privileges.
We recommend using the clusterMonitor role to cover all the necessary privileges.
You can use the following command in Mongo shell to create the privileged user
(make sure you are using the admin db by using db command in Mongo shell).
db.createUser(
    {
        user: "beats",
        pwd: "pass",
        roles: ["clusterMonitor"]
    }
)
You can use the following command in Mongo shell to authenticate a user against a specific database with the provided username and password (make sure you are using the admin db by using db command in Mongo shell).
db.auth(user, pass)
You can use the following command in Mongo shell to grant the role to an
existing user (make sure you are using the admin db by using db command in
Mongo shell).
db.grantRolesToUser("user", ["clusterMonitor"])
The log dataset collects the MongoDB logs.
Example
{
    "@timestamp": "2022-12-16T07:30:07.376Z",
    "agent": {
        "ephemeral_id": "d4efa095-1892-409c-96cf-691d6307b15b",
        "id": "4729bacd-4e52-4243-ae58-793424154f42",
        "name": "docker-fleet-agent",
        "type": "filebeat",
        "version": "8.5.0"
    },
    "data_stream": {
        "dataset": "mongodb.log",
        "namespace": "ep",
        "type": "logs"
    },
    "ecs": {
        "version": "8.11.0"
    },
    "elastic_agent": {
        "id": "4729bacd-4e52-4243-ae58-793424154f42",
        "snapshot": false,
        "version": "8.5.0"
    },
    "event": {
        "agent_id_status": "verified",
        "category": [
            "database"
        ],
        "created": "2022-12-16T07:30:25.369Z",
        "dataset": "mongodb.log",
        "ingested": "2022-12-16T07:30:26Z",
        "kind": "event",
        "type": [
            "info"
        ]
    },
    "host": {
        "architecture": "x86_64",
        "containerized": false,
        "hostname": "docker-fleet-agent",
        "id": "66392b0697b84641af8006d87aeb89f1",
        "ip": [
            "172.18.0.7"
        ],
        "mac": [
            "02-42-AC-12-00-07"
        ],
        "name": "docker-fleet-agent",
        "os": {
            "codename": "focal",
            "family": "debian",
            "kernel": "5.15.49-linuxkit",
            "name": "Ubuntu",
            "platform": "ubuntu",
            "type": "linux",
            "version": "20.04.5 LTS (Focal Fossa)"
        }
    },
    "input": {
        "type": "log"
    },
    "log": {
        "file": {
            "path": "/tmp/service_logs/mongodb.log"
        },
        "level": "I",
        "offset": 0
    },
    "message": "***** SERVER RESTARTED *****",
    "mongodb": {
        "log": {
            "component": "CONTROL",
            "context": "main"
        }
    },
    "related": {
        "hosts": [
            "docker-fleet-agent"
        ]
    },
    "tags": [
        "mongodb-logs"
    ]
}
The fields reported are:
ECS Field Reference
Please refer to the following document for detailed information on ECS fields.
Exported fields
| Field | Description | Type |
|---|---|---|
| @timestamp | Event timestamp. | date |
| cloud.image.id | Image ID for the cloud instance. | keyword |
| data_stream.dataset | Data stream dataset. | constant_keyword |
| data_stream.namespace | Data stream namespace. | constant_keyword |
| data_stream.type | Data stream type. | constant_keyword |
| event.dataset | Event dataset | constant_keyword |
| event.module | Event module | constant_keyword |
| host.containerized | If the host is a container. | boolean |
| host.os.build | OS build information. | keyword |
| host.os.codename | OS codename, if any. | keyword |
| input.type | Type of Filebeat input. | keyword |
| log.flags | This field contains the flags of the event. | keyword |
| log.offset | Offset of the entry in the log file. | long |
| mongodb.log.attr | Attributes related to the log message. | flattened |
| mongodb.log.component | Functional categorization of message | keyword |
| mongodb.log.context | Context of message | keyword |
| mongodb.log.id | Integer representing the unique identifier of the log statement | long |
The collstats dataset uses the top administrative command to return usage
statistics for each collection. It provides the amount of time, in microseconds,
used and a count of operations for the following types: total, readLock, writeLock,
queries, getmore, insert, update, remove, and commands.
It requires the following privileges, which is covered by the clusterMonitor role:
Example
{
    "@timestamp": "2022-10-20T10:51:51.648Z",
    "agent": {
        "ephemeral_id": "069895c3-402a-45ff-9ddd-a50c62446502",
        "hostname": "docker-fleet-agent",
        "id": "a326ccf1-3f91-4412-bc97-215ea856cd16",
        "name": "docker-fleet-agent",
        "type": "metricbeat",
        "version": "7.14.0"
    },
    "data_stream": {
        "dataset": "mongodb.collstats",
        "namespace": "ep",
        "type": "metrics"
    },
    "ecs": {
        "version": "8.11.0"
    },
    "elastic_agent": {
        "id": "a326ccf1-3f91-4412-bc97-215ea856cd16",
        "snapshot": false,
        "version": "7.14.0"
    },
    "event": {
        "agent_id_status": "verified",
        "dataset": "mongodb.collstats",
        "duration": 4040208,
        "ingested": "2022-10-20T10:51:55.190132092Z",
        "module": "mongodb"
    },
    "host": {
        "architecture": "aarch64",
        "containerized": false,
        "hostname": "docker-fleet-agent",
        "id": "2347a1bd8a3945949da8ab5c29f60774",
        "ip": [
            "172.18.0.7"
        ],
        "mac": [
            "02-42-AC-1F-00-07"
        ],
        "name": "docker-fleet-agent",
        "os": {
            "codename": "AltArch",
            "family": "redhat",
            "kernel": "5.10.124-linuxkit",
            "name": "CentOS Linux",
            "platform": "centos",
            "type": "linux",
            "version": "7 (AltArch)"
        }
    },
    "metricset": {
        "name": "collstats",
        "period": 10000
    },
    "mongodb": {
        "collstats": {
            "collection": "system.roles",
            "commands": {
                "count": 0,
                "time": {
                    "us": 0
                }
            },
            "db": "admin",
            "getmore": {
                "count": 0,
                "time": {
                    "us": 0
                }
            },
            "insert": {
                "count": 0,
                "time": {
                    "us": 0
                }
            },
            "lock": {
                "read": {
                    "count": 1,
                    "time": {
                        "us": 19
                    }
                },
                "write": {
                    "count": 0,
                    "time": {
                        "us": 0
                    }
                }
            },
            "name": "admin.system.roles",
            "queries": {
                "count": 1,
                "time": {
                    "us": 19
                }
            },
            "remove": {
                "count": 0,
                "time": {
                    "us": 0
                }
            },
            "total": {
                "count": 1,
                "time": {
                    "us": 19
                }
            },
            "update": {
                "count": 0,
                "time": {
                    "us": 0
                }
            }
        }
    },
    "service": {
        "address": "mongodb://elastic-package-service-mongodb-1",
        "type": "mongodb"
    }
}
The fields reported are:
ECS Field Reference
Please refer to the following document for detailed information on ECS fields.
Exported fields
| Field | Description | Type | Unit | Metric Type |
|---|---|---|---|---|
| @timestamp | Event timestamp. | date | ||
| agent.id | keyword | |||
| cloud.account.id | The cloud account or organization id used to identify different entities in a multi-tenant environment. Examples: AWS account id, Google Cloud ORG Id, or other unique identifier. | keyword | ||
| cloud.availability_zone | Availability zone in which this host is running. | keyword | ||
| cloud.image.id | Image ID for the cloud instance. | keyword | ||
| cloud.instance.id | Instance ID of the host machine. | keyword | ||
| cloud.provider | Name of the cloud provider. Example values are aws, azure, gcp, or digitalocean. | keyword | ||
| cloud.region | Region in which this host is running. | keyword | ||
| container.id | Unique container id. | keyword | ||
| data_stream.dataset | Data stream dataset. | constant_keyword | ||
| data_stream.namespace | Data stream namespace. | constant_keyword | ||
| data_stream.type | Data stream type. | constant_keyword | ||
| event.dataset | Event dataset | constant_keyword | ||
| event.module | Event module | constant_keyword | ||
| host.containerized | If the host is a container. | boolean | ||
| host.name | Name of the host. It can contain what hostname returns on Unix systems, the fully qualified domain name, or a name specified by the user. The sender decides which value to use. |
keyword | ||
| host.os.build | OS build information. | keyword | ||
| host.os.codename | OS codename, if any. | keyword | ||
| mongodb.collstats.collection | Collection name. | keyword | ||
| mongodb.collstats.commands.count | Number of database commands executed. | long | counter | |
| mongodb.collstats.commands.time.us | Time executing database commands in microseconds. | long | counter | |
| mongodb.collstats.db | Database name. | keyword | ||
| mongodb.collstats.getmore.count | Number of times a cursor asked for more data. | long | counter | |
| mongodb.collstats.getmore.time.us | Time asking for more cursor rows in microseconds. | long | counter | |
| mongodb.collstats.insert.count | Number of document insert events. | long | counter | |
| mongodb.collstats.insert.time.us | Time inserting new documents in microseconds. | long | counter | |
| mongodb.collstats.lock.read.count | Number of read lock wait events. | long | counter | |
| mongodb.collstats.lock.read.time.us | Time waiting for read locks in microseconds. | long | counter | |
| mongodb.collstats.lock.write.count | Number of write lock wait events. | long | counter | |
| mongodb.collstats.lock.write.time.us | Time waiting for write locks in microseconds. | long | counter | |
| mongodb.collstats.name | Combination of database and collection name. | keyword | ||
| mongodb.collstats.queries.count | Number of queries executed. | long | counter | |
| mongodb.collstats.queries.time.us | Time running queries in microseconds. | long | counter | |
| mongodb.collstats.remove.count | Number of document delete events. | long | counter | |
| mongodb.collstats.remove.time.us | Time deleting documents in microseconds. | long | counter | |
| mongodb.collstats.stats.avgObjSize | The average size of an object in the collection (in bytes). | long | ||
| mongodb.collstats.stats.count | The number of objects or documents in this collection. | long | ||
| mongodb.collstats.stats.max | Shows the maximum number of documents that may be present in a capped collection. | long | ||
| mongodb.collstats.stats.nindexes | The number of indexes on the collection. All collections have at least one index on the _id field. | long | ||
| mongodb.collstats.stats.size | The total uncompressed size in memory of all records in a collection. | long | ||
| mongodb.collstats.stats.storageSize | The total amount of storage allocated to this collection for document storage (in bytes). | long | byte | gauge |
| mongodb.collstats.stats.totalIndexSize | The total size of all indexes (in bytes). | long | ||
| mongodb.collstats.stats.totalSize | The sum of the storageSize and totalIndexSize (in bytes). | long | ||
| mongodb.collstats.total.count | Total number of lock wait events. | long | counter | |
| mongodb.collstats.total.time.us | Total waiting time for locks in microseconds. | long | counter | |
| mongodb.collstats.update.count | Number of document update events. | long | counter | |
| mongodb.collstats.update.time.us | Time updating documents in microseconds. | long | counter | |
| service.address | Address where data about this service was collected from. This should be a URI, network address (ipv4:port or [ipv6]:port) or a resource path (sockets). | keyword |
The dbstats dataset collects storage statistics for a given database.
It requires the following privileges, which is covered by the clusterMonitor role:
listDatabases action on cluster resource
for each of the databases, also need dbStats action on the database resource
Example
{
    "@timestamp": "2022-10-20T10:52:35.564Z",
    "agent": {
        "ephemeral_id": "cdd73778-56aa-4cc4-b9dd-f2e2202cfef6",
        "hostname": "docker-fleet-agent",
        "id": "a326ccf1-3f91-4412-bc97-215ea856cd16",
        "name": "docker-fleet-agent",
        "type": "metricbeat",
        "version": "7.14.0"
    },
    "data_stream": {
        "dataset": "mongodb.dbstats",
        "namespace": "ep",
        "type": "metrics"
    },
    "ecs": {
        "version": "8.11.0"
    },
    "elastic_agent": {
        "id": "a326ccf1-3f91-4412-bc97-215ea856cd16",
        "snapshot": false,
        "version": "7.14.0"
    },
    "event": {
        "agent_id_status": "verified",
        "dataset": "mongodb.dbstats",
        "duration": 3442416,
        "ingested": "2022-10-20T10:52:39.124852460Z",
        "module": "mongodb"
    },
    "host": {
        "architecture": "aarch64",
        "containerized": false,
        "hostname": "docker-fleet-agent",
        "id": "2347a1bd8a3945949da8ab5c29f60774",
        "ip": [
            "172.18.0.7"
        ],
        "mac": [
            "02-42-AC-1F-00-07"
        ],
        "name": "docker-fleet-agent",
        "os": {
            "codename": "AltArch",
            "family": "redhat",
            "kernel": "5.10.124-linuxkit",
            "name": "CentOS Linux",
            "platform": "centos",
            "type": "linux",
            "version": "7 (AltArch)"
        }
    },
    "metricset": {
        "name": "dbstats",
        "period": 10000
    },
    "mongodb": {
        "dbstats": {
            "avg_obj_size": {
                "bytes": 522
            },
            "collections": 3,
            "data_size": {
                "bytes": 1566
            },
            "db": "local",
            "file_size": {},
            "index_size": {
                "bytes": 12288
            },
            "indexes": 3,
            "ns_size_mb": {},
            "num_extents": 0,
            "objects": 3,
            "storage_size": {
                "bytes": 12288
            }
        }
    },
    "service": {
        "address": "mongodb://elastic-package-service-mongodb-1",
        "type": "mongodb"
    }
}
The fields reported are:
ECS Field Reference
Please refer to the following document for detailed information on ECS fields.
Exported fields
| Field | Description | Type | Metric Type |
|---|---|---|---|
| @timestamp | Event timestamp. | date | |
| agent.id | keyword | ||
| cloud.account.id | The cloud account or organization id used to identify different entities in a multi-tenant environment. Examples: AWS account id, Google Cloud ORG Id, or other unique identifier. | keyword | |
| cloud.availability_zone | Availability zone in which this host is running. | keyword | |
| cloud.image.id | Image ID for the cloud instance. | keyword | |
| cloud.instance.id | Instance ID of the host machine. | keyword | |
| cloud.provider | Name of the cloud provider. Example values are aws, azure, gcp, or digitalocean. | keyword | |
| cloud.region | Region in which this host is running. | keyword | |
| container.id | Unique container id. | keyword | |
| data_stream.dataset | Data stream dataset. | constant_keyword | |
| data_stream.namespace | Data stream namespace. | constant_keyword | |
| data_stream.type | Data stream type. | constant_keyword | |
| event.dataset | Event dataset | constant_keyword | |
| event.module | Event module | constant_keyword | |
| host.containerized | If the host is a container. | boolean | |
| host.name | Name of the host. It can contain what hostname returns on Unix systems, the fully qualified domain name, or a name specified by the user. The sender decides which value to use. |
keyword | |
| host.os.build | OS build information. | keyword | |
| host.os.codename | OS codename, if any. | keyword | |
| mongodb.dbstats.avg_obj_size.bytes | long | gauge | |
| mongodb.dbstats.collections | integer | gauge | |
| mongodb.dbstats.data_file_version.major | long | ||
| mongodb.dbstats.data_file_version.minor | long | ||
| mongodb.dbstats.data_size.bytes | long | gauge | |
| mongodb.dbstats.db | keyword | ||
| mongodb.dbstats.extent_free_list.num | long | gauge | |
| mongodb.dbstats.extent_free_list.size.bytes | long | gauge | |
| mongodb.dbstats.file_size.bytes | long | gauge | |
| mongodb.dbstats.index_size.bytes | long | gauge | |
| mongodb.dbstats.indexes | long | gauge | |
| mongodb.dbstats.ns_size_mb.mb | long | gauge | |
| mongodb.dbstats.num_extents | long | gauge | |
| mongodb.dbstats.objects | long | gauge | |
| mongodb.dbstats.storage_size.bytes | long | gauge | |
| service.address | Address where data about this service was collected from. This should be a URI, network address (ipv4:port or [ipv6]:port) or a resource path (sockets). | keyword |
It requires the following privileges, which is covered by the clusterMonitor role:
- serverStatus action on cluster resource
Example
{
"@timestamp": "2022-10-20T10:54:12.592Z",
"agent": {
"ephemeral_id": "79bbe613-f914-4617-8ef0-345562558b05",
"hostname": "docker-fleet-agent",
"id": "a326ccf1-3f91-4412-bc97-215ea856cd16",
"name": "docker-fleet-agent",
"type": "metricbeat",
"version": "7.14.0"
},
"data_stream": {
"dataset": "mongodb.metrics",
"namespace": "ep",
"type": "metrics"
},
"ecs": {
"version": "8.11.0"
},
"elastic_agent": {
"id": "a326ccf1-3f91-4412-bc97-215ea856cd16",
"snapshot": false,
"version": "7.14.0"
},
"event": {
"agent_id_status": "verified",
"dataset": "mongodb.metrics",
"duration": 2745875,
"ingested": "2022-10-20T10:54:16.129970088Z",
"module": "mongodb"
},
"host": {
"architecture": "aarch64",
"containerized": false,
"hostname": "docker-fleet-agent",
"id": "2347a1bd8a3945949da8ab5c29f60774",
"ip": [
"172.18.0.7"
],
"mac": [
"02-42-AC-1F-00-07"
],
"name": "docker-fleet-agent",
"os": {
"codename": "AltArch",
"family": "redhat",
"kernel": "5.10.124-linuxkit",
"name": "CentOS Linux",
"platform": "centos",
"type": "linux",
"version": "7 (AltArch)"
}
},
"metricset": {
"name": "metrics",
"period": 10000
},
"mongodb": {
"metrics": {
"commands": {
"aggregate": {
"failed": 0,
"total": 0
},
"build_info": {
"failed": 0,
"total": 24
},
"coll_stats": {
"failed": 0,
"total": 0
},
"connection_pool_stats": {
"failed": 0,
"total": 0
},
"count": {
"failed": 0,
"total": 0
},
"db_stats": {
"failed": 0,
"total": 0
},
"distinct": {
"failed": 0,
"total": 0
},
"find": {
"failed": 0,
"total": 0
},
"get_cmd_line_opts": {
"failed": 0,
"total": 0
},
"get_last_error": {
"failed": 0,
"total": 0
},
"get_log": {
"failed": 0,
"total": 0
},
"get_more": {
"failed": 0,
"total": 0
},
"get_parameter": {
"failed": 0,
"total": 0
},
"host_info": {
"failed": 0,
"total": 0
},
"insert": {
"failed": 0,
"total": 0
},
"is_master": {
"failed": 0,
"total": 38
},
"is_self": {
"failed": 0,
"total": 0
},
"last_collections": {
"failed": 0,
"total": 0
},
"last_commands": {
"failed": 0,
"total": 0
},
"list_databased": {
"failed": 0,
"total": 0
},
"list_indexes": {
"failed": 0,
"total": 0
},
"ping": {
"failed": 0,
"total": 2
},
"profile": {
"failed": 0,
"total": 0
},
"replset_get_rbid": {
"failed": 0,
"total": 0
},
"replset_get_status": {
"failed": 12,
"total": 12
},
"replset_heartbeat": {
"failed": 0,
"total": 0
},
"replset_update_position": {
"failed": 0,
"total": 0
},
"server_status": {
"failed": 0,
"total": 14
},
"update": {
"failed": 0,
"total": 0
},
"whatsmyuri": {
"failed": 0,
"total": 12
}
},
"cursor": {
"open": {
"no_timeout": 0,
"pinned": 0,
"total": 0
},
"timed_out": 0
},
"document": {
"deleted": 0,
"inserted": 0,
"returned": 0,
"updated": 0
},
"get_last_error": {
"write_timeouts": 0,
"write_wait": {
"count": 0,
"ms": 0
}
},
"operation": {
"scan_and_order": 0,
"write_conflicts": 0
},
"query_executor": {
"scanned_documents": {
"count": 0
},
"scanned_indexes": {
"count": 0
}
},
"replication": {
"apply": {
"attempts_to_become_secondary": 0,
"batches": {
"count": 0,
"time": {
"ms": 0
}
},
"ops": 0
},
"buffer": {
"count": 0,
"max_size": {
"bytes": 0
},
"size": {
"bytes": 0
}
},
"executor": {
"counters": {
"cancels": 0,
"event_created": 0,
"event_wait": 0,
"scheduled": {
"dbwork": 0,
"exclusive": 0,
"failures": 0,
"netcmd": 0,
"work": 0,
"work_at": 0
},
"waits": 0
},
"event_waiters": 0,
"network_interface": "\nNetworkInterfaceASIO Operations' Diagnostic:\nOperation: Count: \nConnecting 0 \nIn Progress 0 \nSucceeded 0 \nCanceled 0 \nFailed 0 \nTimed Out 0 \n\n",
"queues": {
"free": 0,
"in_progress": {
"dbwork": 0,
"exclusive": 0,
"network": 0
},
"ready": 0,
"sleepers": 0
},
"shutting_down": false,
"unsignaled_events": 0
},
"initial_sync": {
"completed": 0,
"failed_attempts": 0,
"failures": 0
},
"network": {
"bytes": 0,
"getmores": {
"count": 0,
"time": {
"ms": 0
}
},
"ops": 0,
"reders_created": 0
},
"preload": {
"docs": {
"count": 0,
"time": {
"ms": 0
}
},
"indexes": {
"count": 0,
"time": {
"ms": 0
}
}
}
},
"storage": {
"search": {
"bucket_exhausted": 0,
"requests": 0,
"scanned": 0
}
},
"ttl": {
"deleted_documents": {
"count": 0
},
"passes": {
"count": 0
}
}
}
},
"service": {
"address": "mongodb://elastic-package-service-mongodb-1",
"type": "mongodb"
}
}
The fields reported are:
ECS Field Reference
Please refer to the following document for detailed information on ECS fields.
Exported fields
| Field | Description | Type | Metric Type |
|---|---|---|---|
| @timestamp | Event timestamp. | date | |
| agent.id | keyword | ||
| cloud.account.id | The cloud account or organization id used to identify different entities in a multi-tenant environment. Examples: AWS account id, Google Cloud ORG Id, or other unique identifier. | keyword | |
| cloud.availability_zone | Availability zone in which this host is running. | keyword | |
| cloud.image.id | Image ID for the cloud instance. | keyword | |
| cloud.instance.id | Instance ID of the host machine. | keyword | |
| cloud.provider | Name of the cloud provider. Example values are aws, azure, gcp, or digitalocean. | keyword | |
| cloud.region | Region in which this host is running. | keyword | |
| container.id | Unique container id. | keyword | |
| data_stream.dataset | Data stream dataset. | constant_keyword | |
| data_stream.namespace | Data stream namespace. | constant_keyword | |
| data_stream.type | Data stream type. | constant_keyword | |
| event.dataset | Event dataset | constant_keyword | |
| event.module | Event module | constant_keyword | |
| host.containerized | If the host is a container. | boolean | |
| host.name | Name of the host. It can contain what hostname returns on Unix systems, the fully qualified domain name, or a name specified by the user. The sender decides which value to use. |
keyword | |
| host.os.build | OS build information. | keyword | |
| host.os.codename | OS codename, if any. | keyword | |
| mongodb.metrics.commands.aggregate.failed | long | counter | |
| mongodb.metrics.commands.aggregate.total | long | counter | |
| mongodb.metrics.commands.build_info.failed | long | counter | |
| mongodb.metrics.commands.build_info.total | long | counter | |
| mongodb.metrics.commands.coll_stats.failed | long | counter | |
| mongodb.metrics.commands.coll_stats.total | long | counter | |
| mongodb.metrics.commands.connection_pool_stats.failed | long | counter | |
| mongodb.metrics.commands.connection_pool_stats.total | long | counter | |
| mongodb.metrics.commands.count.failed | long | counter | |
| mongodb.metrics.commands.count.total | long | counter | |
| mongodb.metrics.commands.db_stats.failed | long | counter | |
| mongodb.metrics.commands.db_stats.total | long | counter | |
| mongodb.metrics.commands.distinct.failed | long | counter | |
| mongodb.metrics.commands.distinct.total | long | counter | |
| mongodb.metrics.commands.find.failed | long | counter | |
| mongodb.metrics.commands.find.total | long | counter | |
| mongodb.metrics.commands.get_cmd_line_opts.failed | long | counter | |
| mongodb.metrics.commands.get_cmd_line_opts.total | long | counter | |
| mongodb.metrics.commands.get_last_error.failed | long | counter | |
| mongodb.metrics.commands.get_last_error.total | long | counter | |
| mongodb.metrics.commands.get_log.failed | long | counter | |
| mongodb.metrics.commands.get_log.total | long | counter | |
| mongodb.metrics.commands.get_more.failed | long | counter | |
| mongodb.metrics.commands.get_more.total | long | counter | |
| mongodb.metrics.commands.get_parameter.failed | long | counter | |
| mongodb.metrics.commands.get_parameter.total | long | counter | |
| mongodb.metrics.commands.host_info.failed | long | counter | |
| mongodb.metrics.commands.host_info.total | long | counter | |
| mongodb.metrics.commands.insert.failed | long | counter | |
| mongodb.metrics.commands.insert.total | long | counter | |
| mongodb.metrics.commands.is_master.failed | long | counter | |
| mongodb.metrics.commands.is_master.total | long | counter | |
| mongodb.metrics.commands.is_self.failed | long | counter | |
| mongodb.metrics.commands.is_self.total | long | counter | |
| mongodb.metrics.commands.last_collections.failed | long | counter | |
| mongodb.metrics.commands.last_collections.total | long | counter | |
| mongodb.metrics.commands.last_commands.failed | long | counter | |
| mongodb.metrics.commands.last_commands.total | long | counter | |
| mongodb.metrics.commands.list_databased.failed | long | counter | |
| mongodb.metrics.commands.list_databased.total | long | counter | |
| mongodb.metrics.commands.list_indexes.failed | long | counter | |
| mongodb.metrics.commands.list_indexes.total | long | counter | |
| mongodb.metrics.commands.ping.failed | long | counter | |
| mongodb.metrics.commands.ping.total | long | counter | |
| mongodb.metrics.commands.profile.failed | long | counter | |
| mongodb.metrics.commands.profile.total | long | counter | |
| mongodb.metrics.commands.replset_get_rbid.failed | long | counter | |
| mongodb.metrics.commands.replset_get_rbid.total | long | counter | |
| mongodb.metrics.commands.replset_get_status.failed | long | counter | |
| mongodb.metrics.commands.replset_get_status.total | long | counter | |
| mongodb.metrics.commands.replset_heartbeat.failed | long | counter | |
| mongodb.metrics.commands.replset_heartbeat.total | long | counter | |
| mongodb.metrics.commands.replset_update_position.failed | long | counter | |
| mongodb.metrics.commands.replset_update_position.total | long | counter | |
| mongodb.metrics.commands.server_status.failed | long | counter | |
| mongodb.metrics.commands.server_status.total | long | counter | |
| mongodb.metrics.commands.update.failed | long | counter | |
| mongodb.metrics.commands.update.total | long | counter | |
| mongodb.metrics.commands.whatsmyuri.failed | long | counter | |
| mongodb.metrics.commands.whatsmyuri.total | long | counter | |
| mongodb.metrics.cursor.open.no_timeout | The number of open cursors with the option DBQuery.Option.noTimeout set to prevent timeout. | long | gauge |
| mongodb.metrics.cursor.open.pinned | The number of pinned open cursors. |
long | gauge |
| mongodb.metrics.cursor.open.total | The number of cursors that MongoDB is maintaining for clients. | long | gauge |
| mongodb.metrics.cursor.timed_out | The total number of cursors that have timed out since the server process started. | long | counter |
| mongodb.metrics.document.deleted | The total number of documents deleted. | long | counter |
| mongodb.metrics.document.inserted | The total number of documents inserted. | long | counter |
| mongodb.metrics.document.returned | The total number of documents returned by queries. | long | counter |
| mongodb.metrics.document.updated | The total number of documents updated. | long | counter |
| mongodb.metrics.get_last_error.write_timeouts | The number of times that write concern operations have timed out as a result of the wtimeout threshold to getLastError. | long | counter |
| mongodb.metrics.get_last_error.write_wait.count | The total number of getLastError operations with a specified write concern (i.e. w) greater than 1. | long | counter |
| mongodb.metrics.get_last_error.write_wait.ms | The total amount of time in milliseconds that the mongod has spent performing getLastError operations with write concern (i.e. w) greater than 1. | long | gauge |
| mongodb.metrics.operation.scan_and_order | The total number of queries that return sorted numbers that cannot perform the sort operation using an index. | long | counter |
| mongodb.metrics.operation.write_conflicts | The total number of queries that encountered write conflicts. | long | counter |
| mongodb.metrics.query_executor.scanned_documents.count | The total number of documents scanned during queries and query-plan evaluation. | long | counter |
| mongodb.metrics.query_executor.scanned_indexes.count | The total number of index items scanned during queries and query-plan evaluation. | long | counter |
| mongodb.metrics.replication.apply.attempts_to_become_secondary | long | counter | |
| mongodb.metrics.replication.apply.batches.count | The total number of batches applied across all databases. | long | counter |
| mongodb.metrics.replication.apply.batches.time.ms | The total amount of time in milliseconds the mongod has spent applying operations from the oplog. | long | gauge |
| mongodb.metrics.replication.apply.ops | The total number of oplog operations applied. | long | counter |
| mongodb.metrics.replication.buffer.count | The current number of operations in the oplog buffer. | long | gauge |
| mongodb.metrics.replication.buffer.max_size.bytes | The maximum size of the buffer. This value is a constant setting in the mongod, and is not configurable. | long | gauge |
| mongodb.metrics.replication.buffer.size.bytes | The current size of the contents of the oplog buffer. | long | gauge |
| mongodb.metrics.replication.executor.counters.cancels | long | counter | |
| mongodb.metrics.replication.executor.counters.event_created | long | counter | |
| mongodb.metrics.replication.executor.counters.event_wait | long | counter | |
| mongodb.metrics.replication.executor.counters.scheduled.dbwork | long | counter | |
| mongodb.metrics.replication.executor.counters.scheduled.exclusive | long | counter | |
| mongodb.metrics.replication.executor.counters.scheduled.failures | long | counter | |
| mongodb.metrics.replication.executor.counters.scheduled.netcmd | long | counter | |
| mongodb.metrics.replication.executor.counters.scheduled.work | long | counter | |
| mongodb.metrics.replication.executor.counters.scheduled.work_at | long | counter | |
| mongodb.metrics.replication.executor.counters.waits | long | counter | |
| mongodb.metrics.replication.executor.event_waiters | long | gauge | |
| mongodb.metrics.replication.executor.network_interface | keyword | ||
| mongodb.metrics.replication.executor.queues.free | long | gauge | |
| mongodb.metrics.replication.executor.queues.in_progress.dbwork | long | gauge | |
| mongodb.metrics.replication.executor.queues.in_progress.exclusive | long | gauge | |
| mongodb.metrics.replication.executor.queues.in_progress.network | long | gauge | |
| mongodb.metrics.replication.executor.queues.ready | long | gauge | |
| mongodb.metrics.replication.executor.queues.sleepers | long | gauge | |
| mongodb.metrics.replication.executor.shutting_down | boolean | ||
| mongodb.metrics.replication.executor.unsignaled_events | long | gauge | |
| mongodb.metrics.replication.initial_sync.completed | long | gauge | |
| mongodb.metrics.replication.initial_sync.failed_attempts | long | counter | |
| mongodb.metrics.replication.initial_sync.failures | long | counter | |
| mongodb.metrics.replication.network.bytes | The total amount of data read from the replication sync source. | long | gauge |
| mongodb.metrics.replication.network.getmores.count | The total number of getmore operations | long | counter |
| mongodb.metrics.replication.network.getmores.time.ms | The total amount of time required to collect data from getmore operations. | long | gauge |
| mongodb.metrics.replication.network.ops | The total number of operations read from the replication source. | long | counter |
| mongodb.metrics.replication.network.reders_created | The total number of oplog query processes created. | long | counter |
| mongodb.metrics.replication.preload.docs.count | The total number of documents loaded during the pre-fetch stage of replication. | long | gauge |
| mongodb.metrics.replication.preload.docs.time.ms | long | gauge | |
| mongodb.metrics.replication.preload.indexes.count | The total number of index entries loaded by members before updating documents as part of the pre-fetch stage of replication. | long | gauge |
| mongodb.metrics.replication.preload.indexes.time.ms | The total amount of time, in milliseconds, spent loading index entries as part of the pre-fetch stage of replication. | long | gauge |
| mongodb.metrics.storage.search.bucket_exhausted | The number of times that mongod has checked the free list without finding a suitably large record allocation. | long | counter |
| mongodb.metrics.storage.search.requests | The number of times mongod has searched for available record allocations. | long | counter |
| mongodb.metrics.storage.search.scanned | The number of available record allocations mongod has searched. | long | counter |
| mongodb.metrics.ttl.deleted_documents.count | The total number of documents deleted from collections with a ttl index. | long | counter |
| mongodb.metrics.ttl.passes.count | The number of times the background process removes documents from collections with a ttl index. | long | counter |
| service.address | Address where data about this service was collected from. This should be a URI, network address (ipv4:port or [ipv6]:port) or a resource path (sockets). | keyword |
The replstatus dataset collects status of the replica set.
It requires the following privileges, which is covered by the clusterMonitor role:
- find/listCollections action on the local database resource
- collStats action on the local.oplog.rs collection resource
- replSetGetStatus action on cluster resource
Example
{
    "@timestamp": "2020-06-29T21:20:51.457Z",
    "agent": {
        "ephemeral_id": "9f6fc260-82b5-4630-95d8-df64f1379b55",
        "id": "2281e192-85d5-4d68-b90a-36a31df7b29a",
        "name": "KaiyanMacBookPro",
        "type": "metricbeat",
        "version": "8.0.0"
    },
    "ecs": {
        "version": "8.11.0"
    },
    "event": {
        "dataset": "mongodb.replstatus",
        "duration": 1962467,
        "module": "mongodb"
    },
    "metricset": {
        "name": "replstatus",
        "period": 10000
    },
    "mongodb": {
        "replstatus": {
            "members": {
                "arbiter": {
                    "count": 0
                },
                "down": {
                    "count": 0
                },
                "primary": {
                    "host": "22b4e1fb8197:27017",
                    "optime": 1550700559
                },
                "recovering": {
                    "count": 0
                },
                "rollback": {
                    "count": 0
                },
                "secondary": {
                    "count": 0
                },
                "startup2": {
                    "count": 0
                },
                "unhealthy": {
                    "count": 0
                },
                "unknown": {
                    "count": 0
                }
            },
            "oplog": {
                "first": {
                    "timestamp": 1550700557
                },
                "last": {
                    "timestamp": 1550700559
                },
                "size": {
                    "allocated": 40572728934,
                    "used": 180
                },
                "window": 2
            },
            "optimes": {
                "applied": 1550700559,
                "durable": 1550700559,
                "last_committed": 1550700559
            },
            "server_date": "2019-02-20T23:09:23.733+01:00",
            "set_name": "beats"
        }
    },
    "service": {
        "address": "localhost:27017",
        "type": "mongodb"
    }
}
The fields reported are:
ECS Field Reference
Please refer to the following document for detailed information on ECS fields.
Exported fields
| Field | Description | Type | Metric Type |
|---|---|---|---|
| @timestamp | Event timestamp. | date | |
| agent.id | keyword | ||
| cloud.account.id | The cloud account or organization id used to identify different entities in a multi-tenant environment. Examples: AWS account id, Google Cloud ORG Id, or other unique identifier. | keyword | |
| cloud.availability_zone | Availability zone in which this host is running. | keyword | |
| cloud.image.id | Image ID for the cloud instance. | keyword | |
| cloud.instance.id | Instance ID of the host machine. | keyword | |
| cloud.provider | Name of the cloud provider. Example values are aws, azure, gcp, or digitalocean. | keyword | |
| cloud.region | Region in which this host is running. | keyword | |
| container.id | Unique container id. | keyword | |
| data_stream.dataset | Data stream dataset. | constant_keyword | |
| data_stream.namespace | Data stream namespace. | constant_keyword | |
| data_stream.type | Data stream type. | constant_keyword | |
| event.dataset | Event dataset | constant_keyword | |
| event.module | Event module | constant_keyword | |
| host.containerized | If the host is a container. | boolean | |
| host.name | Name of the host. It can contain what hostname returns on Unix systems, the fully qualified domain name, or a name specified by the user. The sender decides which value to use. |
keyword | |
| host.os.build | OS build information. | keyword | |
| host.os.codename | OS codename, if any. | keyword | |
| mongodb.replstatus.headroom.max | Difference between primary's oplog window and the replication lag of the fastest secondary | long | gauge |
| mongodb.replstatus.headroom.min | Difference between primary's oplog window and the replication lag of the slowest secondary | long | gauge |
| mongodb.replstatus.lag.max | Difference between optime of primary and slowest secondary | long | gauge |
| mongodb.replstatus.lag.min | Difference between optime of primary and fastest secondary | long | gauge |
| mongodb.replstatus.members.arbiter.count | Count of arbiters | long | gauge |
| mongodb.replstatus.members.arbiter.hosts | List of arbiters hosts | keyword | |
| mongodb.replstatus.members.down.count | Count of down members |
long | gauge |
| mongodb.replstatus.members.down.hosts | List of down members hosts |
keyword | |
| mongodb.replstatus.members.primary.host | Host address of the primary | keyword | |
| mongodb.replstatus.members.primary.optime | Optime of primary | keyword | |
| mongodb.replstatus.members.recovering.count | Count of members in the recovering state |
long | gauge |
| mongodb.replstatus.members.recovering.hosts | List of recovering members hosts | keyword | |
| mongodb.replstatus.members.rollback.count | Count of members in the rollback state |
long | gauge |
| mongodb.replstatus.members.rollback.hosts | List of members in the rollback state |
keyword | |
| mongodb.replstatus.members.secondary.count | long | gauge | |
| mongodb.replstatus.members.secondary.hosts | List of secondary hosts | keyword | |
| mongodb.replstatus.members.secondary.optimes | Optimes of secondaries | keyword | |
| mongodb.replstatus.members.startup2.count | Count of members in the startup2 state |
long | gauge |
| mongodb.replstatus.members.startup2.hosts | List of initializing members hosts | keyword | |
| mongodb.replstatus.members.unhealthy.count | Count of unhealthy members | long | gauge |
| mongodb.replstatus.members.unhealthy.hosts | List of members' hosts with healthy = false | keyword | |
| mongodb.replstatus.members.unknown.count | Count of members with unknown state |
long | gauge |
| mongodb.replstatus.members.unknown.hosts | List of members' hosts in the unknown state |
keyword | |
| mongodb.replstatus.oplog.first.timestamp | Timestamp of the first (i.e. earliest) operation in the replstatus | long | gauge |
| mongodb.replstatus.oplog.last.timestamp | Timestamp of the last (i.e. latest) operation in the replstatus | long | gauge |
| mongodb.replstatus.oplog.size.allocated | The total amount of space used by the replstatus in bytes. | long | gauge |
| mongodb.replstatus.oplog.size.used | total amount of space allocated to the replstatus in bytes. | long | gauge |
| mongodb.replstatus.oplog.window | The difference between the first and last operation in the replstatus. | long | gauge |
| mongodb.replstatus.optimes.applied | Information, from the viewpoint of this member, regarding the most recent operation that has been applied to this member of the replica set. | long | gauge |
| mongodb.replstatus.optimes.durable | Information, from the viewpoint of this member, regarding the most recent operation that has been written to the journal of this member of the replica set. | long | gauge |
| mongodb.replstatus.optimes.last_committed | Information, from the viewpoint of this member, regarding the most recent operation that has been written to a majority of replica set members. | long | gauge |
| mongodb.replstatus.server_date | Reflects the current time according to the server that processed the replSetGetStatus command. | date | |
| mongodb.replstatus.set_name | The name of the replica set. | keyword | |
| service.address | Address where data about this service was collected from. This should be a URI, network address (ipv4:port or [ipv6]:port) or a resource path (sockets). | keyword |
The status returns a document that provides an overview of the database's state.
It requires the following privileges, which is covered by the clusterMonitor role:
- serverStatus action on cluster resource
Example
{
    "@timestamp": "2022-10-20T10:55:04.336Z",
    "agent": {
        "ephemeral_id": "65facf45-207f-436e-a597-e3dc3c1fcb39",
        "hostname": "docker-fleet-agent",
        "id": "a326ccf1-3f91-4412-bc97-215ea856cd16",
        "name": "docker-fleet-agent",
        "type": "metricbeat",
        "version": "7.14.0"
    },
    "data_stream": {
        "dataset": "mongodb.status",
        "namespace": "ep",
        "type": "metrics"
    },
    "ecs": {
        "version": "8.11.0"
    },
    "elastic_agent": {
        "id": "a326ccf1-3f91-4412-bc97-215ea856cd16",
        "snapshot": false,
        "version": "7.14.0"
    },
    "event": {
        "agent_id_status": "verified",
        "dataset": "mongodb.status",
        "duration": 3357750,
        "ingested": "2022-10-20T10:55:07.900758542Z",
        "module": "mongodb"
    },
    "host": {
        "architecture": "aarch64",
        "containerized": false,
        "hostname": "docker-fleet-agent",
        "id": "2347a1bd8a3945949da8ab5c29f60774",
        "ip": [
            "172.18.0.7"
        ],
        "mac": [
            "02-42-AC-1F-00-07"
        ],
        "name": "docker-fleet-agent",
        "os": {
            "codename": "AltArch",
            "family": "redhat",
            "kernel": "5.10.124-linuxkit",
            "name": "CentOS Linux",
            "platform": "centos",
            "type": "linux",
            "version": "7 (AltArch)"
        }
    },
    "metricset": {
        "name": "status",
        "period": 10000
    },
    "mongodb": {
        "status": {
            "asserts": {
                "msg": 0,
                "regular": 0,
                "rollovers": 0,
                "user": 0,
                "warning": 0
            },
            "connections": {
                "available": 838859,
                "current": 1,
                "total_created": 15
            },
            "extra_info": {
                "heap_usage": {},
                "page_faults": 0
            },
            "global_lock": {
                "active_clients": {
                    "readers": 0,
                    "total": 8,
                    "writers": 0
                },
                "current_queue": {
                    "readers": 0,
                    "total": 0,
                    "writers": 0
                },
                "total_time": {
                    "us": 14210000
                }
            },
            "local_time": "2022-10-20T10:55:04.338Z",
            "locks": {
                "collection": {
                    "acquire": {
                        "count": {
                            "W": 1,
                            "r": 20
                        }
                    },
                    "deadlock": {},
                    "wait": {}
                },
                "database": {
                    "acquire": {
                        "count": {
                            "R": 1,
                            "W": 8,
                            "r": 34
                        }
                    },
                    "deadlock": {},
                    "wait": {}
                },
                "global": {
                    "acquire": {
                        "count": {
                            "W": 2,
                            "r": 108,
                            "w": 8
                        }
                    },
                    "deadlock": {},
                    "wait": {}
                },
                "meta_data": {
                    "acquire": {
                        "count": {
                            "w": 1
                        }
                    },
                    "deadlock": {},
                    "wait": {}
                },
                "oplog": {
                    "acquire": {
                        "count": {
                            "r": 14
                        }
                    },
                    "deadlock": {},
                    "wait": {}
                }
            },
            "memory": {
                "bits": 64,
                "mapped": {
                    "mb": 0
                },
                "mapped_with_journal": {
                    "mb": 0
                },
                "resident": {
                    "mb": 62
                },
                "virtual": {
                    "mb": 952
                }
            },
            "network": {
                "in": {
                    "bytes": 10318
                },
                "out": {
                    "bytes": 380215
                },
                "requests": 223
            },
            "ops": {
                "counters": {
                    "command": 112,
                    "delete": 0,
                    "getmore": 0,
                    "insert": 0,
                    "query": 1,
                    "update": 0
                },
                "latencies": {
                    "commands": {
                        "count": 111,
                        "latency": 5089
                    },
                    "reads": {
                        "count": 0,
                        "latency": 0
                    },
                    "writes": {
                        "count": 0,
                        "latency": 0
                    }
                },
                "replicated": {
                    "command": 0,
                    "delete": 0,
                    "getmore": 0,
                    "insert": 0,
                    "query": 0,
                    "update": 0
                }
            },
            "storage_engine": {
                "name": "wiredTiger"
            },
            "uptime": {
                "ms": 14204
            },
            "wired_tiger": {
                "cache": {
                    "dirty": {
                        "bytes": 21104
                    },
                    "maximum": {
                        "bytes": 3578789888
                    },
                    "pages": {
                        "evicted": 0,
                        "read": 0,
                        "write": 0
                    },
                    "used": {
                        "bytes": 22756
                    }
                },
                "concurrent_transactions": {
                    "read": {
                        "available": 128,
                        "out": 0,
                        "total_tickets": 128
                    },
                    "write": {
                        "available": 128,
                        "out": 0,
                        "total_tickets": 128
                    }
                },
                "log": {
                    "flushes": 142,
                    "max_file_size": {
                        "bytes": 104857600
                    },
                    "scans": 0,
                    "size": {
                        "bytes": 33554432
                    },
                    "syncs": 12,
                    "write": {
                        "bytes": 14336
                    },
                    "writes": 40
                }
            }
        }
    },
    "process": {
        "name": "mongod"
    },
    "service": {
        "address": "mongodb://elastic-package-service-mongodb-1",
        "type": "mongodb",
        "version": "3.4.24"
    }
}
The fields reported are:
ECS Field Reference
Please refer to the following document for detailed information on ECS fields.
Exported fields
| Field | Description | Type | Metric Type |
|---|---|---|---|
| @timestamp | Event timestamp. | date | |
| agent.id | keyword | ||
| cloud.account.id | The cloud account or organization id used to identify different entities in a multi-tenant environment. Examples: AWS account id, Google Cloud ORG Id, or other unique identifier. | keyword | |
| cloud.availability_zone | Availability zone in which this host is running. | keyword | |
| cloud.image.id | Image ID for the cloud instance. | keyword | |
| cloud.instance.id | Instance ID of the host machine. | keyword | |
| cloud.provider | Name of the cloud provider. Example values are aws, azure, gcp, or digitalocean. | keyword | |
| cloud.region | Region in which this host is running. | keyword | |
| container.id | Unique container id. | keyword | |
| data_stream.dataset | Data stream dataset. | constant_keyword | |
| data_stream.namespace | Data stream namespace. | constant_keyword | |
| data_stream.type | Data stream type. | constant_keyword | |
| event.dataset | Event dataset | constant_keyword | |
| event.module | Event module | constant_keyword | |
| host.containerized | If the host is a container. | boolean | |
| host.name | Name of the host. It can contain what hostname returns on Unix systems, the fully qualified domain name, or a name specified by the user. The sender decides which value to use. |
keyword | |
| host.os.build | OS build information. | keyword | |
| host.os.codename | OS codename, if any. | keyword | |
| mongodb.status.asserts.msg | Number of msg assertions produced by the server. | long | counter |
| mongodb.status.asserts.regular | Number of regular assertions produced by the server. | long | counter |
| mongodb.status.asserts.rollovers | Number of rollovers assertions produced by the server. | long | counter |
| mongodb.status.asserts.user | Number of user assertions produced by the server. | long | counter |
| mongodb.status.asserts.warning | Number of warning assertions produced by the server. | long | counter |
| mongodb.status.background_flushing.average.ms | The average time spent flushing to disk per flush event. | long | gauge |
| mongodb.status.background_flushing.flushes | A counter that collects the number of times the database has flushed all writes to disk. | long | counter |
| mongodb.status.background_flushing.last.ms | The amount of time, in milliseconds, that the last flush operation took to complete. | long | gauge |
| mongodb.status.background_flushing.last_finished | A timestamp of the last completed flush operation. | date | |
| mongodb.status.background_flushing.total.ms | The total amount of time in milliseconds that the mongod processes have spent writing (i.e. flushing) data to disk. Because this is an absolute value, consider the value of flushes and average_ms to provide better context for this datum. |
long | gauge |
| mongodb.status.connections.available | The number of unused available incoming connections the database can provide. | long | gauge |
| mongodb.status.connections.current | The number of connections to the database server from clients. This number includes the current shell session. Consider the value of available to add more context to this datum. |
long | gauge |
| mongodb.status.connections.total_created | A count of all incoming connections created to the server. This number includes connections that have since closed. | long | counter |
| mongodb.status.extra_info.heap_usage.bytes | The total size in bytes of heap space used by the database process. Only available on Unix/Linux. | long | gauge |
| mongodb.status.extra_info.page_faults | The total number of page faults that require disk operations. Page faults refer to operations that require the database server to access data that isn't available in active memory. | long | counter |
| mongodb.status.global_lock.active_clients.readers | The number of the active client connections performing read operations. | long | gauge |
| mongodb.status.global_lock.active_clients.total | Total number of the active client connections performing read or write operations. | long | gauge |
| mongodb.status.global_lock.active_clients.writers | The number of the active client connections performing write operations. | long | gauge |
| mongodb.status.global_lock.current_queue.readers | The number of operations that are currently queued and waiting for the read lock. | long | gauge |
| mongodb.status.global_lock.current_queue.total | The total number of operations queued waiting for the lock (i.e., the sum of current_queue.readers and current_queue.writers). | long | gauge |
| mongodb.status.global_lock.current_queue.writers | The number of operations that are currently queued and waiting for the write lock. | long | gauge |
| mongodb.status.global_lock.total_time.us | The time, in microseconds, since the database last started and created the globalLock. This is roughly equivalent to total server uptime. | long | gauge |
| mongodb.status.journaling.commits | The number of transactions written to the journal during the last journal group commit interval. | long | counter |
| mongodb.status.journaling.commits_in_write_lock | Count of the commits that occurred while a write lock was held. Commits in a write lock indicate a MongoDB node under a heavy write load and call for further diagnosis. | long | counter |
| mongodb.status.journaling.compression | The compression ratio of the data written to the journal. | long | gauge |
| mongodb.status.journaling.early_commits | The number of times MongoDB requested a commit before the scheduled journal group commit interval. | long | counter |
| mongodb.status.journaling.journaled.mb | The amount of data in megabytes (MB) written to journal during the last journal group commit interval. | long | gauge |
| mongodb.status.journaling.times.commits.ms | The amount of time spent for commits. | long | gauge |
| mongodb.status.journaling.times.commits_in_write_lock.ms | The amount of time spent for commits that occurred while a write lock was held. | long | gauge |
| mongodb.status.journaling.times.dt.ms | The amount of time over which MongoDB collected the times data. Use this field to provide context to the other times field values. | long | gauge |
| mongodb.status.journaling.times.prep_log_buffer.ms | The amount of time spent preparing to write to the journal. Smaller values indicate better journal performance. | long | gauge |
| mongodb.status.journaling.times.remap_private_view.ms | The amount of time spent remapping copy-on-write memory mapped views. Smaller values indicate better journal performance. | long | gauge |
| mongodb.status.journaling.times.write_to_data_files.ms | The amount of time spent writing to data files after journaling. File system speeds and device interfaces can affect performance. | long | gauge |
| mongodb.status.journaling.times.write_to_journal.ms | The amount of time spent actually writing to the journal. File system speeds and device interfaces can affect performance. | long | gauge |
| mongodb.status.journaling.write_to_data_files.mb | The amount of data in megabytes (MB) written from journal to the data files during the last journal group commit interval. | long | gauge |
| mongodb.status.local_time | Local time as reported by the MongoDB instance. | date | |
| mongodb.status.locks.collection.acquire.count.R | long | counter | |
| mongodb.status.locks.collection.acquire.count.W | long | counter | |
| mongodb.status.locks.collection.acquire.count.r | long | counter | |
| mongodb.status.locks.collection.acquire.count.w | long | counter | |
| mongodb.status.locks.collection.deadlock.count.R | long | counter | |
| mongodb.status.locks.collection.deadlock.count.W | long | counter | |
| mongodb.status.locks.collection.deadlock.count.r | long | counter | |
| mongodb.status.locks.collection.deadlock.count.w | long | counter | |
| mongodb.status.locks.collection.wait.count.R | long | counter | |
| mongodb.status.locks.collection.wait.count.W | long | counter | |
| mongodb.status.locks.collection.wait.count.r | long | counter | |
| mongodb.status.locks.collection.wait.count.w | long | counter | |
| mongodb.status.locks.collection.wait.us.R | long | gauge | |
| mongodb.status.locks.collection.wait.us.W | long | gauge | |
| mongodb.status.locks.collection.wait.us.r | long | gauge | |
| mongodb.status.locks.collection.wait.us.w | long | gauge | |
| mongodb.status.locks.database.acquire.count.R | long | counter | |
| mongodb.status.locks.database.acquire.count.W | long | counter | |
| mongodb.status.locks.database.acquire.count.r | long | counter | |
| mongodb.status.locks.database.acquire.count.w | long | counter | |
| mongodb.status.locks.database.deadlock.count.R | long | counter | |
| mongodb.status.locks.database.deadlock.count.W | long | counter | |
| mongodb.status.locks.database.deadlock.count.r | long | counter | |
| mongodb.status.locks.database.deadlock.count.w | long | counter | |
| mongodb.status.locks.database.wait.count.R | long | counter | |
| mongodb.status.locks.database.wait.count.W | long | counter | |
| mongodb.status.locks.database.wait.count.r | long | counter | |
| mongodb.status.locks.database.wait.count.w | long | counter | |
| mongodb.status.locks.database.wait.us.R | long | gauge | |
| mongodb.status.locks.database.wait.us.W | long | gauge | |
| mongodb.status.locks.database.wait.us.r | long | gauge | |
| mongodb.status.locks.database.wait.us.w | long | gauge | |
| mongodb.status.locks.global.acquire.count.R | long | counter | |
| mongodb.status.locks.global.acquire.count.W | long | counter | |
| mongodb.status.locks.global.acquire.count.r | long | counter | |
| mongodb.status.locks.global.acquire.count.w | long | counter | |
| mongodb.status.locks.global.deadlock.count.R | long | counter | |
| mongodb.status.locks.global.deadlock.count.W | long | counter | |
| mongodb.status.locks.global.deadlock.count.r | long | counter | |
| mongodb.status.locks.global.deadlock.count.w | long | counter | |
| mongodb.status.locks.global.wait.count.R | long | counter | |
| mongodb.status.locks.global.wait.count.W | long | counter | |
| mongodb.status.locks.global.wait.count.r | long | counter | |
| mongodb.status.locks.global.wait.count.w | long | counter | |
| mongodb.status.locks.global.wait.us.R | long | gauge | |
| mongodb.status.locks.global.wait.us.W | long | gauge | |
| mongodb.status.locks.global.wait.us.r | long | gauge | |
| mongodb.status.locks.global.wait.us.w | long | gauge | |
| mongodb.status.locks.meta_data.acquire.count.R | long | counter | |
| mongodb.status.locks.meta_data.acquire.count.W | long | counter | |
| mongodb.status.locks.meta_data.acquire.count.r | long | counter | |
| mongodb.status.locks.meta_data.acquire.count.w | long | counter | |
| mongodb.status.locks.meta_data.deadlock.count.R | long | counter | |
| mongodb.status.locks.meta_data.deadlock.count.W | long | counter | |
| mongodb.status.locks.meta_data.deadlock.count.r | long | counter | |
| mongodb.status.locks.meta_data.deadlock.count.w | long | counter | |
| mongodb.status.locks.meta_data.wait.count.R | long | counter | |
| mongodb.status.locks.meta_data.wait.count.W | long | counter | |
| mongodb.status.locks.meta_data.wait.count.r | long | counter | |
| mongodb.status.locks.meta_data.wait.count.w | long | counter | |
| mongodb.status.locks.meta_data.wait.us.R | long | gauge | |
| mongodb.status.locks.meta_data.wait.us.W | long | gauge | |
| mongodb.status.locks.meta_data.wait.us.r | long | gauge | |
| mongodb.status.locks.meta_data.wait.us.w | long | gauge | |
| mongodb.status.locks.oplog.acquire.count.R | long | counter | |
| mongodb.status.locks.oplog.acquire.count.W | long | counter | |
| mongodb.status.locks.oplog.acquire.count.r | long | counter | |
| mongodb.status.locks.oplog.acquire.count.w | long | counter | |
| mongodb.status.locks.oplog.deadlock.count.R | long | counter | |
| mongodb.status.locks.oplog.deadlock.count.W | long | counter | |
| mongodb.status.locks.oplog.deadlock.count.r | long | counter | |
| mongodb.status.locks.oplog.deadlock.count.w | long | counter | |
| mongodb.status.locks.oplog.wait.count.R | long | counter | |
| mongodb.status.locks.oplog.wait.count.W | long | counter | |
| mongodb.status.locks.oplog.wait.count.r | long | counter | |
| mongodb.status.locks.oplog.wait.count.w | long | counter | |
| mongodb.status.locks.oplog.wait.us.R | long | gauge | |
| mongodb.status.locks.oplog.wait.us.W | long | gauge | |
| mongodb.status.locks.oplog.wait.us.r | long | gauge | |
| mongodb.status.locks.oplog.wait.us.w | long | gauge | |
| mongodb.status.memory.bits | Either 64 or 32, depending on which target architecture was specified during the mongod compilation process. | long | |
| mongodb.status.memory.mapped.mb | The amount of mapped memory, in megabytes (MB), used by the database. Because MongoDB uses memory-mapped files, this value is likely to be to be roughly equivalent to the total size of your database or databases. | long | gauge |
| mongodb.status.memory.mapped_with_journal.mb | The amount of mapped memory, in megabytes (MB), including the memory used for journaling. | long | gauge |
| mongodb.status.memory.resident.mb | The amount of RAM, in megabytes (MB), currently used by the database process. | long | gauge |
| mongodb.status.memory.virtual.mb | The amount, in megabytes (MB), of virtual memory used by the mongod process. | long | gauge |
| mongodb.status.network.in.bytes | The amount of network traffic, in bytes, received by this database. | long | gauge |
| mongodb.status.network.out.bytes | The amount of network traffic, in bytes, sent from this database. | long | gauge |
| mongodb.status.network.requests | The total number of requests received by the server. | long | counter |
| mongodb.status.ops.counters.command | The total number of commands issued to the database since the mongod instance last started. | long | counter |
| mongodb.status.ops.counters.delete | The total number of delete operations received since the mongod instance last started. | long | counter |
| mongodb.status.ops.counters.getmore | The total number of getmore operations received since the mongod instance last started. | long | counter |
| mongodb.status.ops.counters.insert | The total number of insert operations received since the mongod instance last started. | long | counter |
| mongodb.status.ops.counters.query | The total number of queries received since the mongod instance last started. | long | counter |
| mongodb.status.ops.counters.update | The total number of update operations received since the mongod instance last started. | long | counter |
| mongodb.status.ops.latencies.commands.count | Total number of commands performed on the collection since startup. | long | counter |
| mongodb.status.ops.latencies.commands.latency | Total combined latency in microseconds. | long | gauge |
| mongodb.status.ops.latencies.reads.count | Total number of read operations performed on the collection since startup. | long | counter |
| mongodb.status.ops.latencies.reads.latency | Total combined latency in microseconds. | long | gauge |
| mongodb.status.ops.latencies.writes.count | Total number of write operations performed on the collection since startup. | long | counter |
| mongodb.status.ops.latencies.writes.latency | Total combined latency in microseconds. | long | gauge |
| mongodb.status.ops.replicated.command | The total number of replicated commands issued to the database since the mongod instance last started. | long | counter |
| mongodb.status.ops.replicated.delete | The total number of replicated delete operations received since the mongod instance last started. | long | counter |
| mongodb.status.ops.replicated.getmore | The total number of replicated getmore operations received since the mongod instance last started. | long | counter |
| mongodb.status.ops.replicated.insert | The total number of replicated insert operations received since the mongod instance last started. | long | counter |
| mongodb.status.ops.replicated.query | The total number of replicated queries received since the mongod instance last started. | long | counter |
| mongodb.status.ops.replicated.update | The total number of replicated update operations received since the mongod instance last started. | long | counter |
| mongodb.status.storage_engine.name | A string that represents the name of the current storage engine. | keyword | |
| mongodb.status.uptime.ms | Instance uptime in milliseconds. | long | gauge |
| mongodb.status.wired_tiger.cache.dirty.bytes | Size in bytes of the dirty data in the cache. | long | gauge |
| mongodb.status.wired_tiger.cache.maximum.bytes | Maximum cache size. | long | gauge |
| mongodb.status.wired_tiger.cache.pages.evicted | Number of pages evicted from the cache. | long | counter |
| mongodb.status.wired_tiger.cache.pages.read | Number of pages read into the cache. | long | counter |
| mongodb.status.wired_tiger.cache.pages.write | Number of pages written from the cache. | long | counter |
| mongodb.status.wired_tiger.cache.used.bytes | Size in byte of the data currently in cache. | long | gauge |
| mongodb.status.wired_tiger.concurrent_transactions.read.available | Number of concurrent read tickets available. | long | gauge |
| mongodb.status.wired_tiger.concurrent_transactions.read.out | Number of concurrent read transaction in progress. | long | gauge |
| mongodb.status.wired_tiger.concurrent_transactions.read.total_tickets | Number of total read tickets. | long | gauge |
| mongodb.status.wired_tiger.concurrent_transactions.write.available | Number of concurrent write tickets available. | long | gauge |
| mongodb.status.wired_tiger.concurrent_transactions.write.out | Number of concurrent write transaction in progress. | long | gauge |
| mongodb.status.wired_tiger.concurrent_transactions.write.total_tickets | Number of total write tickets. | long | gauge |
| mongodb.status.wired_tiger.log.flushes | Number of flush operations. | long | counter |
| mongodb.status.wired_tiger.log.max_file_size.bytes | Maximum file size. | long | gauge |
| mongodb.status.wired_tiger.log.scans | Number of scan operations. | long | counter |
| mongodb.status.wired_tiger.log.size.bytes | Total log size in bytes. | long | gauge |
| mongodb.status.wired_tiger.log.syncs | Number of sync operations. | long | counter |
| mongodb.status.wired_tiger.log.write.bytes | Number of bytes written into the log. | long | counter |
| mongodb.status.wired_tiger.log.writes | Number of write operations. | long | counter |
| mongodb.status.write_backs_queued | True when there are operations from a mongos instance queued for retrying. | boolean | |
| service.address | Address of the machine where the service is running. | keyword |
Alert rule templates provide pre-defined configurations for creating alert rules in Kibana.
For more information, refer to the Elastic documentation.
Alert rule templates require Elastic Stack version 9.2.0 or later.
The following alert rule templates are available:
[MongoDB] WiredTiger cache pressure
[MongoDB Availability] High connection usage
[MongoDB] Oplog headroom critically low
[MongoDB] Replica member down
[MongoDB] High replication lag
[MongoDB] Unhealthy replica members
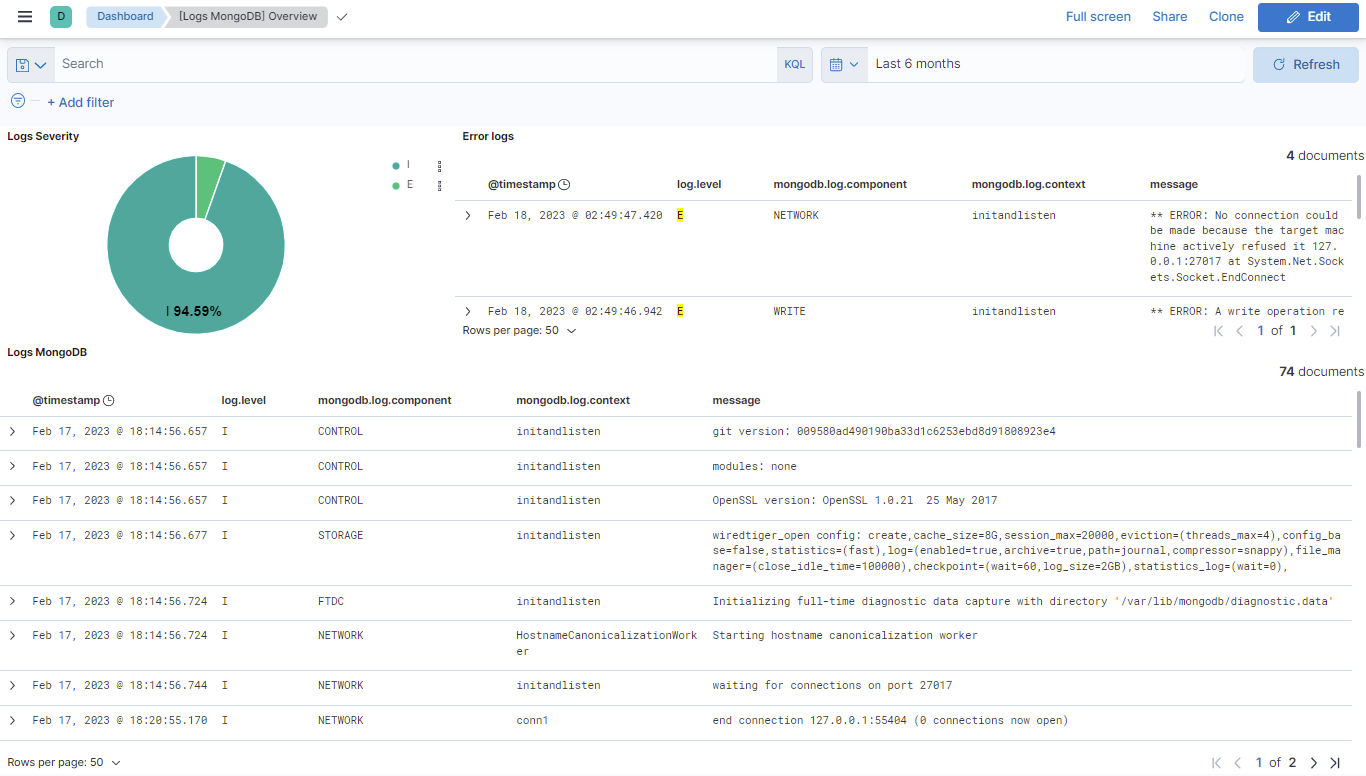
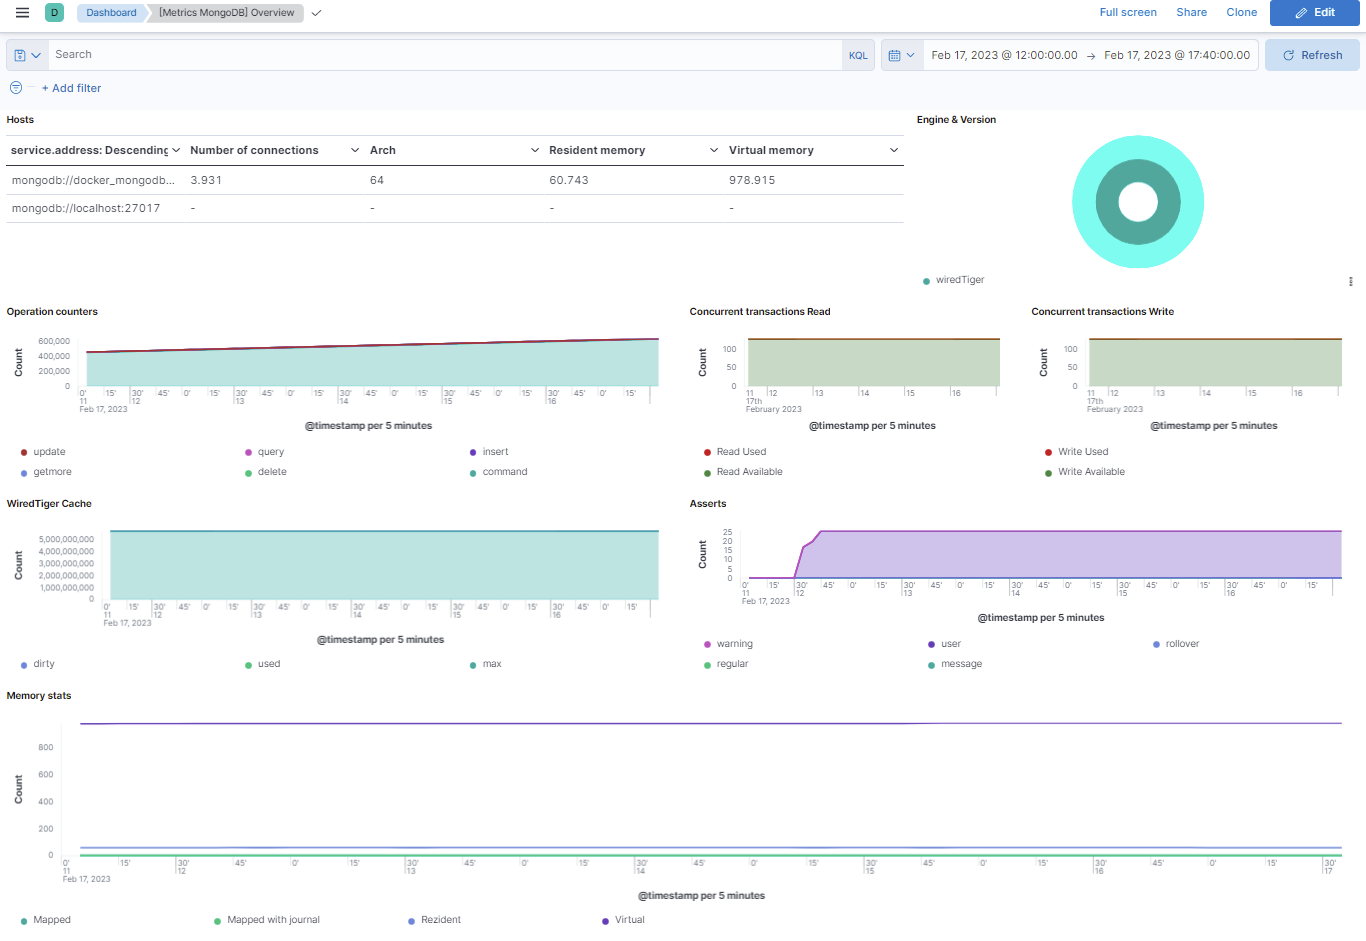
This integration includes one or more Kibana dashboards that visualizes the data collected by the integration. The screenshots below illustrate how the ingested data is displayed.
Changelog
| Version | Details | Minimum Kibana version |
|---|---|---|
| 1.24.0 | Enhancement (View pull request) Update README with Alerting Rule Template. |
9.2.1 8.19.0 |
| 1.23.0 | Enhancement (View pull request) Add alerting rule templates. |
9.2.1 8.19.0 |
| 1.22.0 | Enhancement (View pull request) Allow @custom pipeline access to event.original without setting preserve_original_event. |
9.0.0 8.13.0 |
| 1.21.0 | Enhancement (View pull request) Add a flag fips_compatible to control whether the package is allowed in the ECH FedRAMP High environment. |
9.0.0 8.13.0 |
| 1.20.0 | Enhancement (View pull request) Increase default polling period from 10s to 60s. |
9.0.0 8.13.0 |
| 1.19.1 | Bug fix (View pull request) Updated SSL description to be uniform and to include links to documentation. |
9.0.0 8.13.0 |
| 1.19.0 | Enhancement (View pull request) Add support for Kibana 9.0.0. |
9.0.0 8.13.0 |
| 1.18.0 | Enhancement (View pull request) Allow the usage of deprecated log input and support for stack 9.0 |
8.13.0 |
| 1.17.0 | Enhancement (View pull request) Add support of extra collstats metrics (size, count, avgObjSize, storageSize, totalIndexSize, totalSize, max, nindexes) |
8.13.0 |
| 1.16.0 | Enhancement (View pull request) Add processor support for collstats, dbstats, metrics, replstatus and status data streams. |
8.13.0 |
| 1.15.0 | Enhancement (View pull request) ECS version updated to 8.11.0. Update the kibana constraint to ^8.13.0. Modified the field definitions to remove ECS fields made redundant by the ecs@mappings component template. |
8.13.0 |
| 1.14.0 | Enhancement (View pull request) Add global filter on data_stream.dataset to improve performance. |
8.12.2 |
| 1.13.3 | Enhancement (View pull request) Update README with support of LDAP authentication. |
8.12.2 |
| 1.13.2 | Bug fix (View pull request) Update the Kibana version to fix the disk space exhaustion. |
8.12.2 |
| 1.13.1 | Bug fix (View pull request) Update the Kibana version condition for multihost fix support and add MongoDB hosts field examples to the documentation. |
8.9.0 |
| 1.13.0 | Enhancement (View pull request) Enable 'secret' for the sensitive fields, supported from 8.12. |
8.8.0 |
| 1.12.3 | Enhancement (View pull request) Update metrics datastreams compatibility version in docs. |
8.8.0 |
| 1.12.2 | Enhancement (View pull request) Improve wording on milliseconds. |
8.8.0 |
| 1.12.1 | Bug fix (View pull request) Add null and ignore_missing check to handle event.original field. |
8.8.0 |
| 1.12.0 | Enhancement (View pull request) Update the package format_version to 3.0.0. |
8.8.0 |
| 1.11.0 | Enhancement (View pull request) Enable time series data streams for the metrics datasets. This dramatically reduces storage for metrics and is expected to progressively improve query performance. For more details, see https://www.elastic.co/guide/en/elasticsearch/reference/current/tsds.html. |
8.8.0 |
| 1.10.2 | Bug fix (View pull request) Fix mongodb logs overview dashboard and update filters for panels. |
8.1.0 |
| 1.10.1 | Bug fix (View pull request) Fix mongodb logs overview dashboard and default log path |
8.1.0 |
| 1.10.0 | Enhancement (View pull request) Rename ownership from obs-service-integrations to obs-infraobs-integrations |
8.1.0 |
| 1.9.9 | Enhancement (View pull request) Added metric_type fields for replstatus datastream. |
8.1.0 |
| 1.9.8 | Enhancement (View pull request) Added dimension fields for replstatus datastream to support TSDB. |
— |
| 1.9.7 | Enhancement (View pull request) Added metric_type fields for status datastream. |
8.1.0 |
| 1.9.6 | Enhancement (View pull request) Added dimension fields for status datastream to support TSDB. |
8.1.0 |
| 1.9.5 | Enhancement (View pull request) Added metric_type fields for metrics datastream. |
8.1.0 |
| 1.9.4 | Enhancement (View pull request) Added dimensions fields for metrics datastream to enable TSDB. |
8.1.0 |
| 1.9.3 | Enhancement (View pull request) Added metric_type fields for dbstats datastream. |
8.1.0 |
| 1.9.2 | Enhancement (View pull request) Added dimension fields for dbstats datastream to support TSDB. |
8.1.0 |
| 1.9.1 | Enhancement (View pull request) Added metric_type fields for collstats datastream. |
8.1.0 |
| 1.9.0 | Enhancement (View pull request) Added dimensions fields for collStats datastream to enable TSDB. |
8.1.0 |
| 1.8.0 | Enhancement (View pull request) Migrate Logs Overview dashboard visualizations to lens. |
8.1.0 |
| 1.7.0 | Enhancement (View pull request) Migrate Metrics Overview dashboard visualizations to lens. |
8.1.0 |
| 1.6.1 | Enhancement (View pull request) Added categories and/or subcategories. |
8.0.0 7.14.0 |
| 1.6.0 | Enhancement (View pull request) Update ECS version to 8.5.1 |
8.0.0 7.14.0 |
| 1.5.2 | Bug fix (View pull request) Add SSL mapping in handlebar for all datastream |
8.0.0 7.14.0 |
| 1.5.1 | Bug fix (View pull request) Added remove processors in ingest pipeline yaml |
8.0.0 7.14.0 |
| 1.5.0 | Enhancement (View pull request) Add system test |
8.0.0 7.14.0 |
| 1.4.0 | Enhancement (View pull request) Added infrastructure category. |
8.0.0 7.14.0 |
| 1.3.4 | Bug fix (View pull request) Added FQDN field for log datastream |
8.0.0 7.14.0 |
| 1.3.3 | Bug fix (View pull request) Add username and password for the template file |
8.0.0 7.14.0 |
| 1.3.2 | Enhancement (View pull request) Add documentation for multi-fields |
8.0.0 7.14.0 |
| 1.3.1 | Bug fix (View pull request) Fix username and password templates |
8.0.0 7.14.0 |
| 1.3.0 | Enhancement (View pull request) Update to ECS 8.0 |
— |
| 1.2.0 | Enhancement (View pull request) Release mongodb package for v8.0.0 |
8.0.0 7.14.0 |
| 1.1.2 | Enhancement (View pull request) Uniform with guidelines |
— |
| 1.1.1 | Bug fix (View pull request) Fix logic that checks for the 'forwarded' tag |
— |
| 1.1.0 | Enhancement (View pull request) Update to ECS 1.12.0 |
7.14.0 |
| 1.0.0 | Enhancement (View pull request) Release MongoDB as GA |
— |
| 0.7.0 | Enhancement (View pull request) Update integration description |
— |
| 0.6.0 | Enhancement (View pull request) Set "event.module" and "event.dataset" |
— |
| 0.5.0 | Enhancement (View pull request) Store log attributes included in JSON logs Enhancement (View pull request) Enable ECS dependency |
— |
| 0.4.0 | Enhancement (View pull request) Add support for logs in JSON format |
— |
| 0.3.0 | Enhancement (View pull request) update to ECS 1.10.0 and add event.original option |
— |
| 0.2.10 | Bug fix (View pull request) Fix Kibana search panel |
— |
| 0.2.9 | Enhancement (View pull request) Updating package owner Enhancement (View pull request) update to ECS 1.9.0 |
— |
| 0.2.8 | Bug fix (View pull request) Correct sample event file. |
— |
| 0.1.0 | Enhancement (View pull request) initial release |
— |