Anthropic Metrics
Elastic Cloud Serverless projects are autoscaled environments, fully managed by Elastic and available on Elastic Cloud. Availability This functionality is in technical preview and is ready for evaluation. Use with caution in production; it is not recommended for mission-critical workloads. Elastic will work to fix any issues, but features in technical preview are not subject to the support SLA of official GA features. Specific Support terms apply. Elastic Cloud Serverless projects are autoscaled environments, fully managed by Elastic and available on Elastic Cloud. Availability This functionality is in technical preview and is ready for evaluation. Use with caution in production; it is not recommended for mission-critical workloads. Elastic will work to fix any issues, but features in technical preview are not subject to the support SLA of official GA features. Specific Support terms apply. The Elastic Stack includes Elastic's core products such as Elasticsearch, Kibana, Logstash, and Beats. Availability This functionality is in technical preview and is ready for evaluation. Use with caution in production; it is not recommended for mission-critical workloads. Elastic will work to fix any issues, but features in technical preview are not subject to the support SLA of official GA features. Specific Support terms apply. Unless stated otherwise on the page, this functionality is available when your Elastic Stack is deployed on Elastic Cloud Hosted, Elastic Cloud Enterprise, Elastic Cloud on Kubernetes, and self-managed environments. This documentation corresponds to the latest patch available for each minor version. If you're not using the latest patch, check the release notes for changes.
Serverless Observability
Preview
Preview
Serverless Security
Preview
Preview
Stack
Preview
9.4+
Preview since 9.4
| Version | 0.5.0 Availability Preview This functionality is in technical preview and is ready for evaluation. Use with caution in production; it is not recommended for mission-critical workloads. Elastic will work to fix any issues, but features in technical preview are not subject to the support SLA of official GA features. Specific Support terms apply. (View all) |
| Managed integration release status | Availability Beta This functionality is in beta and is not ready for production usage. For beta features, the design and code is less mature than official GA features and is being provided as-is with no warranties. Beta features are not subject to the support SLA of official GA features. Specific Support terms apply. |
| Subscription level What's this? |
Basic |
| Developed by What's this? |
Elastic |
| Ingestion method(s) | API |
| Minimum Kibana version(s) | 9.4.0 |
You can use this integration as an Elastic Managed integration on Elastic Cloud Hosted deployments running this version or later.
To use pre-release integrations, go to the Integrations page in Kibana, scroll down, and toggle on the Display beta integrations option.
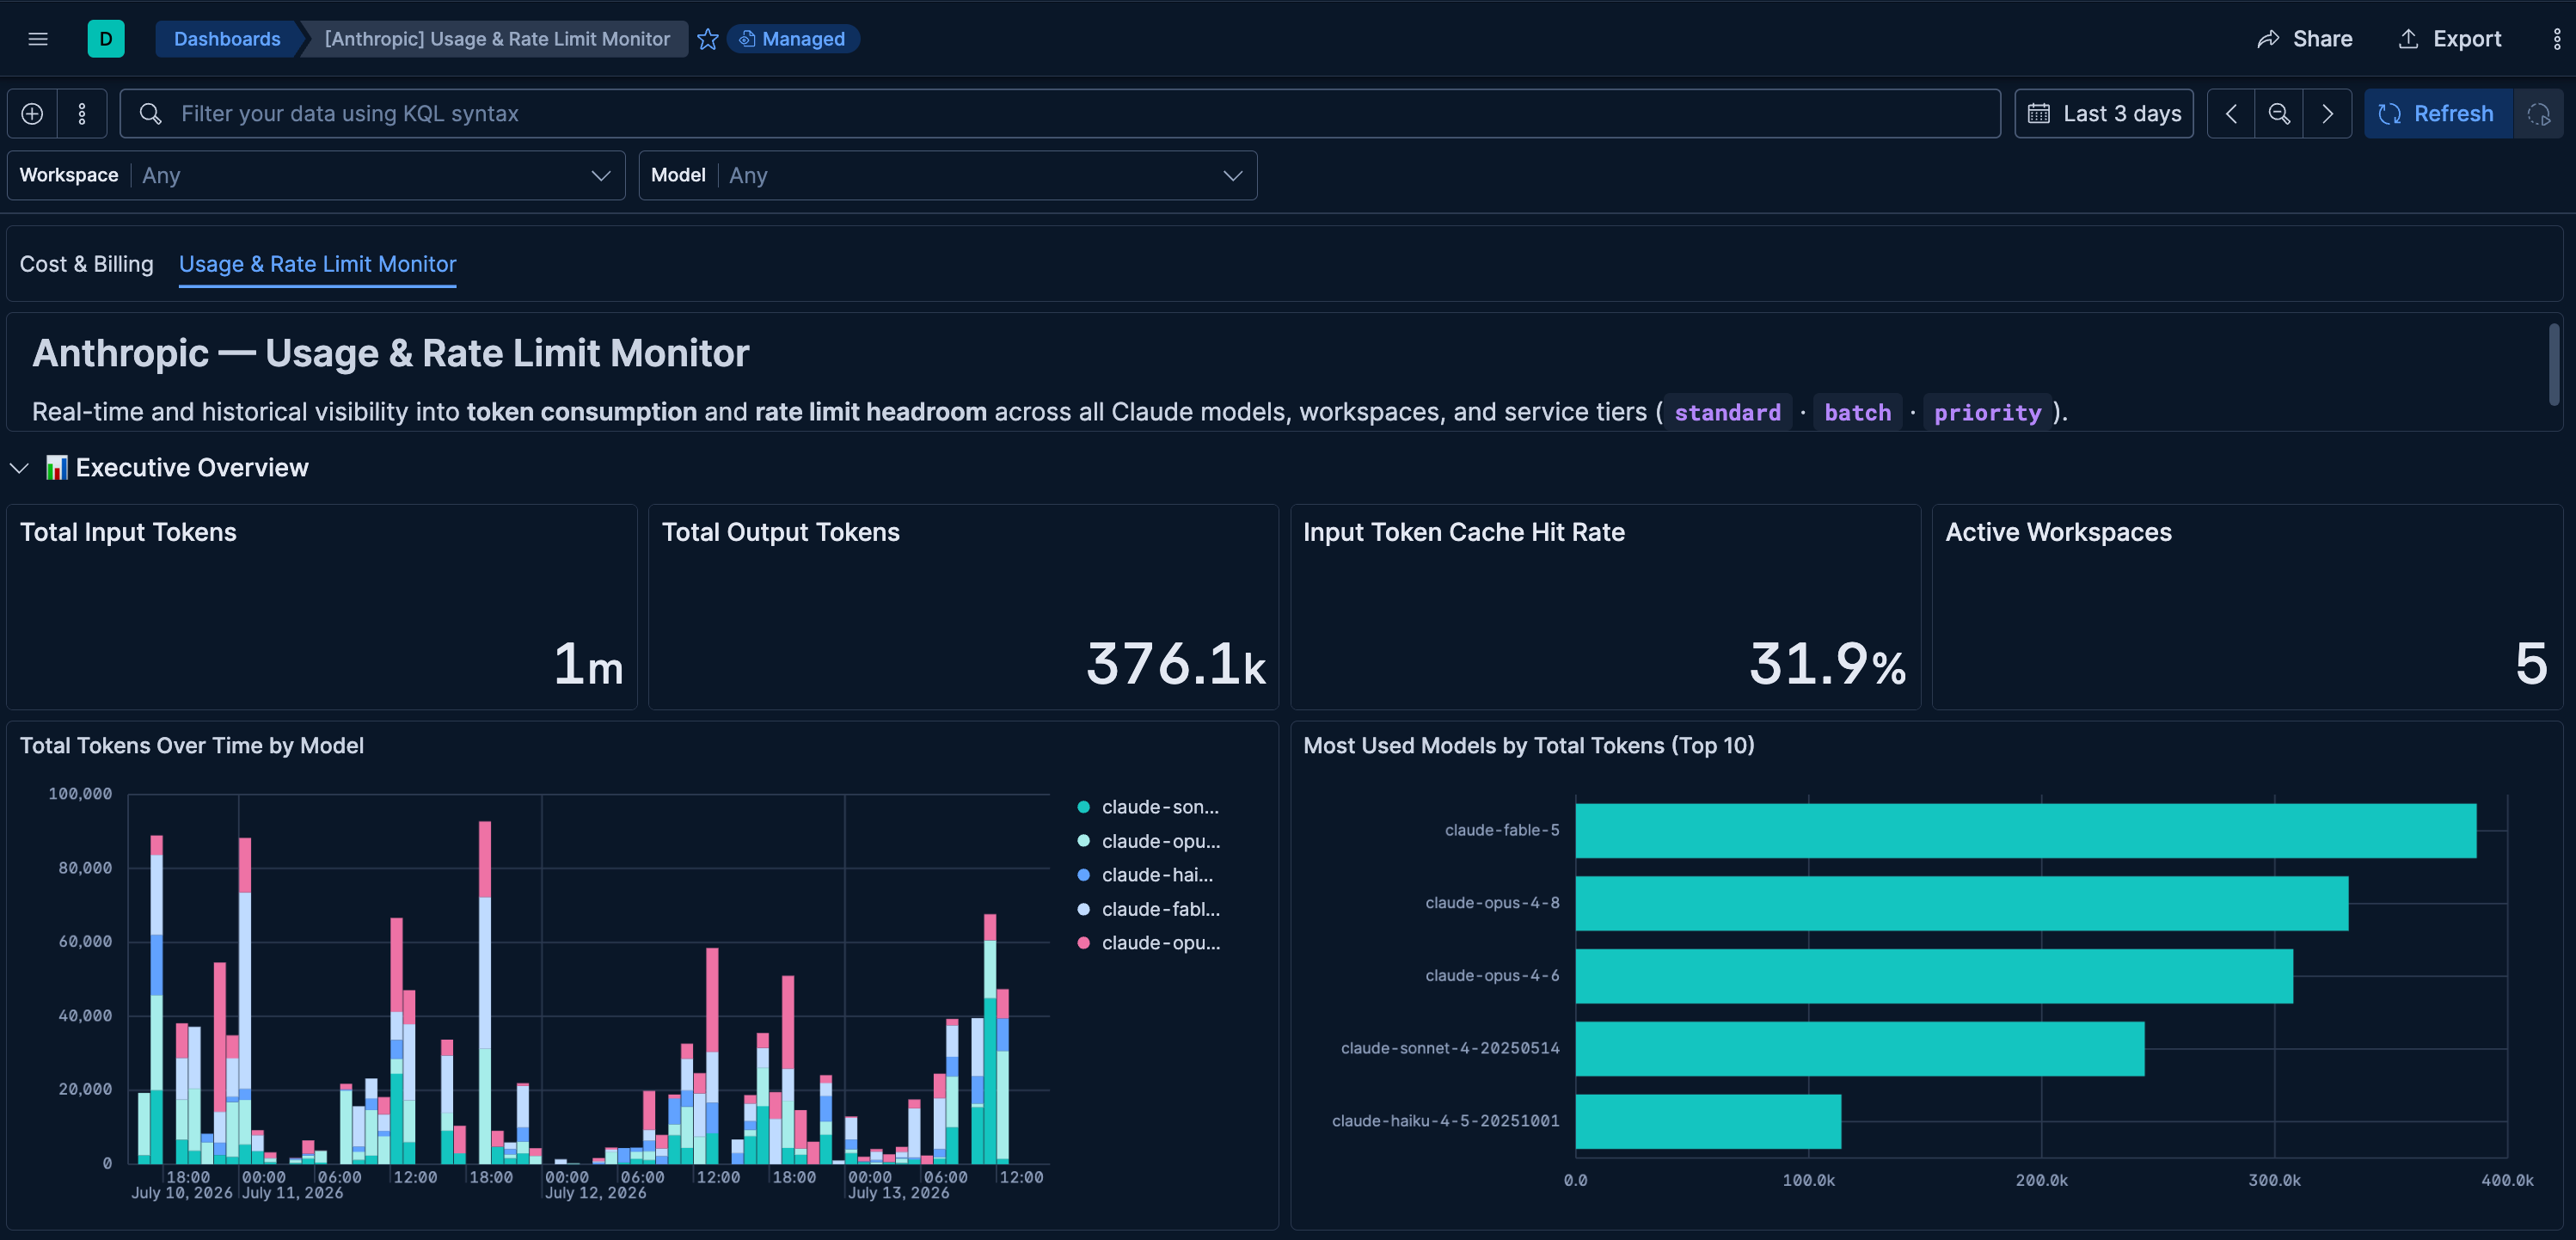
The Anthropic Metrics integration collects API usage, cost, and rate limit data from Anthropic organizations via the Admin APIs. It enables observability and monitoring teams to track token consumption, monitor spend, and surface rate limit configurations for capacity planning.
This integration uses the Anthropic Platform Admin API (platform.claude.com) to collect workspace- and API-key-level cost, usage, and rate limit data. It requires an Anthropic organization on a Team or Enterprise plan with access to the Admin API. Individual accounts (Free, Pro, Max) cannot create the required Admin API keys and are not supported.
Enterprise plan customers can use this integration for workspace- and API-key-level data.
For per-user or per-product breakdowns (Chat, Claude Code, Cowork, etc.), the separate Enterprise Analytics API (claude.ai/analytics/api-keys) is required — that API is currently not covered by this integration.
Elastic Agent polls three Anthropic Admin API endpoints on a configurable schedule using the CEL input:
- Usage API (
/v1/organizations/usage_report/messages): Token consumption by model, workspace, and service tier - Cost API (
/v1/organizations/cost_report): Daily cost breakdown by workspace and model - Rate Limits API (
/v1/organizations/rate_limits): Per-model rate limit configurations (RPM, ITPM, OTPM)
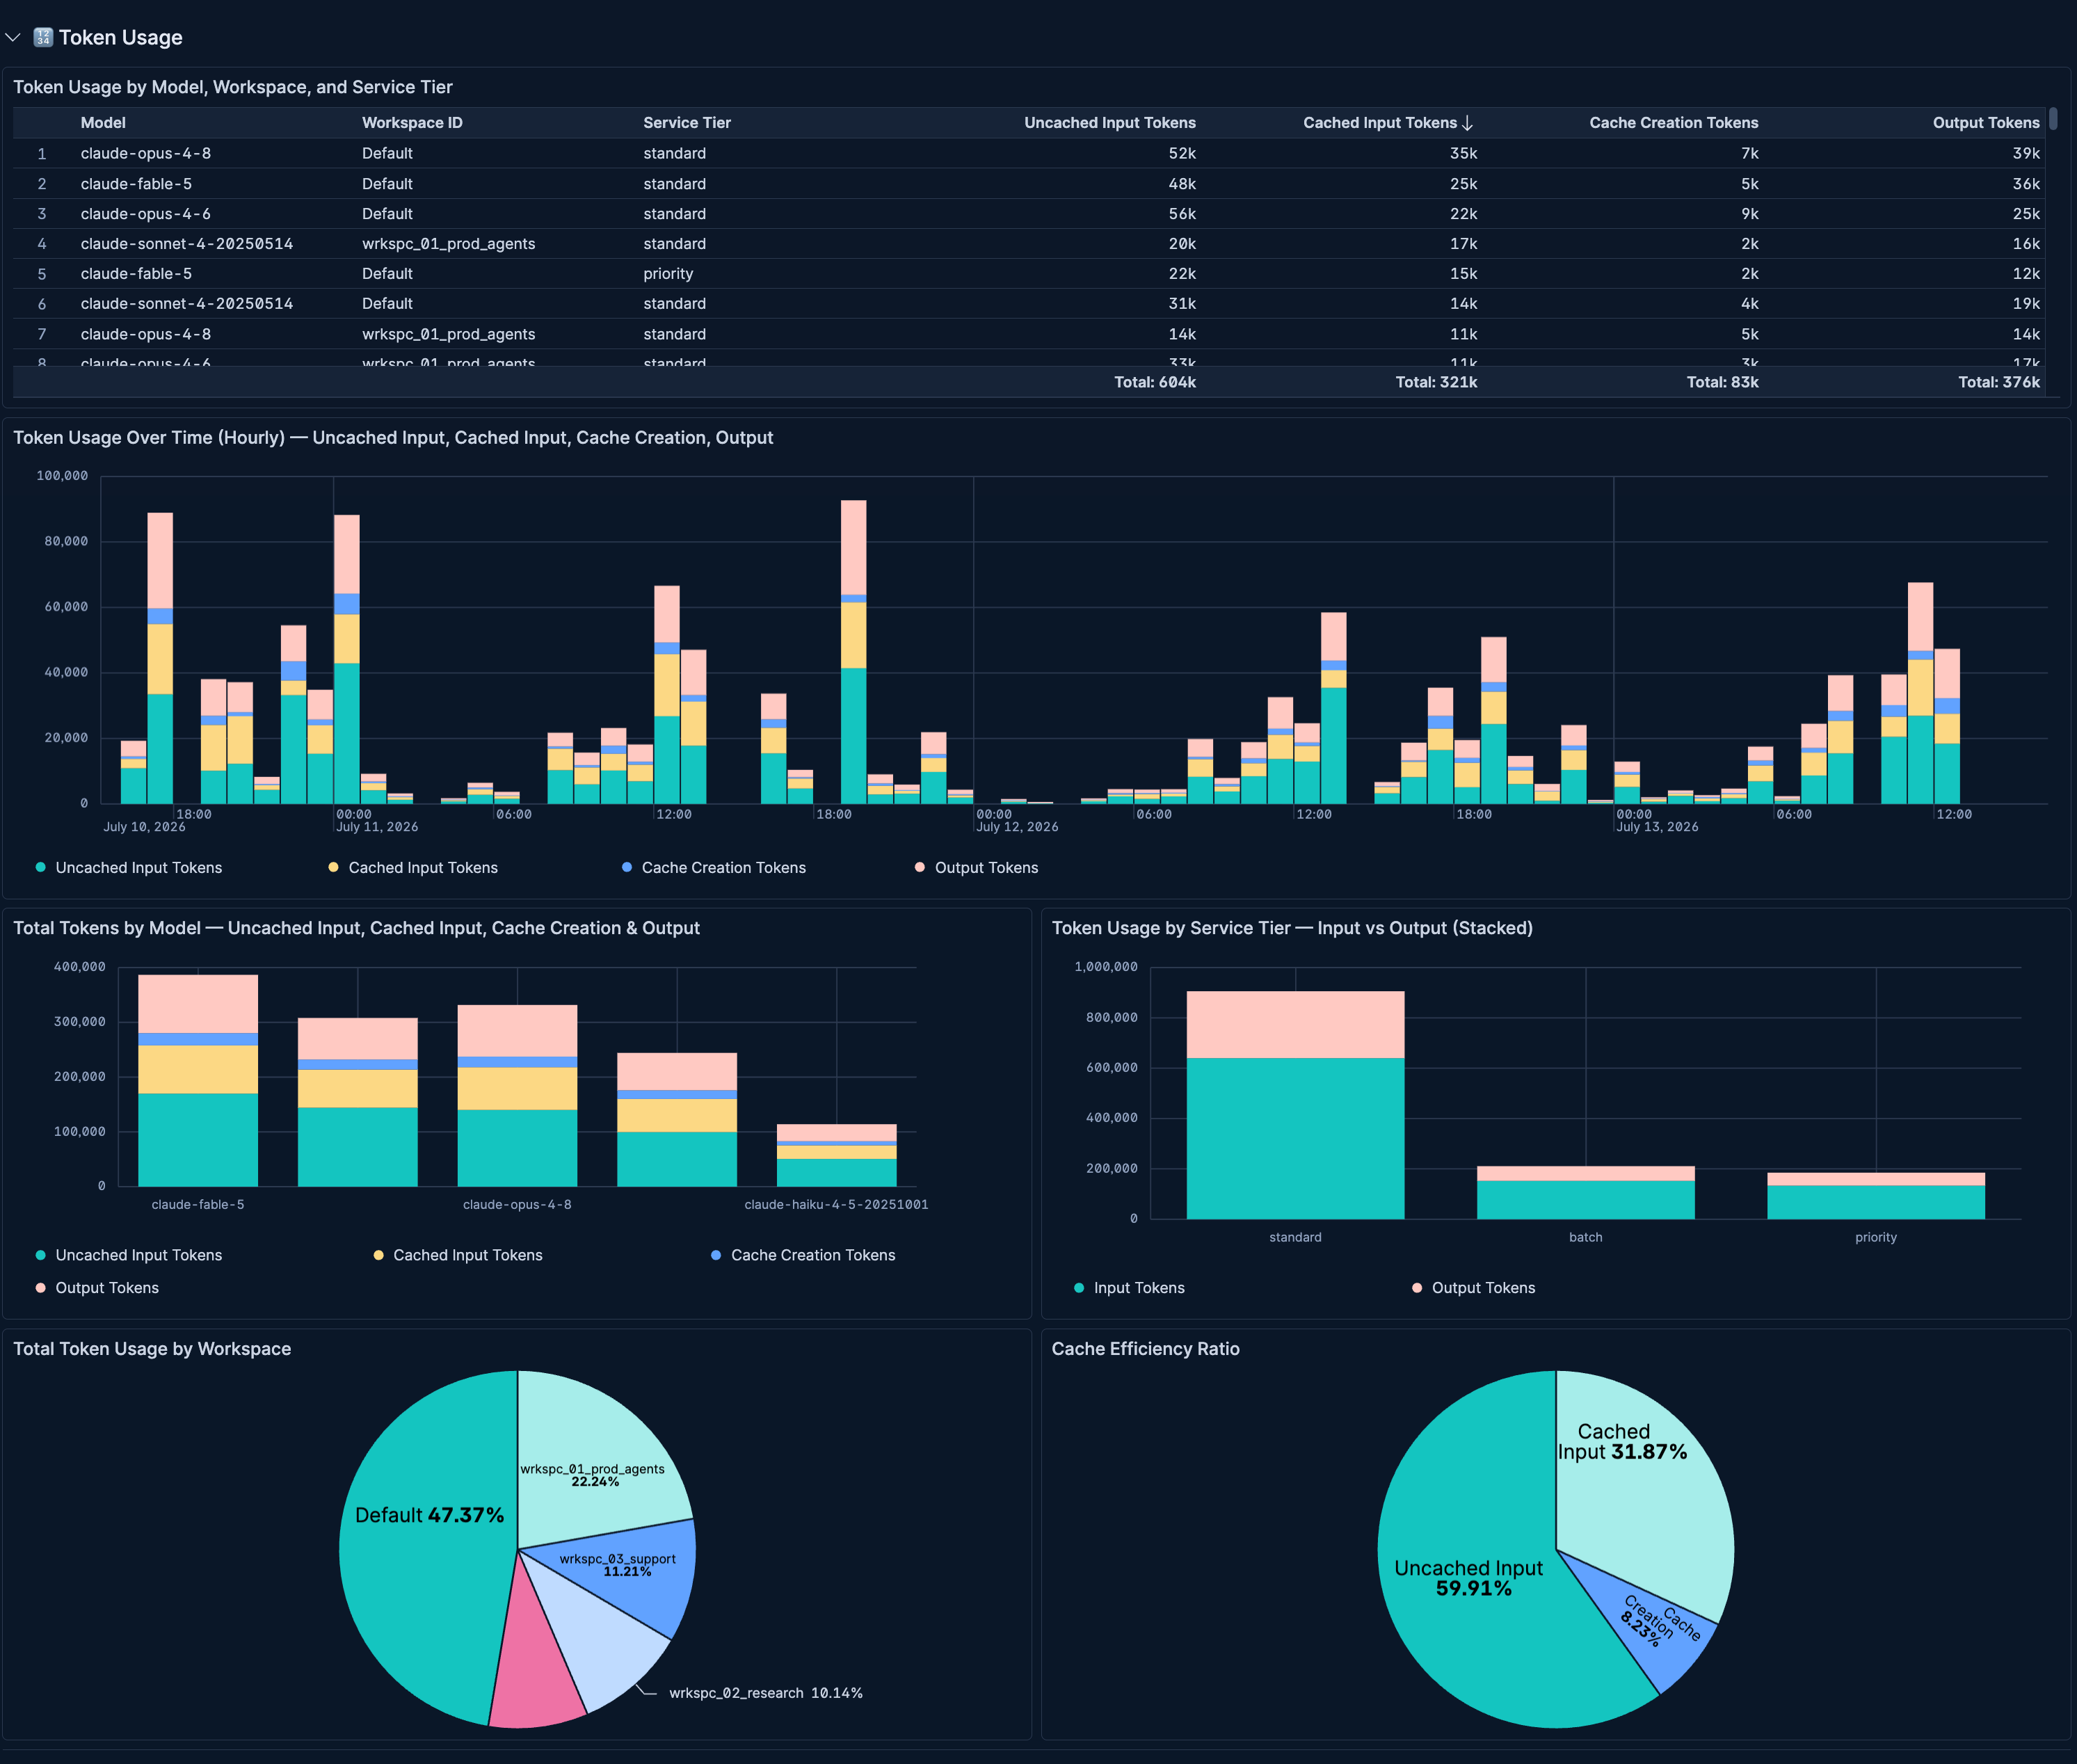
Token usage metrics aggregated in configurable time buckets (1 minute, 1 hour, or 1 day):
- Uncached input tokens, cached input tokens, cache creation tokens, and output tokens
- Breakdowns by model, workspace, service tier, context window, and inference geography
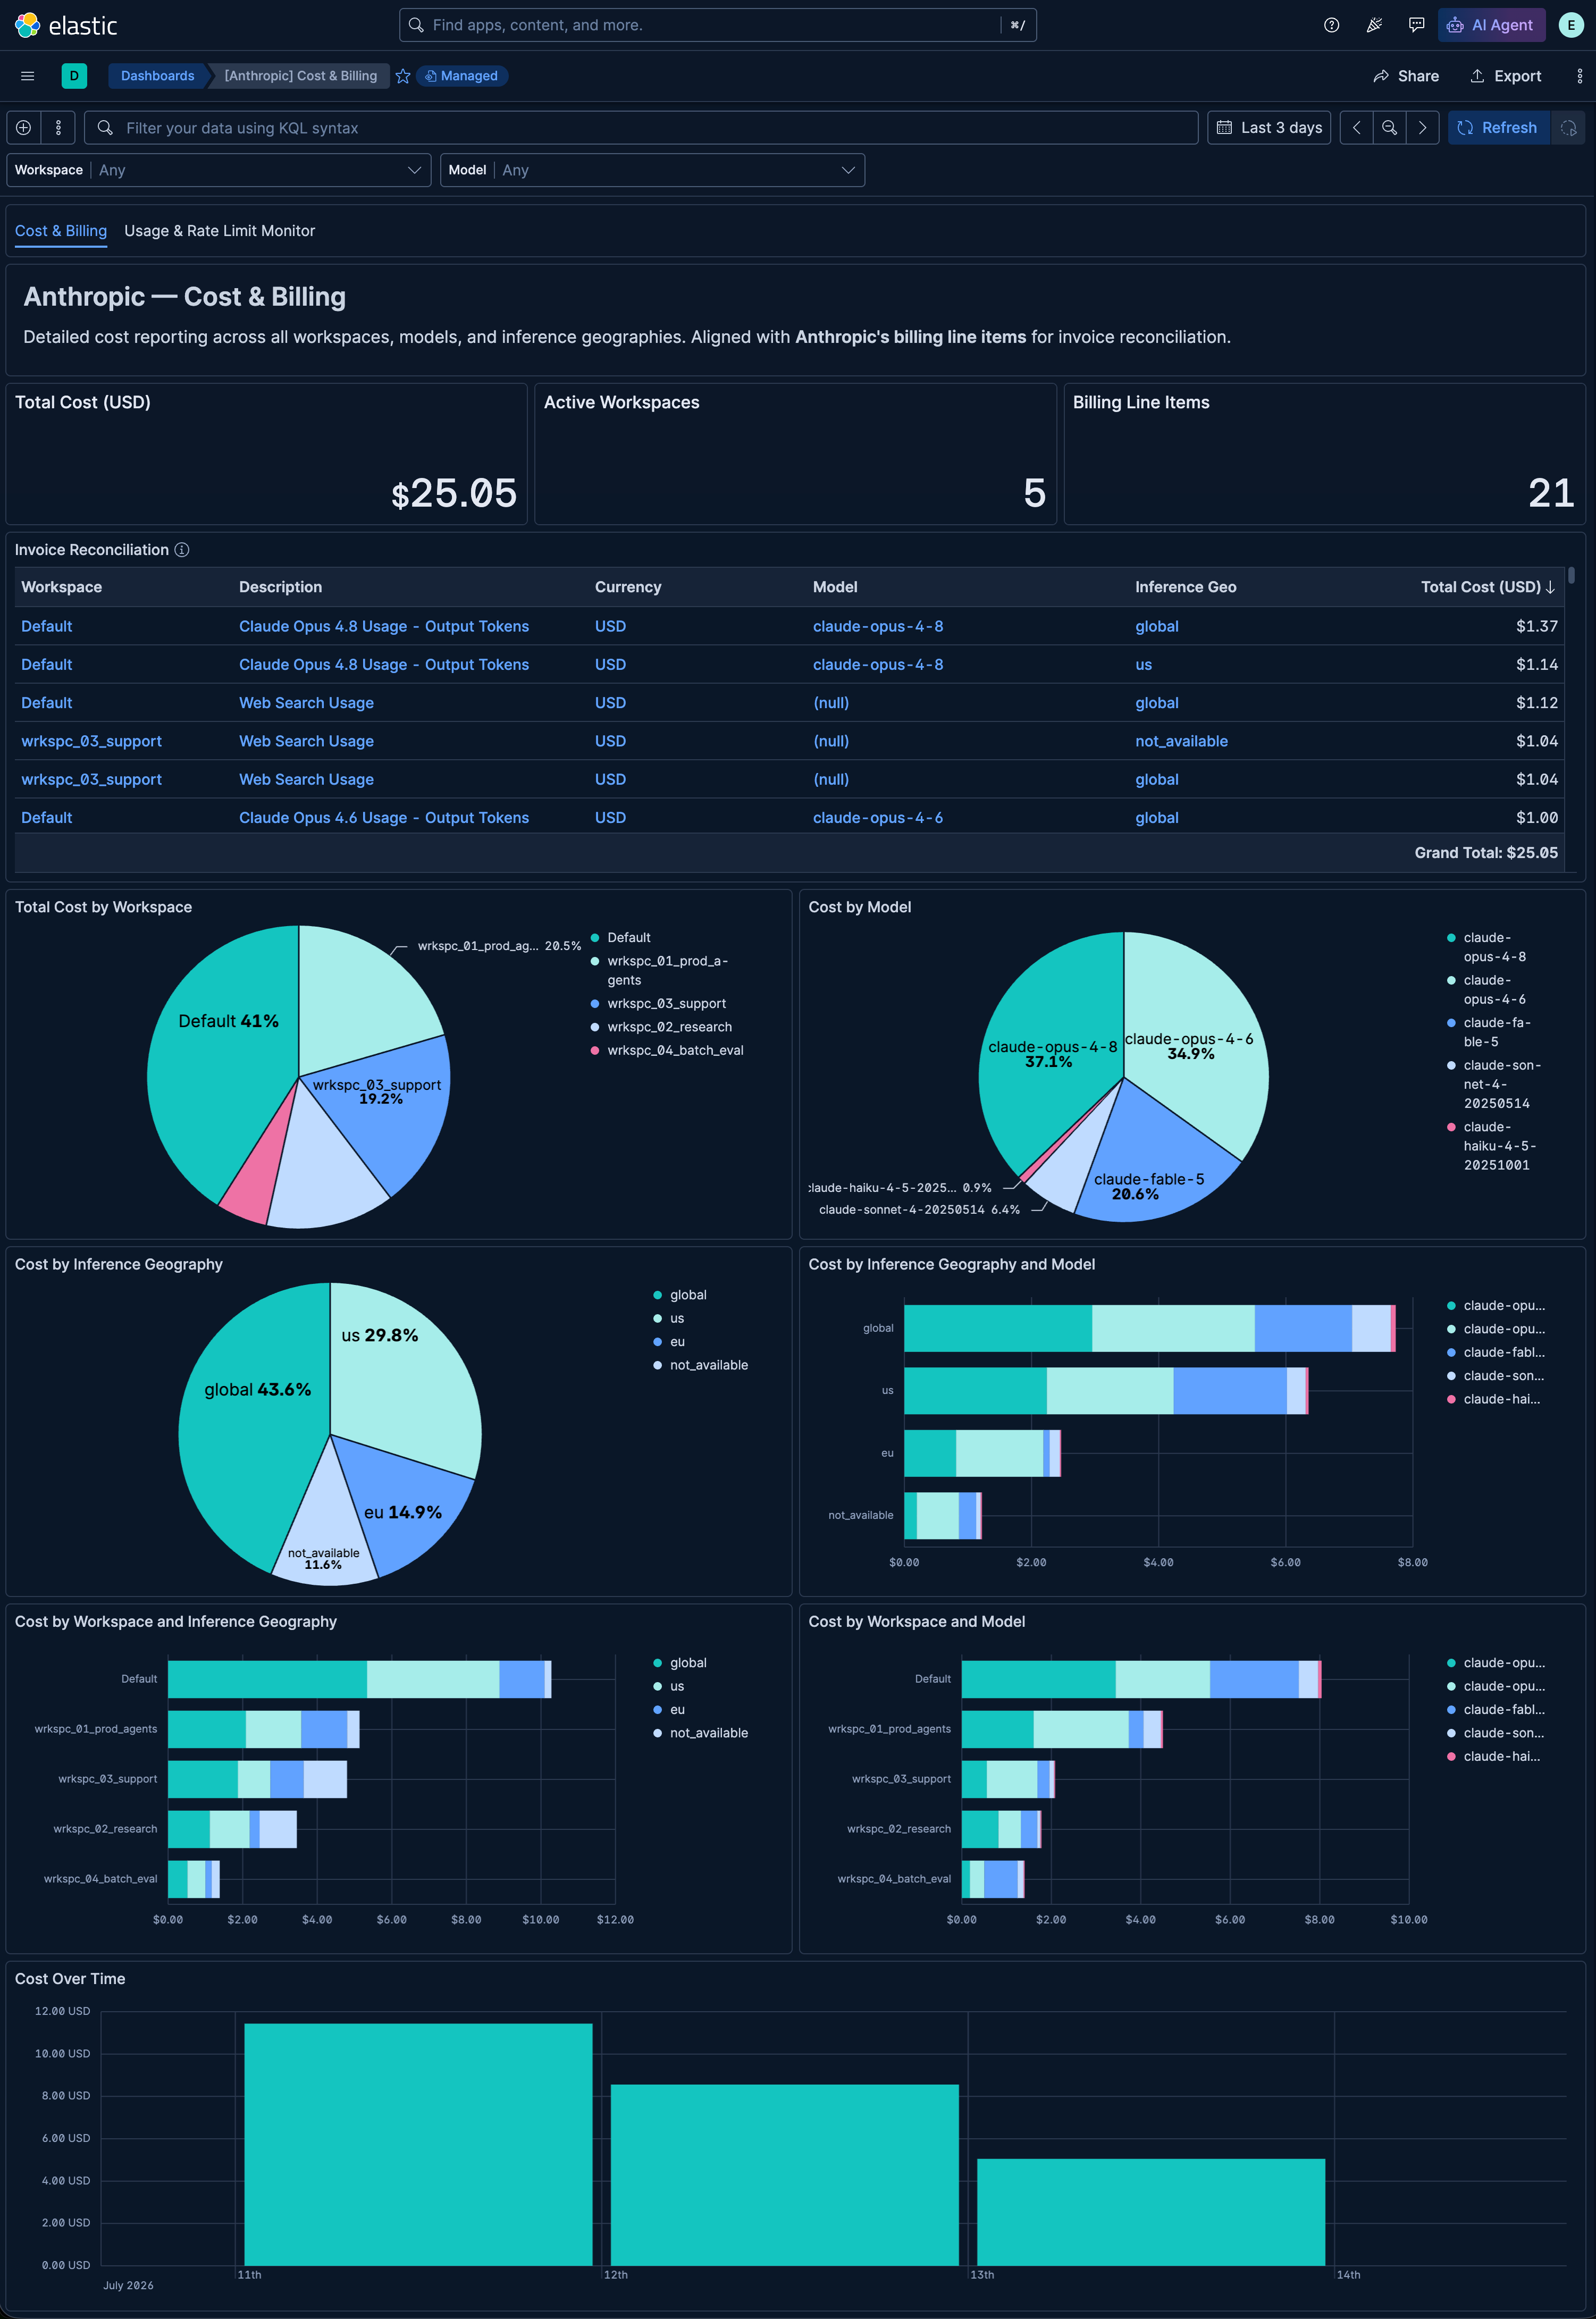
Daily cost data (amounts reported by the API in lowest units (eg cents)):
- Token usage costs, web search costs, and code execution costs
- Breakdowns by workspace and description (includes model and inference geography)
Rate limit configuration snapshots:
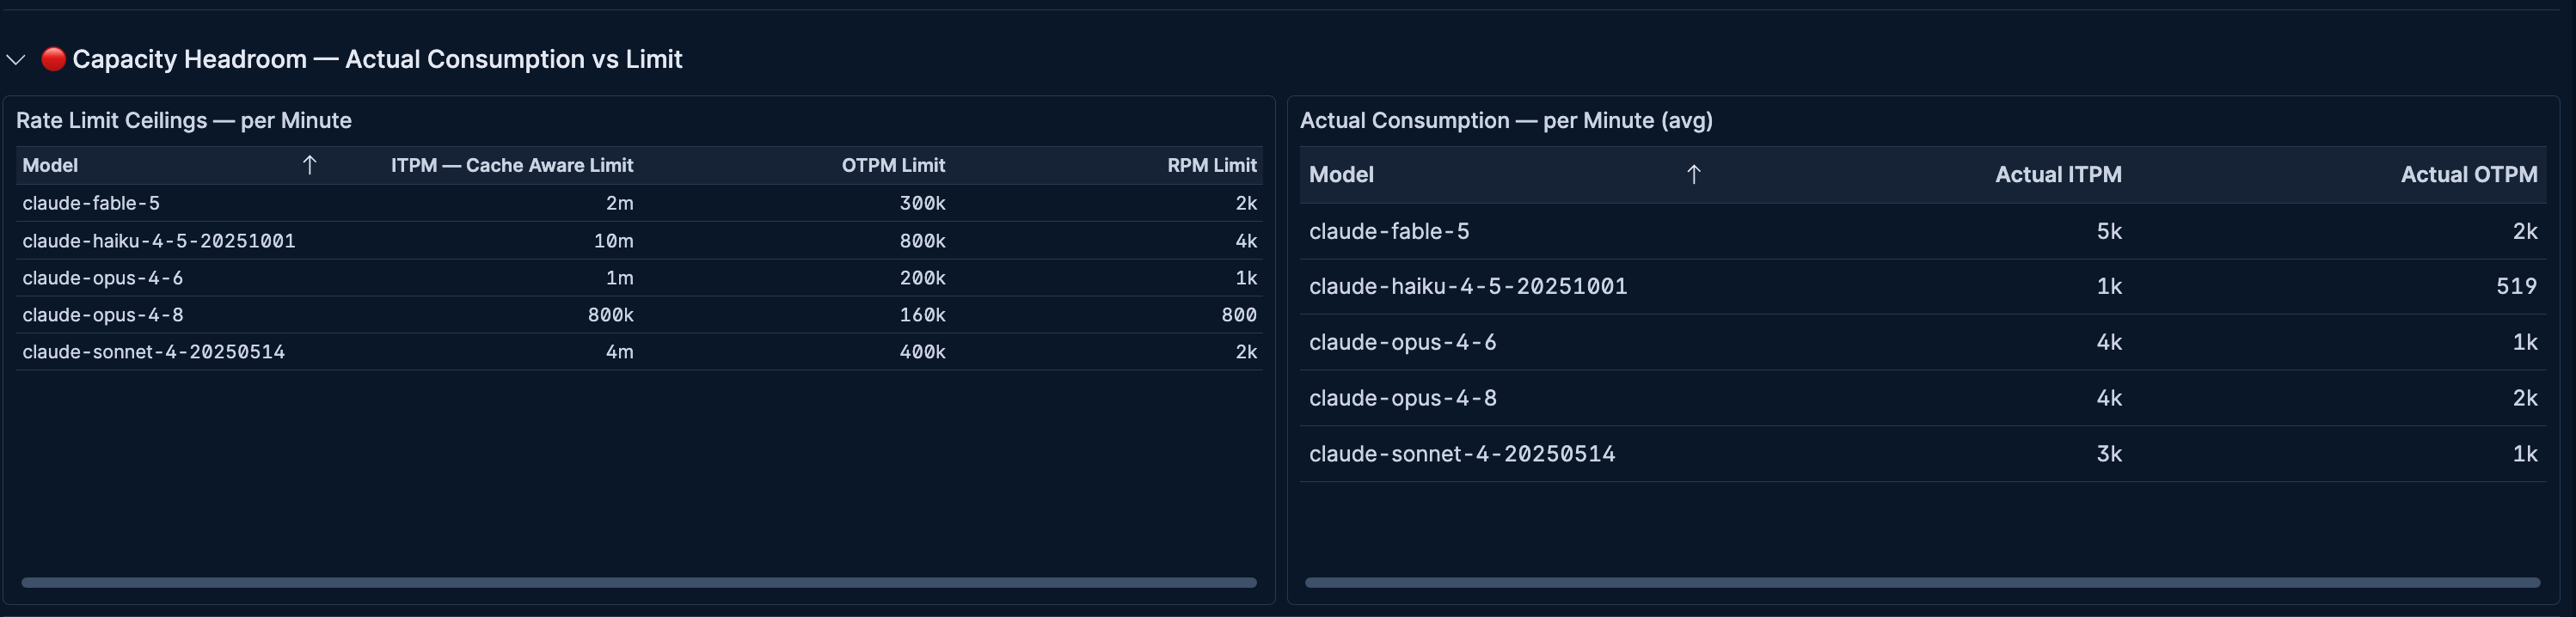
- Requests per minute (RPM), input tokens per minute (ITPM), output tokens per minute (OTPM)
- Model group membership and batch request limits
- Token usage monitoring: Track consumption trends across models and workspaces
- Cost management: Monitor daily spend and allocate costs by workspace
- Capacity planning: Compare rate limits against actual consumption to prevent throttling
- Finance reporting: Export usage and cost data for billing reconciliation
- An Anthropic organization (Team or Enterprise) with Platform Admin API access
- An Admin API key (starts with
sk-ant-admin...) provisioned by an organization admin via Claude Console > Settings > Admin keys. - Elastic Agent installed on a host with outbound HTTPS access to
api.anthropic.com
Elastic Managed integrations are only supported on Elastic Cloud Serverless and Elastic Cloud Hosted deployments. An Elastic Managed integration lets you ingest data from a cloud source while avoiding the orchestration, management, and maintenance associated with standard ingest infrastructure. Elastic runs the collector for you, so you can focus on your data instead of the infrastructure that collects it. This functionality is in beta and is subject to change. Beta features are not subject to the support SLA of official GA features.
For more information, refer to Elastic Managed integrations and the Elastic Managed integrations FAQ.
Elastic Agent must be installed. For more details, check the Elastic Agent installation instructions. You can install only one Elastic Agent per host.
Elastic Agent polls the Anthropic Admin APIs and ships collected events to Elasticsearch, where they are processed by the integration's ingest pipelines.
- Create an Admin API key in the Claude Console with organization admin permissions.
- In Kibana, navigate to Management > Integrations and search for Anthropic Metrics.
- Click Add Anthropic Metrics and enter the Admin API key.
- Configure each data stream using the settings below, then deploy the policy to your Elastic Agent.
Usage data stream settings
| Setting | Default | Description |
|---|---|---|
| Interval | 5m |
How often the Usage API is polled. |
| Initial Interval | 24h |
Lookback window on the first collection run. Must fit within Anthropic's granularity limits. |
| Bucket Width | 1h |
Time granularity for usage buckets. One of 1m, 1h, or 1d. Use 1m for real-time alerting, 1h for operational monitoring, or 1d for finance reporting. |
| Group By | model, workspace_id, service_tier, inference_geo |
Dimensions to break down usage data. Additional options: api_key_id, context_window, speed. |
Cost data stream settings
| Setting | Default | Description |
|---|---|---|
| Interval | 1h |
How often the Cost API is polled. The API only returns daily buckets, so polling more frequently than 1h adds no value. |
| Initial Interval | 168h (7 days) |
Lookback window on the first collection run. |
| Group By | workspace_id, description |
Dimensions to break down cost data. When description is included, the API returns structured fields for model, service tier, cost type, token type, context window, and inference geography. |
Rate Limit data stream settings
| Setting | Default | Description |
|---|---|---|
| Interval | 15m |
How often the Rate Limits API is polled. This is a snapshot API, so each poll returns the full current configuration. |
After deploying, verify data is flowing by checking the following data streams in Discover:
metrics-anthropic_metrics.usage-*metrics-anthropic_metrics.cost-*metrics-anthropic_metrics.rate_limit-*
For help with Elastic ingest tools, check Common problems.
- HTTP 401 errors: Verify the Admin API key is valid and starts with
sk-ant-admin.... Standard API keys do not work with Admin endpoints. - HTTP 403 errors: Confirm the key has organization admin permissions and the organization has Admin API access enabled.
- No data for usage/cost streams: Check that the time window parameters (
initial_interval,bucket_width) are configured correctly and that the organization has recent API activity.
For more information on architectures that can be used for scaling this integration, check the Ingest Architectures documentation.
The usage data stream collects token usage metrics from the Anthropic Usage API.
Exported fields
| Field | Description | Type |
|---|---|---|
| @timestamp | Date/time when the event originated. This is the date/time extracted from the event, typically representing when the event was generated by the source. If the event source has no original timestamp, this value is typically populated by the first time the event was received by the pipeline. Required field for all events. | date |
| anthropic.usage.api_key_id | API key identifier when grouped by api_key_id. | keyword |
| anthropic.usage.bucket_end_time | End time of the usage bucket. | date |
| anthropic.usage.bucket_start_time | Start time of the usage bucket. | date |
| anthropic.usage.cache_creation_input_tokens | Cache creation input tokens consumed in the bucket. | long |
| anthropic.usage.cached_input_tokens | Cached input tokens consumed in the bucket. | long |
| anthropic.usage.context_window | Context window size when grouped by context_window. | keyword |
| anthropic.usage.inference_geo | Inference geography when grouped by inference_geo. | keyword |
| anthropic.usage.model | Claude model name for the bucket. | keyword |
| anthropic.usage.output_tokens | Output tokens generated in the bucket. | long |
| anthropic.usage.service_tier | Service tier for the bucket (e.g. standard). | keyword |
| anthropic.usage.speed | Speed tier when grouped by speed. | keyword |
| anthropic.usage.uncached_input_tokens | Uncached input tokens consumed in the bucket. | long |
| anthropic.usage.workspace_id | Workspace identifier for the bucket. | keyword |
| data_stream.dataset | The field can contain anything that makes sense to signify the source of the data. Examples include nginx.access, prometheus, endpoint etc. For data streams that otherwise fit, but that do not have dataset set we use the value "generic" for the dataset value. event.dataset should have the same value as data_stream.dataset. Beyond the Elasticsearch data stream naming criteria noted above, the dataset value has additional restrictions: * Must not contain - * No longer than 100 characters |
constant_keyword |
| data_stream.namespace | A user defined namespace. Namespaces are useful to allow grouping of data. Many users already organize their indices this way, and the data stream naming scheme now provides this best practice as a default. Many users will populate this field with default. If no value is used, it falls back to default. Beyond the Elasticsearch index naming criteria noted above, namespace value has the additional restrictions: * Must not contain - * No longer than 100 characters |
constant_keyword |
| data_stream.type | An overarching type for the data stream. Currently allowed values are "logs" and "metrics". We expect to also add "traces" and "synthetics" in the near future. | constant_keyword |
| event.dataset | Name of the dataset. If an event source publishes more than one type of log or events (e.g. access log, error log), the dataset is used to specify which one the event comes from. It's recommended but not required to start the dataset name with the module name, followed by a dot, then the dataset name. | constant_keyword |
| event.module | Name of the module this data is coming from. If your monitoring agent supports the concept of modules or plugins to process events of a given source (e.g. Apache logs), event.module should contain the name of this module. |
constant_keyword |
| input.type | Type of input that generated the event. | keyword |
The cost data stream collects daily cost data from the Anthropic Cost API.
Exported fields
| Field | Description | Type |
|---|---|---|
| @timestamp | Date/time when the event originated. This is the date/time extracted from the event, typically representing when the event was generated by the source. If the event source has no original timestamp, this value is typically populated by the first time the event was received by the pipeline. Required field for all events. | date |
| anthropic.cost.amount | Cost amount in lowest units (e.g. cents) as returned by the Anthropic API. | double |
| anthropic.cost.bucket_end_time | End time of the cost bucket. | date |
| anthropic.cost.bucket_start_time | Start time of the cost bucket. | date |
| anthropic.cost.context_window | Context window used (e.g. 0-200k, 200k-1M). Available when grouped by description. | keyword |
| anthropic.cost.cost_type | Type of cost (e.g. tokens, web_search, code_execution, session_usage). Available when grouped by description. | keyword |
| anthropic.cost.currency | Currency code for the cost amount (e.g. USD). | keyword |
| anthropic.cost.description | Cost line description (e.g. model usage, Web Search Usage). | keyword |
| anthropic.cost.inference_geo | Inference geography for the cost item (e.g. global, us, not_available). Available when grouped by description. | keyword |
| anthropic.cost.model | Model name for the cost item. Available when grouped by description. | keyword |
| anthropic.cost.service_tier | Service tier for the cost item (e.g. standard, batch). Available when grouped by description. | keyword |
| anthropic.cost.token_type | Type of token (e.g. uncached_input_tokens, output_tokens, cache_read_input_tokens). Available when grouped by description. | keyword |
| anthropic.cost.workspace_id | Workspace identifier for the bucket. | keyword |
| data_stream.dataset | The field can contain anything that makes sense to signify the source of the data. Examples include nginx.access, prometheus, endpoint etc. For data streams that otherwise fit, but that do not have dataset set we use the value "generic" for the dataset value. event.dataset should have the same value as data_stream.dataset. Beyond the Elasticsearch data stream naming criteria noted above, the dataset value has additional restrictions: * Must not contain - * No longer than 100 characters |
constant_keyword |
| data_stream.namespace | A user defined namespace. Namespaces are useful to allow grouping of data. Many users already organize their indices this way, and the data stream naming scheme now provides this best practice as a default. Many users will populate this field with default. If no value is used, it falls back to default. Beyond the Elasticsearch index naming criteria noted above, namespace value has the additional restrictions: * Must not contain - * No longer than 100 characters |
constant_keyword |
| data_stream.type | An overarching type for the data stream. Currently allowed values are "logs" and "metrics". We expect to also add "traces" and "synthetics" in the near future. | constant_keyword |
| event.dataset | Name of the dataset. If an event source publishes more than one type of log or events (e.g. access log, error log), the dataset is used to specify which one the event comes from. It's recommended but not required to start the dataset name with the module name, followed by a dot, then the dataset name. | constant_keyword |
| event.module | Name of the module this data is coming from. If your monitoring agent supports the concept of modules or plugins to process events of a given source (e.g. Apache logs), event.module should contain the name of this module. |
constant_keyword |
| input.type | Type of input that generated the event. | keyword |
The rate_limit data stream collects rate limit configuration from the Anthropic Rate Limits API.
Exported fields
| Field | Description | Type |
|---|---|---|
| @timestamp | Date/time when the event originated. This is the date/time extracted from the event, typically representing when the event was generated by the source. If the event source has no original timestamp, this value is typically populated by the first time the event was received by the pipeline. Required field for all events. | date |
| anthropic.rate_limit.enqueued_batch_requests | Maximum enqueued batch requests allowed. | long |
| anthropic.rate_limit.group_type | Rate limit group type (e.g. model_group, batch, token_count). | keyword |
| anthropic.rate_limit.input_tokens_per_minute | Maximum input tokens per minute allowed for the model group. | long |
| anthropic.rate_limit.input_tokens_per_minute_cache_aware | Maximum cache-aware input tokens per minute for the model group. Only uncached and cache-creation tokens count against this limit; cache-read tokens are excluded for most models. | long |
| anthropic.rate_limit.limits.type | Limit metric type (e.g. requests_per_minute, input_tokens_per_minute). | keyword |
| anthropic.rate_limit.limits.value | Limit value for the metric type. | long |
| anthropic.rate_limit.models | Model names included in the group when group_type is model_group (array of keywords). | keyword |
| anthropic.rate_limit.output_tokens_per_minute | Maximum output tokens per minute allowed for the model group. | long |
| anthropic.rate_limit.requests_per_minute | Maximum requests per minute allowed for the model group. | long |
| anthropic.rate_limit.type | Object type (rate_limit). | keyword |
| data_stream.dataset | The field can contain anything that makes sense to signify the source of the data. Examples include nginx.access, prometheus, endpoint etc. For data streams that otherwise fit, but that do not have dataset set we use the value "generic" for the dataset value. event.dataset should have the same value as data_stream.dataset. Beyond the Elasticsearch data stream naming criteria noted above, the dataset value has additional restrictions: * Must not contain - * No longer than 100 characters |
constant_keyword |
| data_stream.namespace | A user defined namespace. Namespaces are useful to allow grouping of data. Many users already organize their indices this way, and the data stream naming scheme now provides this best practice as a default. Many users will populate this field with default. If no value is used, it falls back to default. Beyond the Elasticsearch index naming criteria noted above, namespace value has the additional restrictions: * Must not contain - * No longer than 100 characters |
constant_keyword |
| data_stream.type | An overarching type for the data stream. Currently allowed values are "logs" and "metrics". We expect to also add "traces" and "synthetics" in the near future. | constant_keyword |
| event.dataset | Name of the dataset. If an event source publishes more than one type of log or events (e.g. access log, error log), the dataset is used to specify which one the event comes from. It's recommended but not required to start the dataset name with the module name, followed by a dot, then the dataset name. | constant_keyword |
| event.module | Name of the module this data is coming from. If your monitoring agent supports the concept of modules or plugins to process events of a given source (e.g. Apache logs), event.module should contain the name of this module. |
constant_keyword |
| input.type | Type of input that generated the event. | keyword |
Alert rule templates provide pre-defined configurations for creating alert rules in Kibana.
For more information, refer to the Elastic documentation.
Alert rule templates require Elastic Stack version 9.2.0 or later.
The following alert rule templates are available:
View the alert rule templates
| Name | Description | |
|---|---|---|
| [Anthropic] Cache Hit Rate Drop | Alerts when the input token cache hit ratio drops below 30%. A sudden drop means prompts are not hitting cache, which increases cost and latency. | |
| [Anthropic] Cost Anomaly | Alerts when daily cost exceeds a configurable threshold. Catches unexpected spend spikes from runaway workloads or new model adoption before they accumulate. | |
| [Anthropic] Monthly Budget Spend Limit | Alerts when cumulative spend for the current calendar month exceeds a configurable budget. Resets on the 1st of each month. Default threshold is $1,000 (100000 cents). Adjust the threshold in the ES | QL WHERE clause. |
| [Anthropic] Single Model Dominance | Alerts when a single model accounts for more than 90% of total token consumption. May indicate a misconfiguration where traffic is not routing to the intended model. | |
| [Anthropic] Token Consumption Spike | Alerts when total token consumption in the current window is unusually high compared to baseline. Fires when any model's hourly token count exceeds a configurable threshold. | |
| [Anthropic] Per-Workspace Daily Cost Spike | Alerts when any single workspace's daily cost exceeds a configurable threshold. Catches runaway spend in individual workspaces that may hide under the org-wide total. Default threshold is $20 (2000 cents). Adjust the threshold in the ES | QL WHERE clause. |
This integration includes one or more Kibana dashboards that visualizes the data collected by the integration. The screenshots below illustrate how the ingested data is displayed.
Changelog
| Version | Details | Minimum Kibana version |
|---|---|---|
| 0.5.0 | Enhancement (View pull request) Update Elastic Managed integration documentation to the current wording and docs links. |
9.4.0 |
| 0.4.0 | Enhancement (View pull request) Publish Agentless to Elastic Managed integrations name change. |
9.4.0 |
| 0.3.0 | Enhancement (View pull request) Update dashboard visualizations and color palettes. |
9.4.0 |
| 0.2.0 | Enhancement (View pull request) Add alerting rule template for Anthropic Metrics. |
9.4.0 |
| 0.1.0 | Enhancement (View pull request) Initial release with usage, cost, and rate_limit data streams for Anthropic Admin APIs. |
9.4.0 |