InfluxDB Integration
Elastic Cloud Serverless projects are autoscaled environments, fully managed by Elastic and available on Elastic Cloud. Availability This functionality is in technical preview and is ready for evaluation. Use with caution in production; it is not recommended for mission-critical workloads. Elastic will work to fix any issues, but features in technical preview are not subject to the support SLA of official GA features. Specific Support terms apply. Elastic Cloud Serverless projects are autoscaled environments, fully managed by Elastic and available on Elastic Cloud. Availability This functionality is in technical preview and is ready for evaluation. Use with caution in production; it is not recommended for mission-critical workloads. Elastic will work to fix any issues, but features in technical preview are not subject to the support SLA of official GA features. Specific Support terms apply. The Elastic Stack includes Elastic's core products such as Elasticsearch, Kibana, Logstash, and Beats. Availability This functionality is in technical preview and is ready for evaluation. Use with caution in production; it is not recommended for mission-critical workloads. Elastic will work to fix any issues, but features in technical preview are not subject to the support SLA of official GA features. Specific Support terms apply. Unless stated otherwise on the page, this functionality is available when your Elastic Stack is deployed on Elastic Cloud Hosted, Elastic Cloud Enterprise, Elastic Cloud on Kubernetes, and self-managed environments. This documentation corresponds to the latest patch available for each minor version. If you're not using the latest patch, check the release notes for changes.
Serverless Observability
Preview
Preview
Serverless Security
Preview
Preview
Stack
Preview
9.0+
Preview since 9.0
| Version | 0.11.0 Availability Preview This functionality is in technical preview and is ready for evaluation. Use with caution in production; it is not recommended for mission-critical workloads. Elastic will work to fix any issues, but features in technical preview are not subject to the support SLA of official GA features. Specific Support terms apply. (View all) |
| Subscription level What's this? |
Basic |
| Developed by What's this? |
Elastic |
| Ingestion method(s) | Prometheus |
| Minimum Kibana version(s) | 9.0.0 8.13.0 |
To use pre-release integrations, go to the Integrations page in Kibana, scroll down, and toggle on the Display beta integrations option.
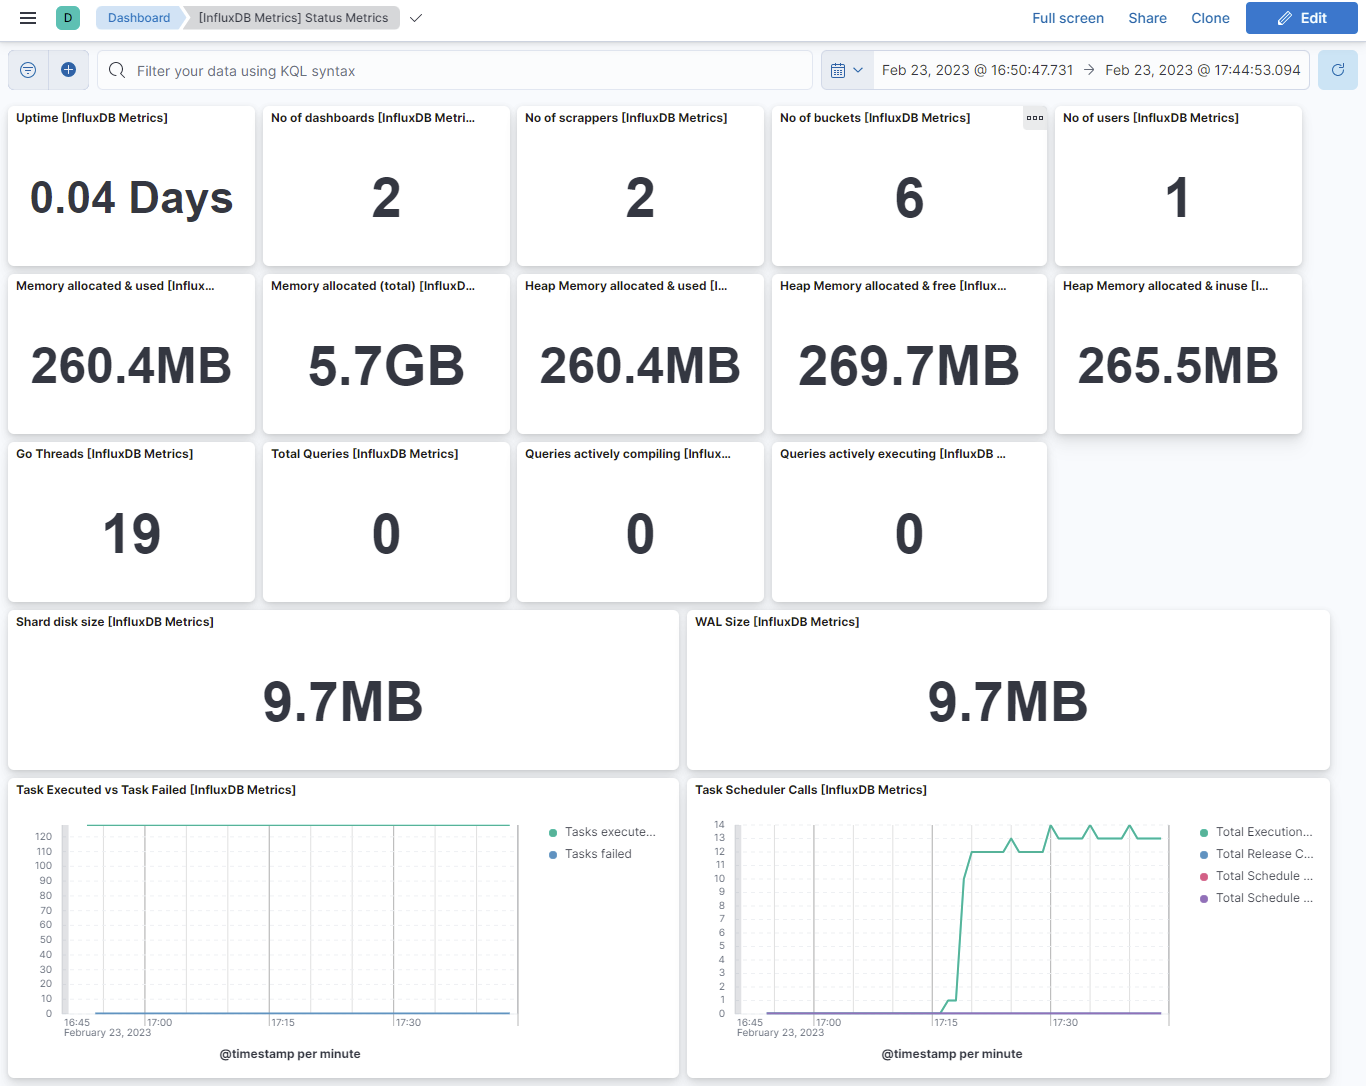
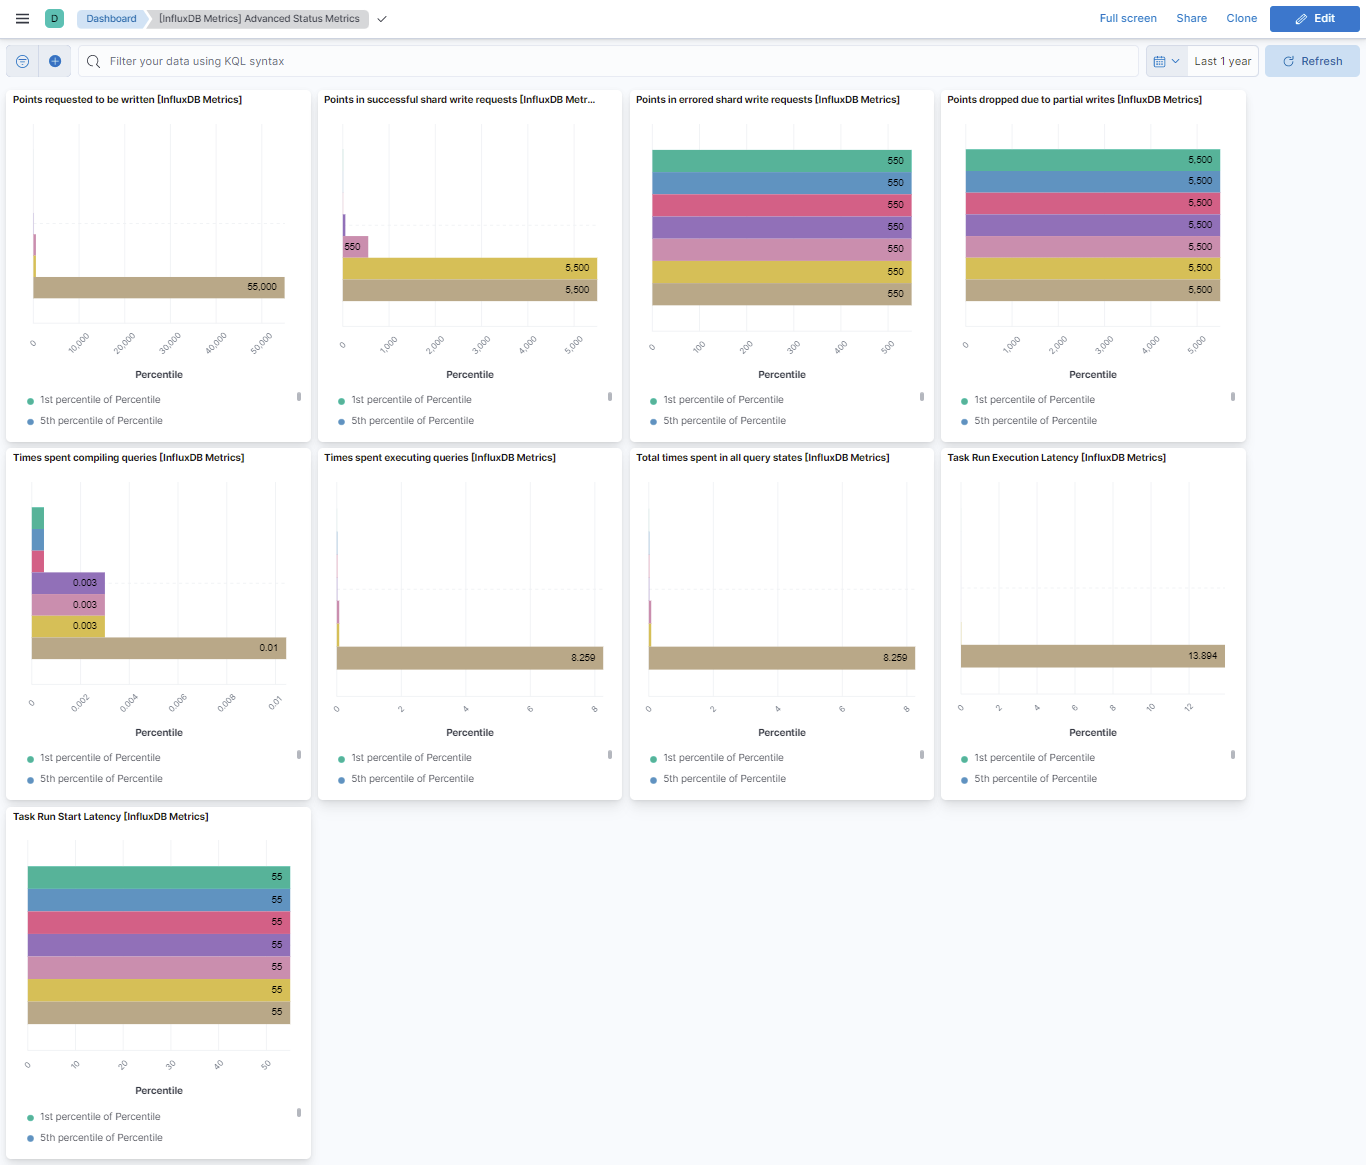
This integration is for ingesting task, storage, golang, performance related metrics from InfluxDB OSS 2.x databases. This integration provides out-of-the-box dashboards named Status Metrics, Advanced Status Metrics.
This integration depends on prometheus endpoint (default: http://<InfluxDBhost>:<port>/metrics) of InfluxDB for collecting status and advanced status metrics.
This integration has been tested against InfluxDB OSS 2.4, InfluxDB OSS 2.0
Status metrics include details of memory usage, OS thread usage, query statistics, organization & users statistics, tasks & task workers, WAL size etc.
ECS Field Reference
Please refer to the following document for detailed information on ECS fields.
Exported fields
| Field | Description | Type | Unit | Metric Type |
|---|---|---|---|---|
| @timestamp | Event timestamp. | date | ||
| agent.id | Unique identifier of this agent (if one exists). Example: For Beats this would be beat.id. | keyword | ||
| cloud.account.id | The cloud account or organization id used to identify different entities in a multi-tenant environment. Examples: AWS account id, Google Cloud ORG Id, or other unique identifier. | keyword | ||
| cloud.availability_zone | Availability zone in which this host, resource, or service is located. | keyword | ||
| cloud.instance.id | Instance ID of the host machine. | keyword | ||
| cloud.provider | Name of the cloud provider. Example values are aws, azure, gcp, or digitalocean. | keyword | ||
| cloud.region | Region in which this host, resource, or service is located. | keyword | ||
| container.id | Unique container id. | keyword | ||
| data_stream.dataset | Data stream dataset. | constant_keyword | ||
| data_stream.namespace | Data stream namespace. | constant_keyword | ||
| data_stream.type | Data stream type. | constant_keyword | ||
| host.name | Name of the host. It can contain what hostname returns on Unix systems, the fully qualified domain name (FQDN), or a name specified by the user. The recommended value is the lowercase FQDN of the host. | keyword | ||
| influxdb.status.buckets_total | Number of total buckets on the server. | double | counter | |
| influxdb.status.dashboards_total | Number of total dashboards on the server. | double | counter | |
| influxdb.status.go_runtime.memstats_alloc_bytes | Number of bytes allocated and still in use. | double | byte | gauge |
| influxdb.status.go_runtime.memstats_alloc_bytes_total | Total number of bytes allocated, even if freed. | double | byte | counter |
| influxdb.status.go_runtime.memstats_heap_alloc_bytes | Number of heap bytes allocated and still in use. | double | byte | gauge |
| influxdb.status.go_runtime.memstats_heap_idle_bytes | Number of heap bytes waiting to be used. | double | byte | gauge |
| influxdb.status.go_runtime.memstats_heap_inuse_bytes | Number of heap bytes that are in use. | double | byte | gauge |
| influxdb.status.go_runtime.threads | Number of OS threads created. | double | gauge | |
| influxdb.status.http_api.http_status | HTTP API request call status. | keyword | ||
| influxdb.status.http_api.method | HTTP request method. | keyword | ||
| influxdb.status.http_api.path | HTTP request endpoint. | keyword | ||
| influxdb.status.http_api.response_code | Response code of HTTP API request. | keyword | ||
| influxdb.status.http_api_requests_total | Number of http requests received | double | counter | |
| influxdb.status.instance | InfluxDB instance. | keyword | ||
| influxdb.status.label.bucket | Bucket ID | keyword | ||
| influxdb.status.label.compiler_type | Type of the compiler | keyword | ||
| influxdb.status.label.engine | TSDB storage engine | keyword | ||
| influxdb.status.label.handler | Request handler. | keyword | ||
| influxdb.status.label.id | keyword | |||
| influxdb.status.label.job | Type of the job | keyword | ||
| influxdb.status.label.level | keyword | |||
| influxdb.status.label.method | Type of service operation | keyword | ||
| influxdb.status.label.op | Extended information related to various operations | keyword | ||
| influxdb.status.label.quantile | Number that indicates the histogram quantile value. | keyword | ||
| influxdb.status.label.task_type | Type of the task | keyword | ||
| influxdb.status.label.taskid | Task ID of the influxdb tasks | keyword | ||
| influxdb.status.label.user_agent | Type of user agent | keyword | ||
| influxdb.status.label.walPath | Path to the WAL file | keyword | ||
| influxdb.status.org | Organization id of the Organization created in InfluxDB. | keyword | ||
| influxdb.status.organizations_total | Number of total organizations on the server. | double | counter | |
| influxdb.status.query_controller.all_active | Number of queries in all states. | double | gauge | |
| influxdb.status.query_controller.compiling_active | Number of queries actively compiling. | double | gauge | |
| influxdb.status.query_controller.qc_executing_active | Number of queries actively executing. | double | gauge | |
| influxdb.status.scrapers_total | Number of total scrapers on the server. | double | counter | |
| influxdb.status.storage.bucket_measurement_num | Gauge of measurement cardinality per bucket. | double | gauge | |
| influxdb.status.storage.bucket_series_num | Gauge of series cardinality per bucket. | double | gauge | |
| influxdb.status.storage.compactions_failed | Counter of TSM compactions by level that have failed due to error. | double | counter | |
| influxdb.status.storage.shard_disk_size | Gauge of the disk size for the shard. | double | gauge | |
| influxdb.status.storage.shard_write_count | Count of the number of write requests. | double | counter | |
| influxdb.status.storage.shard_write_dropped_sum | Counter of the number of points dropped. | double | counter | |
| influxdb.status.storage.shard_write_err_count | Count of the number of write requests with errors. | double | counter | |
| influxdb.status.storage.tsm_files_disk_bytes | Gauge of data size in bytes for each shard. | double | gauge | |
| influxdb.status.storage.tsm_files_total | Gauge of number of files per shard | double | gauge | |
| influxdb.status.storage.wal_size | Gauge of size of WAL in bytes. | double | byte | gauge |
| influxdb.status.storage.wal_writes | Number of write attempts to the WAL. | double | counter | |
| influxdb.status.storage.wal_writes_err | Number of failed write attempts to the WAL. | double | counter | |
| influxdb.status.storage.writer_timeouts | Number of shard write request timeouts. | double | counter | |
| influxdb.status.tasks.executor_errors_counter | The number of errors thrown by the executor with the type of error. Example - Invalid, Internal, etc. | double | counter | |
| influxdb.status.tasks.executor_total_runs_active | Total number of workers currently running tasks. | double | gauge | |
| influxdb.status.tasks.executor_total_runs_complete | Total number of runs completed across all tasks, split out by success or failure. | double | counter | |
| influxdb.status.tasks.executor_workers_busy | Percent of total available workers that are currently busy. | double | percent | gauge |
| influxdb.status.tasks.scheduler_current_execution | Number of tasks currently being executed. | double | gauge | |
| influxdb.status.tasks.scheduler_total_execute_failure | Total number of times an execution has failed. | double | counter | |
| influxdb.status.tasks.scheduler_total_execution_calls | Total number of executions across all tasks. | double | counter | |
| influxdb.status.tasks.scheduler_total_release_calls | Total number of release requests. | double | counter | |
| influxdb.status.tasks.scheduler_total_schedule_calls | Total number of schedule requests. | double | counter | |
| influxdb.status.tasks.scheduler_total_schedule_fails | Total number of schedule requests that fail to schedule. | double | counter | |
| influxdb.status.tokens_total | Number of total tokens on the server. | double | counter | |
| influxdb.status.uptime_seconds | InfluxDB process uptime in seconds. | double | s | gauge |
| influxdb.status.users_total | Number of total users on the server. | double | counter | |
| service.address | Address where data about this service was collected from. This should be a URI, network address (ipv4:port or [ipv6]:port) or a resource path (sockets). | keyword |
Example
{
    "@timestamp": "2022-09-22T05:55:26.485Z",
    "agent": {
        "ephemeral_id": "512929a4-20a5-4e02-97d3-f089acc3dc8f",
        "id": "f89b312e-866e-4215-bbb4-f0ddec5e4872",
        "name": "docker-fleet-agent",
        "type": "metricbeat",
        "version": "8.3.0"
    },
    "cloud": {
        "account": {
            "id": "elastic-obs-integrations-dev"
        },
        "availability_zone": "asia-south1-c",
        "instance": {
            "id": "3010911784348669868",
            "name": "service-integration-dev-idc-01"
        },
        "machine": {
            "type": "n1-standard-8"
        },
        "project": {
            "id": "elastic-obs-integrations-dev"
        },
        "provider": "gcp",
        "service": {
            "name": "GCE"
        }
    },
    "data_stream": {
        "dataset": "influxdb.status",
        "namespace": "ep",
        "type": "metrics"
    },
    "ecs": {
        "version": "8.11.0"
    },
    "elastic_agent": {
        "id": "f89b312e-866e-4215-bbb4-f0ddec5e4872",
        "snapshot": false,
        "version": "8.3.0"
    },
    "event": {
        "agent_id_status": "verified",
        "dataset": "influxdb.status",
        "duration": 6154570,
        "ingested": "2022-09-22T05:55:27Z",
        "module": "prometheus"
    },
    "host": {
        "architecture": "x86_64",
        "containerized": true,
        "hostname": "docker-fleet-agent",
        "ip": [
            "192.168.80.7"
        ],
        "mac": [
            "02-42-AC-1F-00-07"
        ],
        "name": "docker-fleet-agent",
        "os": {
            "codename": "focal",
            "family": "debian",
            "kernel": "5.4.0-1078-gcp",
            "name": "Ubuntu",
            "platform": "ubuntu",
            "type": "linux",
            "version": "20.04.4 LTS (Focal Fossa)"
        }
    },
    "influxdb": {
        "status": {
            "http_api": {
                "path": "/var/lib/influxdb2/engine"
            },
            "instance": "elastic-package-service_influxdb_1:8086",
            "storage": {
                "writer_timeouts": 0
            }
        }
    },
    "metricset": {
        "name": "collector",
        "period": 60000
    },
    "prometheus": {
        "labels": {}
    },
    "service": {
        "address": "http://elastic-package-service_influxdb_1:8086/metrics",
        "type": "prometheus"
    }
}
Advanced status metric include details of query execution statistics, compaction levels, retention details, errors & partial writes, latency etc.
ECS Field Reference
Please refer to the following document for detailed information on ECS fields.
Exported fields
| Field | Description | Type |
|---|---|---|
| @timestamp | Event timestamp. | date |
| agent.id | Unique identifier of this agent (if one exists). Example: For Beats this would be beat.id. | keyword |
| cloud.account.id | The cloud account or organization id used to identify different entities in a multi-tenant environment. Examples: AWS account id, Google Cloud ORG Id, or other unique identifier. | keyword |
| cloud.availability_zone | Availability zone in which this host, resource, or service is located. | keyword |
| cloud.instance.id | Instance ID of the host machine. | keyword |
| cloud.provider | Name of the cloud provider. Example values are aws, azure, gcp, or digitalocean. | keyword |
| cloud.region | Region in which this host, resource, or service is located. | keyword |
| container.id | Unique container id. | keyword |
| data_stream.dataset | Data stream dataset. | constant_keyword |
| data_stream.namespace | Data stream namespace. | constant_keyword |
| data_stream.type | Data stream type. | constant_keyword |
| host.name | Name of the host. It can contain what hostname returns on Unix systems, the fully qualified domain name (FQDN), or a name specified by the user. The recommended value is the lowercase FQDN of the host. | keyword |
| influxdb.advstatus.instance | InfluxDB instance. | keyword |
| influxdb.advstatus.labels.bucket | Bucket ID | keyword |
| influxdb.advstatus.labels.compiler_type | Type of the compiler | keyword |
| influxdb.advstatus.labels.engine | TSDB storage engine | keyword |
| influxdb.advstatus.labels.handler | Request handler. | keyword |
| influxdb.advstatus.labels.id | keyword | |
| influxdb.advstatus.labels.job | Type of the job | keyword |
| influxdb.advstatus.labels.level | Represents the level values such as cache, full, etc | keyword |
| influxdb.advstatus.labels.method | Type of service operation | keyword |
| influxdb.advstatus.labels.op | Extended information related to various operations | keyword |
| influxdb.advstatus.labels.path | HTTP request endpoint. | keyword |
| influxdb.advstatus.labels.quantile | Number that indicates the histogram quantile value. | keyword |
| influxdb.advstatus.labels.task_type | Type of the task | keyword |
| influxdb.advstatus.labels.taskid | Task ID of the influxdb tasks | keyword |
| influxdb.advstatus.labels.user_agent | Type of user agent | keyword |
| influxdb.advstatus.labels.walPath | Path to the WAL file | keyword |
| influxdb.advstatus.org | Organization id of the Organization created in InfluxDB. | keyword |
| influxdb.advstatus.query_controller.all_duration_seconds.histogram | Histogram of total times spent in all query states. | histogram |
| influxdb.advstatus.query_controller.compiling_duration_seconds.histogram | Histogram of times spent compiling queries. | histogram |
| influxdb.advstatus.query_controller.executing_duration_seconds.histogram | Histogram of times spent executing queries. | histogram |
| influxdb.advstatus.storage.compactions_duration_seconds.histogram | Histogram of compactions by level since startup. | histogram |
| influxdb.advstatus.storage.retention_check_duration.histogram | Histogram of duration of retention check in seconds. | histogram |
| influxdb.advstatus.storage.writer_dropped_points.histogram | Histogram of number of points dropped due to partial writes. | histogram |
| influxdb.advstatus.storage.writer_err_points.histogram | Histogram of number of points in errored shard write requests. | histogram |
| influxdb.advstatus.storage.writer_ok_points.histogram | Histogram of number of points in successful shard write requests. | histogram |
| influxdb.advstatus.storage.writer_req_points.histogram | Histogram of number of points requested to be written. | histogram |
| influxdb.advstatus.tasks.executor_run_latency_seconds.histogram | Records the latency between the time the run was due to run and the time the task started execution, by task type. | histogram |
| influxdb.advstatus.tasks.executor_run_queue_delta.histogram | The duration in seconds between a run being due to start and actually starting. | histogram |
| service.address | Address where data about this service was collected from. This should be a URI, network address (ipv4:port or [ipv6]:port) or a resource path (sockets). | keyword |
Example
{
    "@timestamp": "2022-09-22T05:54:15.452Z",
    "agent": {
        "ephemeral_id": "2928ccbb-957a-4054-9e87-c1af939d1ebf",
        "id": "f89b312e-866e-4215-bbb4-f0ddec5e4872",
        "name": "docker-fleet-agent",
        "type": "metricbeat",
        "version": "8.3.0"
    },
    "cloud": {
        "account": {
            "id": "elastic-obs-integrations-dev"
        },
        "availability_zone": "asia-south1-c",
        "instance": {
            "id": "3010911784348669868",
            "name": "service-integration-dev-idc-01"
        },
        "machine": {
            "type": "n1-standard-8"
        },
        "project": {
            "id": "elastic-obs-integrations-dev"
        },
        "provider": "gcp",
        "service": {
            "name": "GCE"
        }
    },
    "data_stream": {
        "dataset": "influxdb.advstatus",
        "namespace": "ep",
        "type": "metrics"
    },
    "ecs": {
        "version": "8.11.0"
    },
    "elastic_agent": {
        "id": "f89b312e-866e-4215-bbb4-f0ddec5e4872",
        "snapshot": false,
        "version": "8.3.0"
    },
    "event": {
        "agent_id_status": "verified",
        "dataset": "influxdb.advstatus",
        "duration": 5889790,
        "ingested": "2022-09-22T05:54:16Z",
        "module": "prometheus"
    },
    "host": {
        "architecture": "x86_64",
        "containerized": true,
        "hostname": "docker-fleet-agent",
        "ip": [
            "192.168.80.7"
        ],
        "mac": [
            "02-42-AC-1F-00-07"
        ],
        "name": "docker-fleet-agent",
        "os": {
            "codename": "focal",
            "family": "debian",
            "kernel": "5.4.0-1078-gcp",
            "name": "Ubuntu",
            "platform": "ubuntu",
            "type": "linux",
            "version": "20.04.4 LTS (Focal Fossa)"
        }
    },
    "influxdb": {
        "advstatus": {
            "instance": "elastic-package-service_influxdb_1:8086",
            "labels": {},
            "storage": {
                "writer_dropped_points": {
                    "histogram": {
                        "counts": [
                            0,
                            0,
                            0,
                            0,
                            0,
                            0
                        ],
                        "values": [
                            5,
                            55,
                            550,
                            5500,
                            55000,
                            190000
                        ]
                    }
                },
                "writer_err_points": {
                    "histogram": {
                        "counts": [
                            0,
                            0,
                            0,
                            0,
                            0,
                            0
                        ],
                        "values": [
                            5,
                            55,
                            550,
                            5500,
                            55000,
                            190000
                        ]
                    }
                },
                "writer_ok_points": {
                    "histogram": {
                        "counts": [
                            0,
                            0,
                            0,
                            0,
                            0,
                            0
                        ],
                        "values": [
                            5,
                            55,
                            550,
                            5500,
                            55000,
                            190000
                        ]
                    }
                },
                "writer_req_points": {
                    "histogram": {
                        "counts": [
                            0,
                            0,
                            0,
                            0,
                            0,
                            0
                        ],
                        "values": [
                            5,
                            55,
                            550,
                            5500,
                            55000,
                            190000
                        ]
                    }
                }
            },
            "storage_writer_dropped_points": {},
            "storage_writer_err_points": {},
            "storage_writer_ok_points": {},
            "storage_writer_req_points": {}
        }
    },
    "metricset": {
        "name": "collector",
        "period": 60000
    },
    "service": {
        "address": "http://elastic-package-service_influxdb_1:8086/metrics",
        "type": "prometheus"
    }
}
This integration includes one or more Kibana dashboards that visualizes the data collected by the integration. The screenshots below illustrate how the ingested data is displayed.
Changelog
| Version | Details | Minimum Kibana version |
|---|---|---|
| 0.11.0 | Enhancement (View pull request) Add support for Kibana 9.0.0. |
9.0.0 8.13.0 |
| 0.10.0 | Enhancement (View pull request) Add processor support for advstatus and status data streams. |
8.13.0 |
| 0.9.0 | Enhancement (View pull request) ECS version updated to 8.11.0. Update the kibana constraint to ^8.13.0. Modified the field definitions to remove ECS fields made redundant by the ecs@mappings component template. |
8.13.0 |
| 0.8.0 | Enhancement (View pull request) Add global filter on data_stream.dataset to improve performance. |
8.9.0 |
| 0.7.0 | Enhancement (View pull request) Update the package format_version to 3.0.0. |
8.9.0 |
| 0.6.0 | Enhancement (View pull request) Enable time series data streams for the metrics datasets. This dramatically reduces storage for metrics and is expected to progressively improve query performance. For more details, see https://www.elastic.co/guide/en/elasticsearch/reference/current/tsds.html. |
8.8.0 |
| 0.5.0 | Enhancement (View pull request) Rename ownership from obs-service-integrations to obs-infraobs-integrations |
8.6.0 |
| 0.4.3 | Bug fix (View pull request) Added additional dimension fields for status datastream. |
8.6.0 |
| 0.4.2 | Bug fix (View pull request) Modifed the dimension field mapping to support public cloud deployment. |
8.6.0 |
| 0.4.1 | Bug fix (View pull request) Add additional dimension field for advstatus datastream. |
8.6.0 |
| 0.4.0 | Enhancement (View pull request) Migrate visualizations to lens. |
8.6.0 |
| 0.3.0 | Enhancement (View pull request) TSDB Enablment changes included, Minor bug fixes. |
8.6.0 |
| 0.2.1 | Enhancement (View pull request) Added categories and/or subcategories. |
8.3.0 |
| 0.2.0 | Enhancement (View pull request) Update ECS version to 8.5.1 |
8.3.0 |
| 0.1.0 | Enhancement (View pull request) This integration is for ingesting task, storage, golang, performance related metrics from InfluxDB OSS 2.x databases. |
8.3.0 |