First EPSS
Elastic Cloud Serverless projects are autoscaled environments, fully managed by Elastic and available on Elastic Cloud. Availability This functionality is generally available and ready for production usage. Elastic Cloud Serverless projects are autoscaled environments, fully managed by Elastic and available on Elastic Cloud. Availability This functionality is generally available and ready for production usage. The Elastic Stack includes Elastic's core products such as Elasticsearch, Kibana, Logstash, and Beats. Availability This functionality is generally available and ready for production usage. Unless stated otherwise on the page, this functionality is available when your Elastic Stack is deployed on Elastic Cloud Hosted, Elastic Cloud Enterprise, Elastic Cloud on Kubernetes, and self-managed environments. This documentation corresponds to the latest patch available for each minor version. If you're not using the latest patch, check the release notes for changes.
Serverless Observability
Generally available
Serverless Security
Generally available
Stack
9.0+
Generally available since 9.0
| Version | 1.7.0 (View all) |
| Managed integration release status | GA |
| Subscription level What's this? |
Basic |
| Developed by What's this? |
Community |
| Ingestion method(s) | API |
| Minimum Kibana version(s) | 9.0.5 8.19.2 |
You can use this integration as an Elastic Managed integration on Elastic Cloud Hosted deployments running this version or later.
The First EPSS integration allows users to retrieve EPSS score from First EPSS API.
The Exploit Prediction Scoring System (EPSS) is a data-driven effort for estimating the likelihood (probability) that a software vulnerability (CVE) will be exploited in the wild.
Elastic Managed integrations are only supported on Elastic Cloud Serverless and Elastic Cloud Hosted deployments. An Elastic Managed integration lets you ingest data from a cloud source while avoiding the orchestration, management, and maintenance associated with standard ingest infrastructure. Elastic runs the collector for you, so you can focus on your data instead of the infrastructure that collects it.
For more information, refer to Elastic Managed integrations and the Elastic Managed integrations FAQ.
The First EPSS integration collects one type of data stream: vulnerability
EPSS scores are retrieved via the First EPSS API (https://api.first.org/data/v1/epss).
The package ships a latest transform that maintains the most recent EPSS score per CVE in the lookup index logs-first_epss_latest.vulnerability. The full EPSS catalog is re-ingested on every poll cycle, so the same CVE is re-ingested repeatedly with updated scores. The transform collapses those snapshots into the latest row per CVE, making it the preferred enrichment path.
You can enrich vulnerability findings at query time with the ES|QL LOOKUP JOIN command on vulnerability.id:
FROM logs-endpoint.vulnerability-*
| LOOKUP JOIN logs-first_epss_latest.vulnerability ON vulnerability.id
| KEEP vulnerability.id, first_epss.vulnerability.epss, first_epss.vulnerability.percentile, first_epss.vulnerability.date
| WHERE first_epss.vulnerability.epss IS NOT NULL
This integration has been tested against the EPSS API v1.
You need Elasticsearch for storing and searching your data and Kibana for visualizing and managing it. You can use our hosted Elasticsearch Service on Elastic Cloud, which is recommended, or self-manage the Elastic Stack on your own hardware.
For step-by-step instructions on how to set up an integration, see the Getting started guide.
This is the vulnerability dataset.
Example
{
    "@timestamp": "2026-10-06T20:30:28.953Z",
    "agent": {
        "ephemeral_id": "e5f88865-29bd-48c3-84ca-f8b1dc6b8bd9",
        "id": "807d40d8-b29b-47c4-977a-97c9a1bce295",
        "name": "elastic-agent-86119",
        "type": "filebeat",
        "version": "9.5.4"
    },
    "data_stream": {
        "dataset": "first_epss.vulnerability",
        "namespace": "92826",
        "type": "logs"
    },
    "ecs": {
        "version": "8.11.0"
    },
    "elastic_agent": {
        "id": "807d40d8-b29b-47c4-977a-97c9a1bce295",
        "snapshot": false,
        "version": "9.5.4"
    },
    "event": {
        "agent_id_status": "verified",
        "category": [
            "vulnerability"
        ],
        "dataset": "first_epss.vulnerability",
        "ingested": "2026-10-06T20:30:31Z",
        "kind": "enrichment",
        "module": "first_epss",
        "type": [
            "info"
        ]
    },
    "first_epss": {
        "vulnerability": {
            "cve": "CVE-2024-8348",
            "date": "2024-08-31T00:00:00.000Z",
            "epss": 0.00045,
            "percentile": 0.16323
        }
    },
    "host": {
        "architecture": "aarch64",
        "containerized": false,
        "hostname": "elastic-agent-86119",
        "ip": [
            "172.19.0.2",
            "172.18.0.7"
        ],
        "mac": [
            "5A-D3-26-3D-57-B8",
            "9E-AD-92-9D-70-E9"
        ],
        "name": "elastic-agent-86119",
        "os": {
            "family": "",
            "kernel": "7.0.14-linuxkit",
            "name": "Wolfi",
            "platform": "wolfi",
            "type": "linux",
            "version": "20230201"
        }
    },
    "input": {
        "type": "cel"
    },
    "labels": {
        "is_transform_source": "true"
    },
    "vulnerability": {
        "id": "CVE-2024-8348",
        "reference": "https://api.first.org/data/v1/epss?pretty=true&cve=CVE-2024-8348"
    }
}
Exported fields
| Field | Description | Type |
|---|---|---|
| @timestamp | Date/time when the event originated. This is the date/time extracted from the event, typically representing when the event was generated by the source. If the event source has no original timestamp, this value is typically populated by the first time the event was received by the pipeline. Required field for all events. | date |
| data_stream.dataset | The field can contain anything that makes sense to signify the source of the data. Examples include nginx.access, prometheus, endpoint etc. For data streams that otherwise fit, but that do not have dataset set we use the value "generic" for the dataset value. event.dataset should have the same value as data_stream.dataset. Beyond the Elasticsearch data stream naming criteria noted above, the dataset value has additional restrictions: * Must not contain - * No longer than 100 characters |
constant_keyword |
| data_stream.namespace | A user defined namespace. Namespaces are useful to allow grouping of data. Many users already organize their indices this way, and the data stream naming scheme now provides this best practice as a default. Many users will populate this field with default. If no value is used, it falls back to default. Beyond the Elasticsearch index naming criteria noted above, namespace value has the additional restrictions: * Must not contain - * No longer than 100 characters |
constant_keyword |
| data_stream.type | An overarching type for the data stream. Currently allowed values are "logs" and "metrics". We expect to also add "traces" and "synthetics" in the near future. | constant_keyword |
| ecs.version | ECS version this event conforms to. ecs.version is a required field and must exist in all events. When querying across multiple indices -- which may conform to slightly different ECS versions -- this field lets integrations adjust to the schema version of the events. |
keyword |
| event.category | This is one of four ECS Categorization Fields, and indicates the second level in the ECS category hierarchy. event.category represents the "big buckets" of ECS categories. For example, filtering on event.category:process yields all events relating to process activity. This field is closely related to event.type, which is used as a subcategory. This field is an array. This will allow proper categorization of some events that fall in multiple categories. |
keyword |
| event.dataset | Name of the dataset. If an event source publishes more than one type of log or events (e.g. access log, error log), the dataset is used to specify which one the event comes from. It's recommended but not required to start the dataset name with the module name, followed by a dot, then the dataset name. | constant_keyword |
| event.ingested | Timestamp when an event arrived in the central data store. This is different from @timestamp, which is when the event originally occurred. It's also different from event.created, which is meant to capture the first time an agent saw the event. In normal conditions, assuming no tampering, the timestamps should chronologically look like this: @timestamp < event.created < event.ingested. |
date |
| event.kind | This is one of four ECS Categorization Fields, and indicates the highest level in the ECS category hierarchy. event.kind gives high-level information about what type of information the event contains, without being specific to the contents of the event. For example, values of this field distinguish alert events from metric events. The value of this field can be used to inform how these kinds of events should be handled. They may warrant different retention, different access control, it may also help understand whether the data is coming in at a regular interval or not. |
keyword |
| event.module | Name of the module this data is coming from. If your monitoring agent supports the concept of modules or plugins to process events of a given source (e.g. Apache logs), event.module should contain the name of this module. |
constant_keyword |
| event.original | Raw text message of entire event. Used to demonstrate log integrity or where the full log message (before splitting it up in multiple parts) may be required, e.g. for reindex. This field is not indexed and doc_values are disabled. It cannot be searched, but it can be retrieved from _source. If users wish to override this and index this field, please see Field data types in the Elasticsearch Reference. |
keyword |
| event.type | This is one of four ECS Categorization Fields, and indicates the third level in the ECS category hierarchy. event.type represents a categorization "sub-bucket" that, when used along with the event.category field values, enables filtering events down to a level appropriate for single visualization. This field is an array. This will allow proper categorization of some events that fall in multiple event types. |
keyword |
| first_epss.vulnerability.cve | CVE number. | keyword |
| first_epss.vulnerability.date | Exploit Prediction Scoring System score calculation date. | date |
| first_epss.vulnerability.epss | Exploit Prediction Scoring System score value. | float |
| first_epss.vulnerability.percentile | Exploit Prediction Scoring System percentile value. | float |
| input.type | Type of filebeat input. | keyword |
| labels.is_transform_source | Distinguishes between documents that are a source for a transform and documents that are an output of a transform, to facilitate easier filtering. | constant_keyword |
| tags | List of keywords used to tag each event. | keyword |
| vulnerability.id | The identification (ID) is the number portion of a vulnerability entry. It includes a unique identification number for the vulnerability. For example (https://cve.mitre.org/about/faqs.html#what_is_cve_id)[Common Vulnerabilities and Exposure CVE ID] | keyword |
| vulnerability.reference | A resource that provides additional information, context, and mitigations for the identified vulnerability. | keyword |
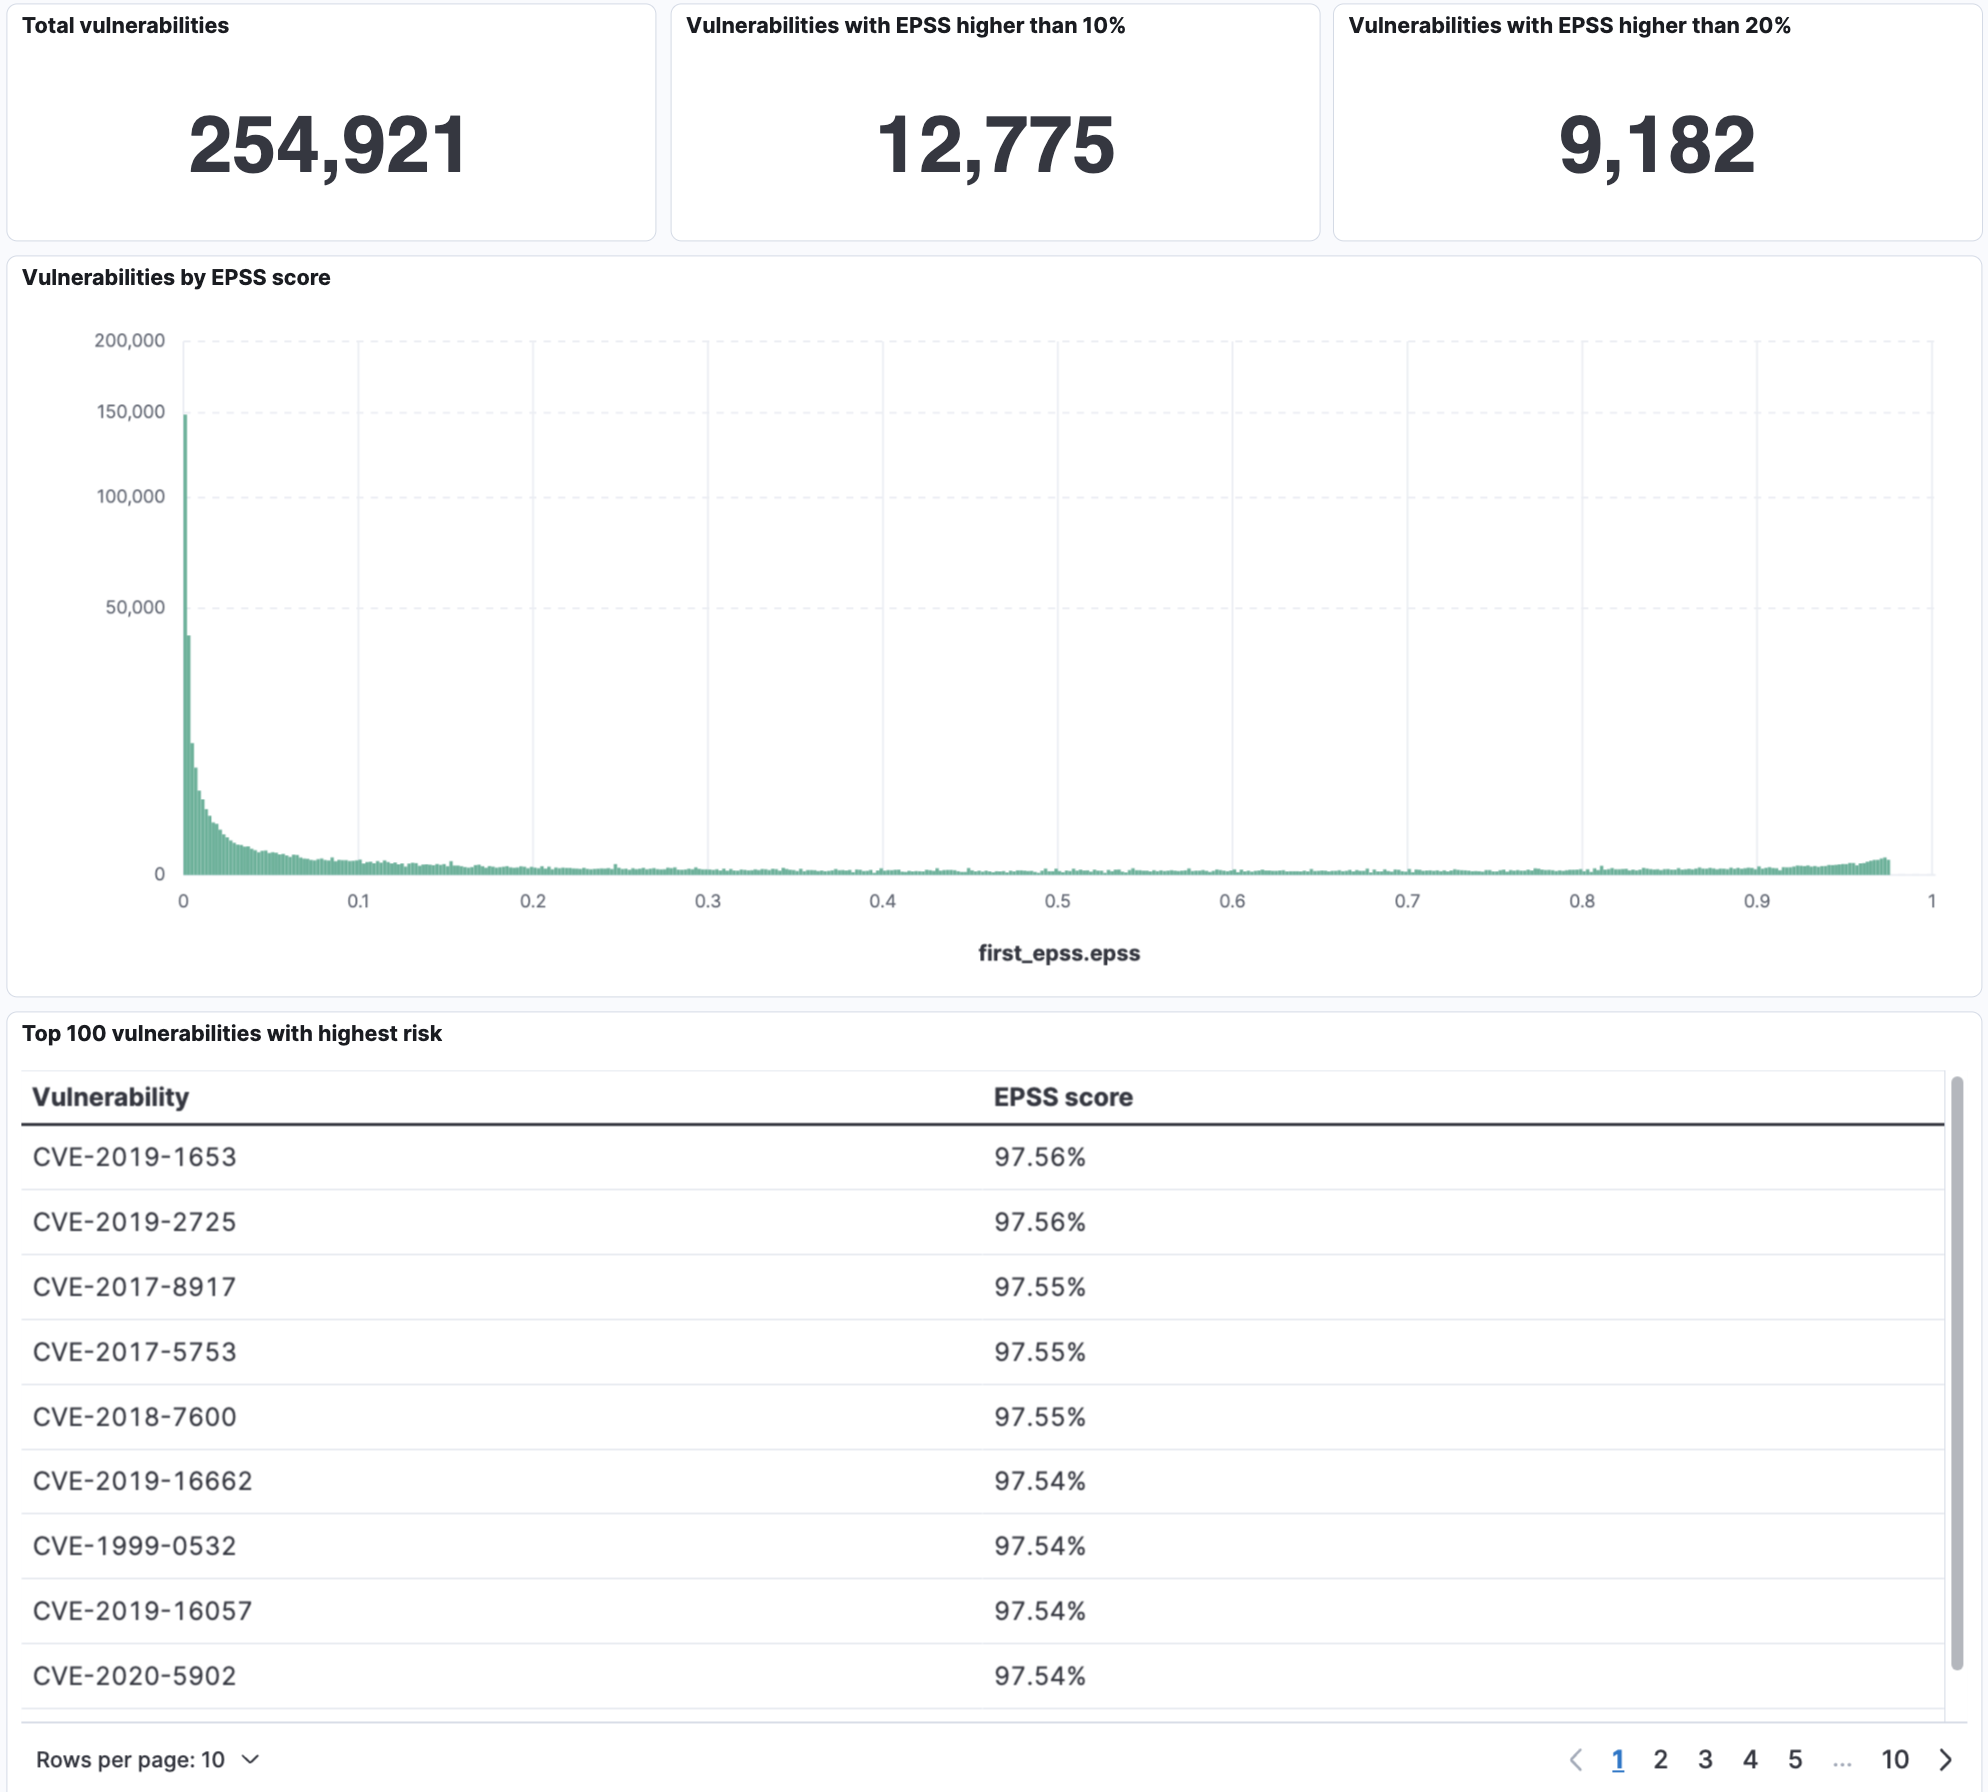
This integration includes one or more Kibana dashboards that visualizes the data collected by the integration. The screenshots below illustrate how the ingested data is displayed.
Changelog
| Version | Details | Minimum Kibana version |
|---|---|---|
| 1.7.0 | Enhancement (View pull request) Update Elastic Managed integration documentation to the current wording and docs links. |
9.0.5 8.19.2 |
| 1.6.0 | Enhancement (View pull request) Add a latest transform that maintains a deduplicated lookup index of EPSS scores per CVE for query-time enrichment with ES|QL LOOKUP JOIN. |
9.0.5 8.19.2 |
| 1.5.0 | Enhancement (View pull request) Add tags to ingest pipeline processors. |
9.0.5 8.19.2 |
| 1.4.1 | Enhancement (View pull request) Set agentless deployment mode release field to ga. |
9.0.5 8.19.2 |
| 1.4.0 | Enhancement (View pull request) Use new release field for agentless deployment mode to establish as beta. |
9.0.5 8.19.2 |
| 1.3.0 | Enhancement (View pull request) Enable Agentless deployment. |
9.0.5 8.19.2 |
| 1.2.0 | Enhancement (View pull request) Enable request trace log removal. |
9.0.0 8.16.0 |
| 1.1.1 | Bug fix (View pull request) Downgrade the format_version to the minimum version that supports all the necessary features for the package. |
9.0.0 8.16.0 |
| 1.1.0 | Enhancement (View pull request) Use terminate processor instead of fail processor to handle agent errors. |
9.0.0 8.16.0 |
| 1.0.0 | Enhancement (View pull request) Publish First EPSS major version 1.0.0. |
9.0.0 8.14.0 |
| 0.4.0 | Enhancement (View pull request) Update Kibana constraint to support 9.0.0. |
9.0.0 8.14.0 |
| 0.3.2 | Bug fix (View pull request) Updated SSL description in package manifest.yml to be uniform and to include links to documentation. |
8.14.0 |
| 0.3.1 | Bug fix (View pull request) Update links to getting started docs |
8.14.0 |
| 0.3.0 | Enhancement (View pull request) Add First logo |
8.14.0 |
| 0.2.0 | Enhancement (View pull request) Add "preserve_original_event" tag to documents with event.kind set to "pipeline_error". |
8.14.0 |
| 0.1.0 | Enhancement (View pull request) Initial release of the package |
8.14.0 |