Microsoft SQL Server Integration
Elastic Cloud Serverless projects are autoscaled environments, fully managed by Elastic and available on Elastic Cloud. Availability This functionality is generally available and ready for production usage. Elastic Cloud Serverless projects are autoscaled environments, fully managed by Elastic and available on Elastic Cloud. Availability This functionality is generally available and ready for production usage. The Elastic Stack includes Elastic's core products such as Elasticsearch, Kibana, Logstash, and Beats. Availability This functionality is generally available and ready for production usage. Unless stated otherwise on the page, this functionality is available when your Elastic Stack is deployed on Elastic Cloud Hosted, Elastic Cloud Enterprise, Elastic Cloud on Kubernetes, and self-managed environments. This documentation corresponds to the latest patch available for each minor version. If you're not using the latest patch, check the release notes for changes.
Serverless Observability
Generally available
Serverless Security
Generally available
Stack
9.2+
Generally available since 9.2
| Version | 2.18.0 (View all) |
| Subscription level What's this? |
Basic |
| Developed by What's this? |
Elastic |
| Ingestion method(s) | API, Database, File |
| Minimum Kibana version(s) | 9.2.1 8.19.0 |
The Microsoft SQL Server integration package allows you to search, observe, and visualize the SQL Server audit logs, as well as performance and transaction log metrics, through Elasticsearch.
The Microsoft SQL Server integration collects two types of data streams: logs and metrics.
Log data streams provide records of events happening in Microsoft SQL Server:
audit: Events from the configured Windows event log channel, providing detailed auditing information. See SQL Server Audit.logs: Error logs created by the Microsoft SQL server for troubleshooting and system events.
Other log sources, such as files, are not supported.
Find more details in Logs.
Metrics data streams provide insights into SQL Server performance and health:
performance: Comprehensive performance counters and objects available on the server.transaction_log: Usage statistics and space utilization metrics for transaction logs.availability_groups: Health and synchronization metrics for Always On Availability Groups.
Find more details in Metrics.
You need Elasticsearch for storing and searching your data and Kibana for visualizing and managing it. You can use our hosted Elasticsearch Service on Elastic Cloud, which is recommended, or self-manage the Elastic Stack on your hardware.
Before you can start sending data to Elastic, make sure you have the necessary Microsoft SQL Server permissions.
If you browse Microsoft Developer Network (MSDN) for the following tables, you will find a "Permissions" section that defines the permission needed for each table (for example, the "Permissions" section on the sys.dm_db_log_space_usage page).
transaction_log:- sys.databases
- sys.dm_db_log_space_usage
- sys.dm_db_log_stats (DB_ID) (Available on SQL Server (MSSQL) 2016 (13.x) SP 2 and later)
performance:availability_groups:
Please make sure the user has the permissions to system as well as user-defined databases. For the particular user used in the integration, the following requirements are met:
User setup options:
- Grant specific permissions as mentioned in the MSDN pages above.
- Alteratively, use
sysadminrole (includes all required permissions): This can be configured via SQL Server Management Studio (SSMS) inServer Roles. Read more about joining a role in the SQL Server documentation.
User Mappings (using SQL Server Management Studio (SSMS)):
- Open SSMS and connect to your server.
- Navigate to "Object Explorer" > "Security" > "Logins".
- Right-click the user and select "Properties".
- In the "User Mapping" tab, select the appropriate database and grant the required permissions.
For step-by-step instructions on how to set up any integration, refer to the Getting started guide.
Below you'll find more specific details on setting up the Microsoft SQL Server integration.
Microsoft SQL Server has a feature that allows running multiple databases on the same host (or clustered hosts) with separate settings. Establish a named instance connection by using the instance name along with the hostname (e.g. host/instance_name or host:named_instance_port) to collect metrics. Details of the host configuration are provided below.
The data can be visualized in Kibana by filtering based on the instance name and server name. The instance name can be filtered by mssql.metrics.instance_name and the server name by mssql.metrics.server_name fields.
As part of the input configuration, you need to provide the user name, password and host details. The host configuration supports both named instances or default (no-name) instances, using the syntax below.
This integration supports collecting metrics from a single host. For multi-host metrics, each host can be run as a new integration.
Connecting to Default Instance (host):
host(e.g.localhost(Instance name is not needed when connecting to default instance))host:port(e.g.localhost:1433)
Connecting to Named Instance (host):
host/instance_name(e.g.localhost/namedinstance_01)host:named_instance_port(e.g.localhost:60873)
There are several levels of auditing for SQL Server, depending on government or standards requirements for your installation. The SQL Server Audit feature enables you to audit server-level and database-level groups of events and individual events.
For more information on the different audit levels, refer to SQL Server Audit Action Groups and Actions. Then to enable auditing for SQL Server, refer to these instructions.
For the integration package to be able to read and send audit events the event target must be configured to be Windows event log.
Collects SQL Server audit events from the specified windows event log channel.
The SQL Server log contains user-defined events and certain system events you can use for troubleshooting.
Read more in View the SQL Server error log in SQL Server Management Studio.
Starting with version 2.18.0, the error log data stream uses the filestream input. This keeps the Elastic Agent unit healthy when an empty, utf-16le-bom encoded SQL Server error log is harvested, and it reads error logs smaller than 1 KiB.
Collects the performance counter metrics. The dynamic counter feature provides flexibility to collect metrics by providing the counter as an input.
This input can be a regular expression which will filter results based on pattern.
For example, if %grant% is given as input, it will enable metrics collection for all of the counters with names like 'Memory Grants Pending', 'Active memory grants count' etc.
MSSQL supports a limited set of regular expressions. For more details, refer to Pattern Matching in Search Conditions.
Dynamic counters will go through some basic ingest pipeline post-processing to make counter names in lowercase and remove special characters and these fields will not have any static field mappings.
The feature merge_results has been introduced in 8.4 beats which creates a single event by combining the metrics in a single event. For more details, refer to SQL module.
Read more in instructions about each performance counter metrics.
The system-level database transaction_log metrics for SQL Server instances are collected by default. Metrics for user-level databases can be collected by specifying a list of user databases or by enabling the Fetch from all databases toggle to collect metrics from all databases on the server.
Read more in instructions and the operations supported by transaction log.
To simplify the process of fetching metrics from all databases on the server, you can enable the Fetch from all databases toggle when configuring the integration. This field overrides manually entered database names in the Databases input and instead fetches the required transaction_log metrics from all databases, including system and user-defined databases.
Keep in mind that this feature is disabled by default and needs to be manually enabled to be activated.
When the password contains special characters, pass these special characters using URL encoding.
Collects metrics related to Always On Availability Groups, including replica status and synchronization health. This dataset queries the following SQL Server tables:
sys.availability_groupssys.dm_hadr_availability_group_states
Always On Availability Groups must be enabled on your SQL Server instance for this dataset to collect metrics. This feature is available in SQL Server Enterprise and Standard editions (with limitations in Standard).
Prerequisites: To collect Availability Groups metrics, ensure the following:
- Always On Availability Groups feature is enabled on the SQL Server instance.
- The user account configured for the integration has
VIEW SERVER STATEandVIEW ANY DEFINITIONpermissions. Additionally look at section Microsoft SQL Server permissions.
Read more in Monitor Availability Groups and Always On Availability Groups overview.
The SQL Server audit dataset provides events from the configured Windows event log channel. All SQL Server audit-specific fields are available in the sqlserver.audit field group.
ECS Field Reference
Please refer to the following document for detailed information on ECS fields.
Exported fields
| Field | Description | Type |
|---|---|---|
| @timestamp | Event timestamp. | date |
| cloud.image.id | Image ID for the cloud instance. | keyword |
| data_stream.dataset | Data stream dataset. | constant_keyword |
| data_stream.namespace | Data stream namespace. | constant_keyword |
| data_stream.type | Data stream type. | constant_keyword |
| host.containerized | If the host is a container. | boolean |
| host.os.build | OS build information. | keyword |
| host.os.codename | OS codename, if any. | keyword |
| sqlserver.audit.action_id | ID of the action | keyword |
| sqlserver.audit.additional_information | Any additional information about the event stored as XML. | text |
| sqlserver.audit.affected_rows | Number of rows affected by the operation. | long |
| sqlserver.audit.application_name | Name of the application that caused the audit event. | keyword |
| sqlserver.audit.audit_schema_version | Audit event schema version. | keyword |
| sqlserver.audit.class_type | Type of auditable entity that the audit occurs on. | keyword |
| sqlserver.audit.client_ip | "Name or IP address of the machine running the application that caused the audit event." | keyword |
| sqlserver.audit.connection_id | Connection ID (unique UUID for the connection) | keyword |
| sqlserver.audit.data_sensitivity_information | Sensitivity information about the operation. | keyword |
| sqlserver.audit.database_name | The database context in which the action occurred. | keyword |
| sqlserver.audit.database_principal_id | ID of the database user context that the action is performed in. | keyword |
| sqlserver.audit.database_principal_name | Current user. | keyword |
| sqlserver.audit.duration_milliseconds | Duration of the operation in milliseconds. | long |
| sqlserver.audit.event_time | Date/time when the auditable action is fired. | date |
| sqlserver.audit.host_name | SQL Server host name. | keyword |
| sqlserver.audit.is_column_permission | Flag indicating a column level permission | boolean |
| sqlserver.audit.object_id | "The primary ID of the entity on which the audit occurred. This ID can be one of server objects, databases, database objects or schema objects." | keyword |
| sqlserver.audit.object_name | "The name of the entity on which the audit occurred. This can be server objects, databases, database objects, schema objects or TSQL statement (if any)." | keyword |
| sqlserver.audit.permission_bitmask | When applicable shows the permissions that were granted, denied or revoked. | keyword |
| sqlserver.audit.response_rows | Number of rows returned. | long |
| sqlserver.audit.schema_name | The schema context in which the action occurred. | keyword |
| sqlserver.audit.sequence_group_id | Sequence group ID (unique UUID). | keyword |
| sqlserver.audit.sequence_number | Tracks the sequence of records within a single audit record that was too large to fit in the write buffer for audits. | integer |
| sqlserver.audit.server_instance_name | "Name of the server instance where the audit occurred. Uses the standard machine\instance format." | keyword |
| sqlserver.audit.server_principal_id | ID of the login context that the action is performed in. | keyword |
| sqlserver.audit.server_principal_name | Current login. | keyword |
| sqlserver.audit.server_principal_sid | Current login SID. | keyword |
| sqlserver.audit.session_id | ID of the session on which the event occurred. | integer |
| sqlserver.audit.session_server_principal_name | Server principal for the session. | keyword |
| sqlserver.audit.statement | TSQL statement (if any) | text |
| sqlserver.audit.succeeded | Indicates whether or not the permission check of the action triggering the audit event succeeded or failed. | boolean |
| sqlserver.audit.target_database_principal_id | Database principal that the auditable action applies to. | keyword |
| sqlserver.audit.target_database_principal_name | Target user of the action. | keyword |
| sqlserver.audit.target_server_principal_id | Server principal that the auditable action applies to. | keyword |
| sqlserver.audit.target_server_principal_name | Target login of the action. | keyword |
| sqlserver.audit.target_server_principal_sid | SID of the target login. | keyword |
| sqlserver.audit.transaction_id | Transaction ID | keyword |
| sqlserver.audit.user_defined_event_id | User defined event ID. | integer |
| sqlserver.audit.user_defined_information | User defined information | text |
| winlog.activity_id | A globally unique identifier that identifies the current activity. The events that are published with this identifier are part of the same activity. | keyword |
| winlog.api | The event log API type used to read the record. The possible values are "wineventlog" for the Windows Event Log API or "eventlogging" for the Event Logging API. The Event Logging API was designed for Windows Server 2003 or Windows 2000 operating systems. In Windows Vista, the event logging infrastructure was redesigned. On Windows Vista or later operating systems, the Windows Event Log API is used. Winlogbeat automatically detects which API to use for reading event logs. | keyword |
| winlog.channel | The name of the channel from which this record was read. This value is one of the names from the event_logs collection in the configuration. |
keyword |
| winlog.computer_name | The name of the computer that generated the record. When using Windows event forwarding, this name can differ from agent.hostname. |
keyword |
| winlog.event_data | The event-specific data. This field is mutually exclusive with user_data. If you are capturing event data on versions prior to Windows Vista, the parameters in event_data are named param1, param2, and so on, because event log parameters are unnamed in earlier versions of Windows. |
object |
| winlog.event_data.param1 | keyword | |
| winlog.event_data.param2 | keyword | |
| winlog.event_data.param3 | keyword | |
| winlog.event_data.param4 | keyword | |
| winlog.event_data.param5 | keyword | |
| winlog.event_data.param6 | keyword | |
| winlog.event_data.param7 | keyword | |
| winlog.event_data.param8 | keyword | |
| winlog.event_id | The event identifier. The value is specific to the source of the event. | keyword |
| winlog.keywords | The keywords are used to classify an event. | keyword |
| winlog.opcode | The opcode defined in the event. Task and opcode are typically used to identify the location in the application from where the event was logged. | keyword |
| winlog.process.pid | The process_id of the Client Server Runtime Process. | long |
| winlog.process.thread.id | long | |
| winlog.provider_guid | A globally unique identifier that identifies the provider that logged the event. | keyword |
| winlog.provider_name | The source of the event log record (the application or service that logged the record). | keyword |
| winlog.record_id | The record ID of the event log record. The first record written to an event log is record number 1, and other records are numbered sequentially. If the record number reaches the maximum value (232 for the Event Logging API and 264 for the Windows Event Log API), the next record number will be 0. | keyword |
| winlog.related_activity_id | A globally unique identifier that identifies the activity to which control was transferred to. The related events would then have this identifier as their activity_id identifier. |
keyword |
| winlog.task | The task defined in the event. Task and opcode are typically used to identify the location in the application from where the event was logged. The category used by the Event Logging API (on pre Windows Vista operating systems) is written to this field. | keyword |
| winlog.user.domain | The domain that the account associated with this event is a member of. | keyword |
| winlog.user.identifier | The Windows security identifier (SID) of the account associated with this event. If Winlogbeat cannot resolve the SID to a name, then the user.name, user.domain, and user.type fields will be omitted from the event. If you discover Winlogbeat not resolving SIDs, review the log for clues as to what the problem may be. |
keyword |
| winlog.user.name | Name of the user associated with this event. | keyword |
| winlog.user.type | The type of account associated with this event. | keyword |
| winlog.user_data | The event specific data. This field is mutually exclusive with event_data. |
object |
| winlog.version | The version number of the event's definition. | long |
The Microsoft SQL Server log dataset parses error logs created by the Microsoft SQL server.
Example
{
    "@timestamp": "2022-07-14T07:12:49.210Z",
    "agent": {
        "ephemeral_id": "688f9c4d-2ac0-43b6-9421-bf465d5c92f0",
        "id": "42a4484f-4eb2-4802-bd76-1f1118713d64",
        "name": "docker-fleet-agent",
        "type": "filebeat",
        "version": "8.3.0"
    },
    "cloud": {
        "account": {},
        "instance": {
            "id": "b30e45e6-7900-4900-8d67-e37cb13374bc",
            "name": "obs-int-windows-dev"
        },
        "machine": {
            "type": "Standard_D16ds_v5"
        },
        "provider": "azure",
        "region": "CentralIndia",
        "service": {
            "name": "Virtual Machines"
        }
    },
    "data_stream": {
        "dataset": "microsoft_sqlserver.log",
        "namespace": "ep",
        "type": "logs"
    },
    "ecs": {
        "version": "8.11.0"
    },
    "elastic_agent": {
        "id": "42a4484f-4eb2-4802-bd76-1f1118713d64",
        "snapshot": false,
        "version": "8.3.0"
    },
    "event": {
        "agent_id_status": "verified",
        "category": [
            "database"
        ],
        "dataset": "microsoft_sqlserver.log",
        "ingested": "2022-07-14T07:13:12Z",
        "kind": "event",
        "original": "2022-07-14 07:12:49.21 Server      Microsoft SQL Server 2019 (RTM-CU16-GDR) (KB5014353) - 15.0.4236.7 (X64) \n\tMay 29 2022 15:55:47 \n\tCopyright (C) 2019 Microsoft Corporation\n\tDeveloper Edition (64-bit) on Linux (Ubuntu 20.04.4 LTS) <X64>",
        "type": [
            "info"
        ]
    },
    "input": {
        "type": "filestream"
    },
    "log": {
        "file": {
            "device_id": "77",
            "inode": "768087",
            "path": "/tmp/service_logs/errorlog"
        },
        "flags": [
            "multiline"
        ],
        "offset": 0
    },
    "message": "Microsoft SQL Server 2019 (RTM-CU16-GDR) (KB5014353) - 15.0.4236.7 (X64) \n\tMay 29 2022 15:55:47 \n\tCopyright (C) 2019 Microsoft Corporation\n\tDeveloper Edition (64-bit) on Linux (Ubuntu 20.04.4 LTS) <X64>",
    "microsoft_sqlserver": {
        "log": {
            "origin": "Server"
        }
    },
    "tags": [
        "mssql-logs"
    ]
}
ECS Field Reference
Please refer to the following document for detailed information on ECS fields.
Exported fields
| Field | Description | Type |
|---|---|---|
| @timestamp | Event timestamp. | date |
| cloud.image.id | Image ID for the cloud instance. | keyword |
| data_stream.dataset | Data stream dataset. | constant_keyword |
| data_stream.namespace | Data stream namespace. | constant_keyword |
| data_stream.type | Data stream type. | constant_keyword |
| event.dataset | Event dataset | constant_keyword |
| event.module | Event module | constant_keyword |
| host.containerized | If the host is a container. | boolean |
| host.os.build | OS build information. | keyword |
| host.os.codename | OS codename, if any. | keyword |
| input.type | Type of Filebeat input. | keyword |
| log.file.device_id | ID of the device containing the filesystem where the file resides. | keyword |
| log.file.idxhi | The high-order part of a unique identifier that is associated with a file. (Windows-only) | keyword |
| log.file.idxlo | The low-order part of a unique identifier that is associated with a file. (Windows-only) | keyword |
| log.file.inode | Inode number of the log file. | keyword |
| log.file.vol | The serial number of the volume that contains a file. (Windows-only) | keyword |
| log.flags | This field contains the flags of the event. | keyword |
| log.offset | Offset of the entry in the log file. | long |
| microsoft_sqlserver.log.origin | Origin of the message usually the server but it can also be a recovery process | keyword |
The Microsoft SQL Server performance dataset provides metrics from the performance counter table. All performance metrics will be available in the sqlserver.metrics field group.
Example
{
    "@timestamp": "2025-01-16T06:17:48.647Z",
    "agent": {
        "ephemeral_id": "de13136c-dc52-4b51-87c3-7fe7592f46dc",
        "id": "c0b6b234-d11b-4387-ab3b-fa3084042073",
        "name": "elastic-agent-74192",
        "type": "metricbeat",
        "version": "8.18.0"
    },
    "data_stream": {
        "dataset": "microsoft_sqlserver.performance",
        "namespace": "93265",
        "type": "metrics"
    },
    "ecs": {
        "version": "8.0.0"
    },
    "elastic_agent": {
        "id": "c0b6b234-d11b-4387-ab3b-fa3084042073",
        "snapshot": true,
        "version": "8.18.0"
    },
    "event": {
        "agent_id_status": "verified",
        "dataset": "microsoft_sqlserver.performance",
        "duration": 71801450,
        "ingested": "2025-01-16T06:17:51Z",
        "module": "sql"
    },
    "host": {
        "architecture": "x86_64",
        "containerized": true,
        "hostname": "elastic-agent-74192",
        "ip": [
            "192.168.242.2",
            "192.168.255.6"
        ],
        "mac": [
            "02-42-C0-A8-F2-02",
            "02-42-C0-A8-FF-06"
        ],
        "name": "elastic-agent-74192",
        "os": {
            "family": "",
            "kernel": "3.10.0-1160.92.1.el7.x86_64",
            "name": "Wolfi",
            "platform": "wolfi",
            "type": "linux",
            "version": "20230201"
        }
    },
    "metricset": {
        "name": "query",
        "period": 60000
    },
    "mssql": {
        "metrics": {
            "active_temp_tables": 0,
            "batch_requests_per_sec": 15,
            "buffer_cache_hit_ratio": 995,
            "buffer_cache_hit_ratio_pct": 0.995,
            "buffer_checkpoint_pages_per_sec": 70,
            "buffer_database_pages": 2208,
            "buffer_page_life_expectancy": 19,
            "buffer_target_pages": 1196032,
            "compilations_per_sec": 67,
            "connection_reset_per_sec": 13,
            "instance_name": "MSSQLSERVER",
            "lock_waits_per_sec": 3,
            "logins_per_sec": 3,
            "logouts_per_sec": 2,
            "memory_grants_pending": 0,
            "page_splits_per_sec": 9,
            "re_compilations_per_sec": 0,
            "server_name": "ec6574eadb15",
            "transactions": 0,
            "user_connections": 1
        },
        "query": [
            "SELECT @@servername AS server_name, @@servicename AS instance_name;",
            "SELECT cntr_value As 'active_temp_tables' FROM sys.dm_os_performance_counters WHERE counter_name = 'Active Temp Tables' AND object_name like '%General Statistics%'",
            "SELECT cntr_value As 'batch_requests_per_sec' FROM sys.dm_os_performance_counters WHERE counter_name = 'Batch Requests/sec'",
            "SELECT cntr_value As 'buffer_cache_hit_ratio' FROM sys.dm_os_performance_counters WHERE counter_name = 'Buffer cache hit ratio' AND object_name like '%Buffer Manager%'",
            "SELECT CAST(CASE WHEN base.cntr_value > 0 THEN (num.cntr_value * 1.0 / base.cntr_value) ELSE NULL END AS FLOAT) As 'buffer_cache_hit_ratio_pct' FROM sys.dm_os_performance_counters AS num INNER JOIN sys.dm_os_performance_counters AS base ON base.object_name = num.object_name AND base.instance_name = num.instance_name WHERE num.counter_name = 'Buffer cache hit ratio' AND base.counter_name = 'Buffer cache hit ratio base' AND num.object_name like '%Buffer Manager%'",
            "SELECT cntr_value As 'buffer_checkpoint_pages_per_sec' FROM sys.dm_os_performance_counters WHERE counter_name = 'Checkpoint pages/sec' AND object_name like '%Buffer Manager%'",
            "SELECT cntr_value As 'buffer_database_pages' FROM sys.dm_os_performance_counters WHERE counter_name = 'Database pages' AND object_name like '%Buffer Manager%'",
            "SELECT cntr_value As 'buffer_page_life_expectancy' FROM sys.dm_os_performance_counters WHERE counter_name = 'Page life expectancy' AND  object_name like '%Buffer Manager%'",
            "SELECT cntr_value As 'buffer_target_pages' FROM sys.dm_os_performance_counters WHERE counter_name = 'Target pages' AND  object_name like '%Buffer Manager%'",
            "SELECT cntr_value As 'compilations_per_sec' FROM sys.dm_os_performance_counters WHERE counter_name = 'SQL Compilations/sec'",
            "SELECT cntr_value As 'connection_reset_per_sec' FROM sys.dm_os_performance_counters WHERE counter_name = 'Connection Reset/sec' AND object_name like '%General Statistics%'",
            "SELECT cntr_value As 'lock_waits_per_sec' FROM sys.dm_os_performance_counters WHERE counter_name = 'Lock Waits/sec' AND instance_name = '_Total'",
            "SELECT cntr_value As 'logins_per_sec' FROM sys.dm_os_performance_counters WHERE counter_name = 'Logins/sec' AND object_name like '%General Statistics%'",
            "SELECT cntr_value As 'logouts_per_sec' FROM sys.dm_os_performance_counters WHERE counter_name = 'Logouts/sec' AND object_name like '%General Statistics%'",
            "SELECT cntr_value As 'page_splits_per_sec' FROM sys.dm_os_performance_counters WHERE counter_name = 'Page splits/sec'",
            "SELECT cntr_value As 're_compilations_per_sec' FROM sys.dm_os_performance_counters WHERE counter_name = 'SQL Re-Compilations/sec'",
            "SELECT cntr_value As 'transactions' FROM sys.dm_os_performance_counters WHERE counter_name = 'Transactions' AND object_name like '%General Statistics%'",
            "SELECT cntr_value As 'user_connections' FROM sys.dm_os_performance_counters WHERE counter_name= 'User Connections'",
            "SELECT counter_name, cntr_value FROM sys.dm_os_performance_counters WHERE counter_name like 'Memory Grants Pend%'"
        ]
    },
    "service": {
        "address": "svc-microsoft_sqlserver",
        "type": "sql"
    },
    "tags": [
        "preserve_sql_queries"
    ]
}
ECS Field Reference
Please refer to the following document for detailed information on ECS fields.
Exported fields
| Field | Description | Type | Unit | Metric Type |
|---|---|---|---|---|
| @timestamp | Date/time when the event originated. This is the date/time extracted from the event, typically representing when the event was generated by the source. If the event source has no original timestamp, this value is typically populated by the first time the event was received by the pipeline. Required field for all events. | date | ||
| agent.id | Unique identifier of this agent (if one exists). Example: For Beats this would be beat.id. | keyword | ||
| cloud.account.id | The cloud account or organization id used to identify different entities in a multi-tenant environment. Examples: AWS account id, Google Cloud ORG Id, or other unique identifier. | keyword | ||
| cloud.availability_zone | Availability zone in which this host, resource, or service is located. | keyword | ||
| cloud.image.id | Image ID for the cloud instance. | keyword | ||
| cloud.instance.id | Instance ID of the host machine. | keyword | ||
| cloud.provider | Name of the cloud provider. Example values are aws, azure, gcp, or digitalocean. | keyword | ||
| cloud.region | Region in which this host, resource, or service is located. | keyword | ||
| container.id | Unique container id. | keyword | ||
| data_stream.dataset | The field can contain anything that makes sense to signify the source of the data. Examples include nginx.access, prometheus, endpoint etc. For data streams that otherwise fit, but that do not have dataset set we use the value "generic" for the dataset value. event.dataset should have the same value as data_stream.dataset. Beyond the Elasticsearch data stream naming criteria noted above, the dataset value has additional restrictions: * Must not contain - * No longer than 100 characters |
constant_keyword | ||
| data_stream.namespace | A user defined namespace. Namespaces are useful to allow grouping of data. Many users already organize their indices this way, and the data stream naming scheme now provides this best practice as a default. Many users will populate this field with default. If no value is used, it falls back to default. Beyond the Elasticsearch index naming criteria noted above, namespace value has the additional restrictions: * Must not contain - * No longer than 100 characters |
constant_keyword | ||
| data_stream.type | An overarching type for the data stream. Currently allowed values are "logs" and "metrics". We expect to also add "traces" and "synthetics" in the near future. | constant_keyword | ||
| host.containerized | If the host is a container. | boolean | ||
| host.name | Name of the host. It can contain what hostname returns on Unix systems, the fully qualified domain name (FQDN), or a name specified by the user. The recommended value is the lowercase FQDN of the host. | keyword | ||
| host.os.build | OS build information. | keyword | ||
| host.os.codename | OS codename, if any. | keyword | ||
| mssql.metrics.active_temp_tables | Number of temporary tables/table variables in use. | long | gauge | |
| mssql.metrics.batch_requests_per_sec | Number of Transact-SQL command batches received per second. This statistic is affected by all constraints (such as I/O, number of users, cache size, complexity of requests, and so on). High batch requests mean good throughput. | float | gauge | |
| mssql.metrics.buffer_cache_hit_ratio | Deprecated: use mssql.metrics.buffer_cache_hit_ratio_pct instead. The ratio is the total number of cache hits divided by the total number of cache lookups over the last few thousand page accesses. After a long period of time, the ratio moves very little. Because reading from the cache is much less expensive than reading from disk, you want this ratio to be high. |
double | gauge | |
| mssql.metrics.buffer_cache_hit_ratio_pct | Buffer cache hit ratio expressed as a fraction in [0, 1]. Computed at query time as Buffer cache hit ratio / Buffer cache hit ratio base, joining the numerator counter with its companion PERF_LARGE_RAW_BASE counter (cntr_type 1073939712) from sys.dm_os_performance_counters as required for PERF_LARGE_RAW_FRACTION counters. A healthy SQL Server typically reports values close to 1.0, indicating that most page requests were satisfied from the buffer cache rather than from disk. |
double | percent | gauge |
| mssql.metrics.buffer_checkpoint_pages_per_sec | Indicates the number of pages flushed to disk per second by a checkpoint or other operation that require all dirty pages to be flushed. | float | gauge | |
| mssql.metrics.buffer_database_pages | Indicates the number of pages in the buffer pool with database content. | long | gauge | |
| mssql.metrics.buffer_page_life_expectancy | Indicates the number of seconds a page will stay in the buffer pool without references (in seconds). | long | gauge | |
| mssql.metrics.buffer_target_pages | Ideal number of pages in the buffer pool. | long | gauge | |
| mssql.metrics.compilations_per_sec | Number of SQL compilations per second. Indicates the number of times the compile code path is entered. Includes compiles caused by statement-level recompilations in SQL Server. After SQL Server user activity is stable, this value reaches a steady state. | float | gauge | |
| mssql.metrics.connection_reset_per_sec | Total number of logins started per second from the connection pool. | float | gauge | |
| mssql.metrics.instance_name | Name of the mssql connected instance. | keyword | ||
| mssql.metrics.lock_waits_per_sec | Number of lock requests per second that required the caller to wait. | float | gauge | |
| mssql.metrics.logins_per_sec | Total number of logins started per second. This does not include pooled connections. | float | gauge | |
| mssql.metrics.logouts_per_sec | Total number of logout operations started per second. | float | gauge | |
| mssql.metrics.memory_grants_pending | This is generated from the default pattern given for Dynamic Counter Name variable. This counter tells us how many processes are waiting for the memory to be assigned to them so they can get started. | long | ||
| mssql.metrics.page_splits_per_sec | Number of page splits per second that occur as the result of overflowing index pages. | float | gauge | |
| mssql.metrics.re_compilations_per_sec | Number of statement recompiles per second. Counts the number of times statement recompiles are triggered. Generally, you want the recompiles to be low. | float | gauge | |
| mssql.metrics.server_name | Name of the mssql server. | keyword | ||
| mssql.metrics.transactions | Total number of transactions | long | gauge | |
| mssql.metrics.user_connections | Total number of user connections. | long | gauge | |
| mssql.query | The SQL queries executed. | keyword | ||
| service.address | Address where data about this service was collected from. This should be a URI, network address (ipv4:port or [ipv6]:port) or a resource path (sockets). | keyword |
The Microsoft SQL Server transaction_log dataset provides metrics from the log space usage and log stats tables. All transaction_log metrics will be available in the sqlserver.metrics field group.
Example
{
    "@timestamp": "2025-01-01T06:34:46.685Z",
    "agent": {
        "ephemeral_id": "a4c1f457-cd5c-4b62-aa68-1f5d32acb43b",
        "id": "7a86be58-ca0e-433a-bd57-44f2cb3ee3a1",
        "name": "elastic-agent-78750",
        "type": "metricbeat",
        "version": "8.13.0"
    },
    "data_stream": {
        "dataset": "microsoft_sqlserver.transaction_log",
        "namespace": "69278",
        "type": "metrics"
    },
    "ecs": {
        "version": "8.0.0"
    },
    "elastic_agent": {
        "id": "7a86be58-ca0e-433a-bd57-44f2cb3ee3a1",
        "snapshot": false,
        "version": "8.13.0"
    },
    "event": {
        "agent_id_status": "verified",
        "dataset": "microsoft_sqlserver.transaction_log",
        "duration": 2065982241,
        "ingested": "2025-01-01T06:34:49Z",
        "module": "sql"
    },
    "host": {
        "architecture": "x86_64",
        "containerized": true,
        "hostname": "elastic-agent-78750",
        "id": "8259e024976a406e8a54cdbffeb84fec",
        "ip": [
            "192.168.241.5",
            "192.168.253.2"
        ],
        "mac": [
            "02-42-C0-A8-F1-05",
            "02-42-C0-A8-FD-02"
        ],
        "name": "elastic-agent-78750",
        "os": {
            "codename": "focal",
            "family": "debian",
            "kernel": "3.10.0-1160.92.1.el7.x86_64",
            "name": "Ubuntu",
            "platform": "ubuntu",
            "type": "linux",
            "version": "20.04.6 LTS (Focal Fossa)"
        }
    },
    "metricset": {
        "name": "query",
        "period": 60000
    },
    "mssql": {
        "metrics": {
            "database_id": 4,
            "database_name": "msdb",
            "instance_name": "MSSQLSERVER",
            "query_id": "JZwfIFXvA3yOOL15q7PFZK5UE+Y=",
            "server_name": "7e672355554d"
        },
        "query": "SELECT @@servername AS server_name, @@servicename AS instance_name, name As 'database_name', database_id FROM sys.databases WHERE name='msdb';"
    },
    "service": {
        "address": "svc-microsoft_sqlserver",
        "type": "sql"
    },
    "tags": [
        "preserve_sql_queries"
    ]
}
ECS Field Reference
Please refer to the following document for detailed information on ECS fields.
Exported fields
| Field | Description | Type | Unit | Metric Type |
|---|---|---|---|---|
| @timestamp | Date/time when the event originated. This is the date/time extracted from the event, typically representing when the event was generated by the source. If the event source has no original timestamp, this value is typically populated by the first time the event was received by the pipeline. Required field for all events. | date | ||
| agent.id | Unique identifier of this agent (if one exists). Example: For Beats this would be beat.id. | keyword | ||
| cloud.account.id | The cloud account or organization id used to identify different entities in a multi-tenant environment. Examples: AWS account id, Google Cloud ORG Id, or other unique identifier. | keyword | ||
| cloud.availability_zone | Availability zone in which this host, resource, or service is located. | keyword | ||
| cloud.image.id | Image ID for the cloud instance. | keyword | ||
| cloud.instance.id | Instance ID of the host machine. | keyword | ||
| cloud.provider | Name of the cloud provider. Example values are aws, azure, gcp, or digitalocean. | keyword | ||
| cloud.region | Region in which this host, resource, or service is located. | keyword | ||
| container.id | Unique container id. | keyword | ||
| data_stream.dataset | The field can contain anything that makes sense to signify the source of the data. Examples include nginx.access, prometheus, endpoint etc. For data streams that otherwise fit, but that do not have dataset set we use the value "generic" for the dataset value. event.dataset should have the same value as data_stream.dataset. Beyond the Elasticsearch data stream naming criteria noted above, the dataset value has additional restrictions: * Must not contain - * No longer than 100 characters |
constant_keyword | ||
| data_stream.namespace | A user defined namespace. Namespaces are useful to allow grouping of data. Many users already organize their indices this way, and the data stream naming scheme now provides this best practice as a default. Many users will populate this field with default. If no value is used, it falls back to default. Beyond the Elasticsearch index naming criteria noted above, namespace value has the additional restrictions: * Must not contain - * No longer than 100 characters |
constant_keyword | ||
| data_stream.type | An overarching type for the data stream. Currently allowed values are "logs" and "metrics". We expect to also add "traces" and "synthetics" in the near future. | constant_keyword | ||
| host.containerized | If the host is a container. | boolean | ||
| host.name | Name of the host. It can contain what hostname returns on Unix systems, the fully qualified domain name (FQDN), or a name specified by the user. The recommended value is the lowercase FQDN of the host. | keyword | ||
| host.os.build | OS build information. | keyword | ||
| host.os.codename | OS codename, if any. | keyword | ||
| mssql.metrics.active_log_size | Total active transaction log size in bytes. | long | byte | counter |
| mssql.metrics.database_id | Unique ID of the database inside MSSQL. | long | ||
| mssql.metrics.database_name | Name of the database. | keyword | ||
| mssql.metrics.instance_name | Name of the mssql connected instance. | keyword | ||
| mssql.metrics.log_backup_time | Last transaction log backup time. | date | ||
| mssql.metrics.log_recovery_size | Log size in bytes since log recovery log sequence number (LSN). | long | byte | gauge |
| mssql.metrics.log_since_last_checkpoint | Log size in bytes since last checkpoint log sequence number (LSN). | long | byte | gauge |
| mssql.metrics.log_since_last_log_backup | Log file size since last backup in bytes. | long | byte | gauge |
| mssql.metrics.log_space_in_bytes_since_last_backup | The amount of space used since the last log backup in bytes. | long | byte | gauge |
| mssql.metrics.query_id | Autogenerated ID representing the mssql query that is executed to fetch the results. | keyword | ||
| mssql.metrics.server_name | Name of the mssql server. | keyword | ||
| mssql.metrics.total_log_size | Total log size. | long | byte | counter |
| mssql.metrics.total_log_size_bytes | Total transaction log size in bytes. | long | byte | counter |
| mssql.metrics.used_log_space_bytes | The occupied size of the log in bytes. | long | byte | gauge |
| mssql.metrics.used_log_space_pct | A percentage of the occupied size of the log as a percent of the total log size. | float | percent | gauge |
| mssql.query | The SQL queries executed. | keyword | ||
| service.address | Address where data about this service was collected from. This should be a URI, network address (ipv4:port or [ipv6]:port) or a resource path (sockets). | keyword |
The Microsoft SQL Server availability_groups dataset provides metrics from the Always On Availability Groups DMVs (Dynamic Management Views). All availability_groups metrics will be available in the sqlserver.metrics field group.
Example
{
    "@timestamp": "2026-01-09T13:26:41.427Z",
    "agent": {
        "ephemeral_id": "9879229c-2cb1-4082-a6e7-289de62de193",
        "id": "819a1c28-7fc6-4490-8456-c04d37abce3d",
        "name": "elastic-agent-12312",
        "type": "metricbeat",
        "version": "8.19.8"
    },
    "data_stream": {
        "dataset": "microsoft_sqlserver.availability_groups",
        "namespace": "default",
        "type": "metrics"
    },
    "ecs": {
        "version": "8.0.0"
    },
    "elastic_agent": {
        "id": "819a1c28-7fc6-4490-8456-c04d37abce3d",
        "snapshot": false,
        "version": "8.19.8"
    },
    "event": {
        "agent_id_status": "verified",
        "dataset": "microsoft_sqlserver.availability_groups",
        "duration": 797064208,
        "ingested": "2026-01-09T13:26:43Z",
        "module": "sql"
    },
    "host": {
        "architecture": "arm64",
        "hostname": "localhost",
        "id": "11111-8ABC-59B6-95BC-11111111",
        "ip": [
            "192.168.242.2",
            "192.168.255.6"
        ],
        "mac": [
            "02-42-C0-A8-F2-02",
            "02-42-C0-A8-FF-06"
        ],
        "name": "elastic-agent-12312",
        "os": {
            "build": "24G84",
            "family": "darwin",
            "kernel": "24.6.0",
            "name": "macOS",
            "platform": "darwin",
            "type": "macos",
            "version": "15.6"
        }
    },
    "metricset": {
        "name": "query",
        "period": 300000
    },
    "mssql": {
        "metrics": {
            "group_id": "13495A5F-460C-4D93-BFA2-477E9F555A5A",
            "name": "ag_test",
            "primary_recovery_health": 1,
            "primary_replica": "myVm-1",
            "server_name": "myVm-1",
            "synchronization_health": 2,
            "synchronization_health_desc": "HEALTHY"
        }
    },
    "service": {
        "address": "microsoft_sqlserver",
        "type": "sql"
    }
}
ECS Field Reference
Please refer to the following document for detailed information on ECS fields.
Exported fields
| Field | Description | Type | Metric Type |
|---|---|---|---|
| @timestamp | Event timestamp. | date | |
| agent.id | Unique identifier of this agent (if one exists). Example: For Beats this would be beat.id. | keyword | |
| cloud.account.id | The cloud account or organization id used to identify different entities in a multi-tenant environment. Examples: AWS account id, Google Cloud ORG Id, or other unique identifier. | keyword | |
| cloud.availability_zone | Availability zone in which this host, resource, or service is located. | keyword | |
| cloud.instance.id | Instance ID of the host machine. | keyword | |
| cloud.provider | Name of the cloud provider. Example values are aws, azure, gcp, or digitalocean. | keyword | |
| cloud.region | Region in which this host, resource, or service is located. | keyword | |
| container.id | Unique container id. | keyword | |
| data_stream.dataset | Data stream dataset. | constant_keyword | |
| data_stream.namespace | Data stream namespace. | constant_keyword | |
| data_stream.type | Data stream type. | constant_keyword | |
| host.name | Name of the host. It can contain what hostname returns on Unix systems, the fully qualified domain name (FQDN), or a name specified by the user. The recommended value is the lowercase FQDN of the host. | keyword | |
| mssql.metrics.group_id | Unique identifier (GUID) of the availability group. | keyword | |
| mssql.metrics.name | Availability group name. | keyword | |
| mssql.metrics.primary_recovery_health | Primary replica recovery health (0 = ONLINE_IN_PROGRESS, 1 = ONLINE. NULL on secondary replicas). | long | gauge |
| mssql.metrics.primary_replica | Server name of the current primary replica. | keyword | |
| mssql.metrics.secondary_recovery_health | Secondary replica recovery health (0 = ONLINE_IN_PROGRESS, 1 = ONLINE. NULL on primary replicas). | long | gauge |
| mssql.metrics.server_name | SQL Server instance name where metrics were collected. | keyword | |
| mssql.metrics.synchronization_health | AG synchronization health status (0 = NOT_HEALTHY, 1 = PARTIALLY_HEALTHY, 2 = HEALTHY). | long | gauge |
| mssql.metrics.synchronization_health_desc | Text description of AG synchronization health. | keyword | |
| mssql.query | The SQL queries executed. | keyword | |
| service.address | Address where data about this service was collected from. This should be a URI, network address (ipv4:port or [ipv6]:port) or a resource path (sockets). | keyword |
Alert rule templates provide pre-defined configurations for creating alert rules in Kibana.
For more information, refer to the Elastic documentation.
Alert rule templates require Elastic Stack version 9.2.0 or later.
The following alert rule templates are available:
[MicrosoftSQL Server] Lock Waits above threshold
[MicrosoftSQL Server] Memory Grants Pending above threshold
[MicrosoftSQL Server] Used Log Space above threshold
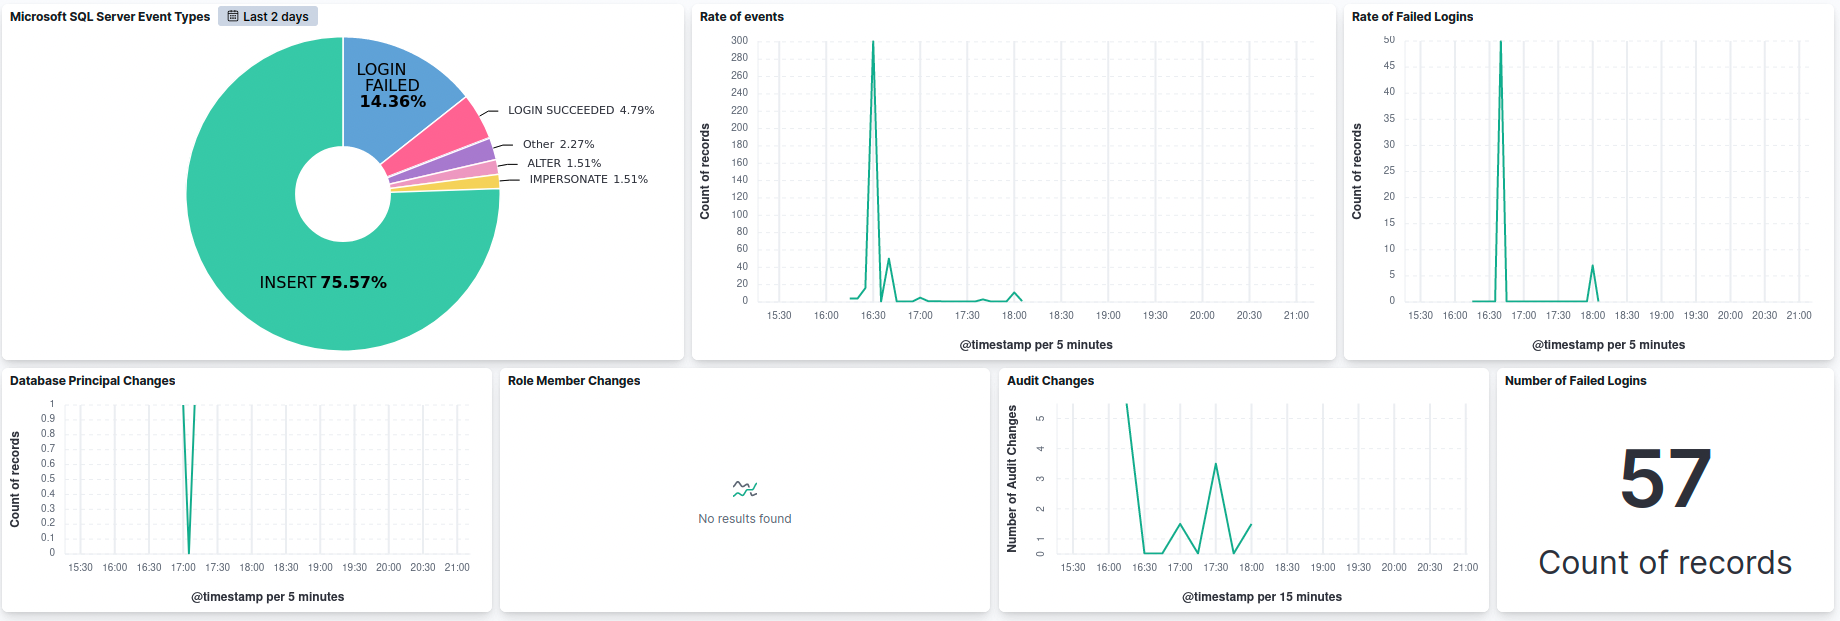
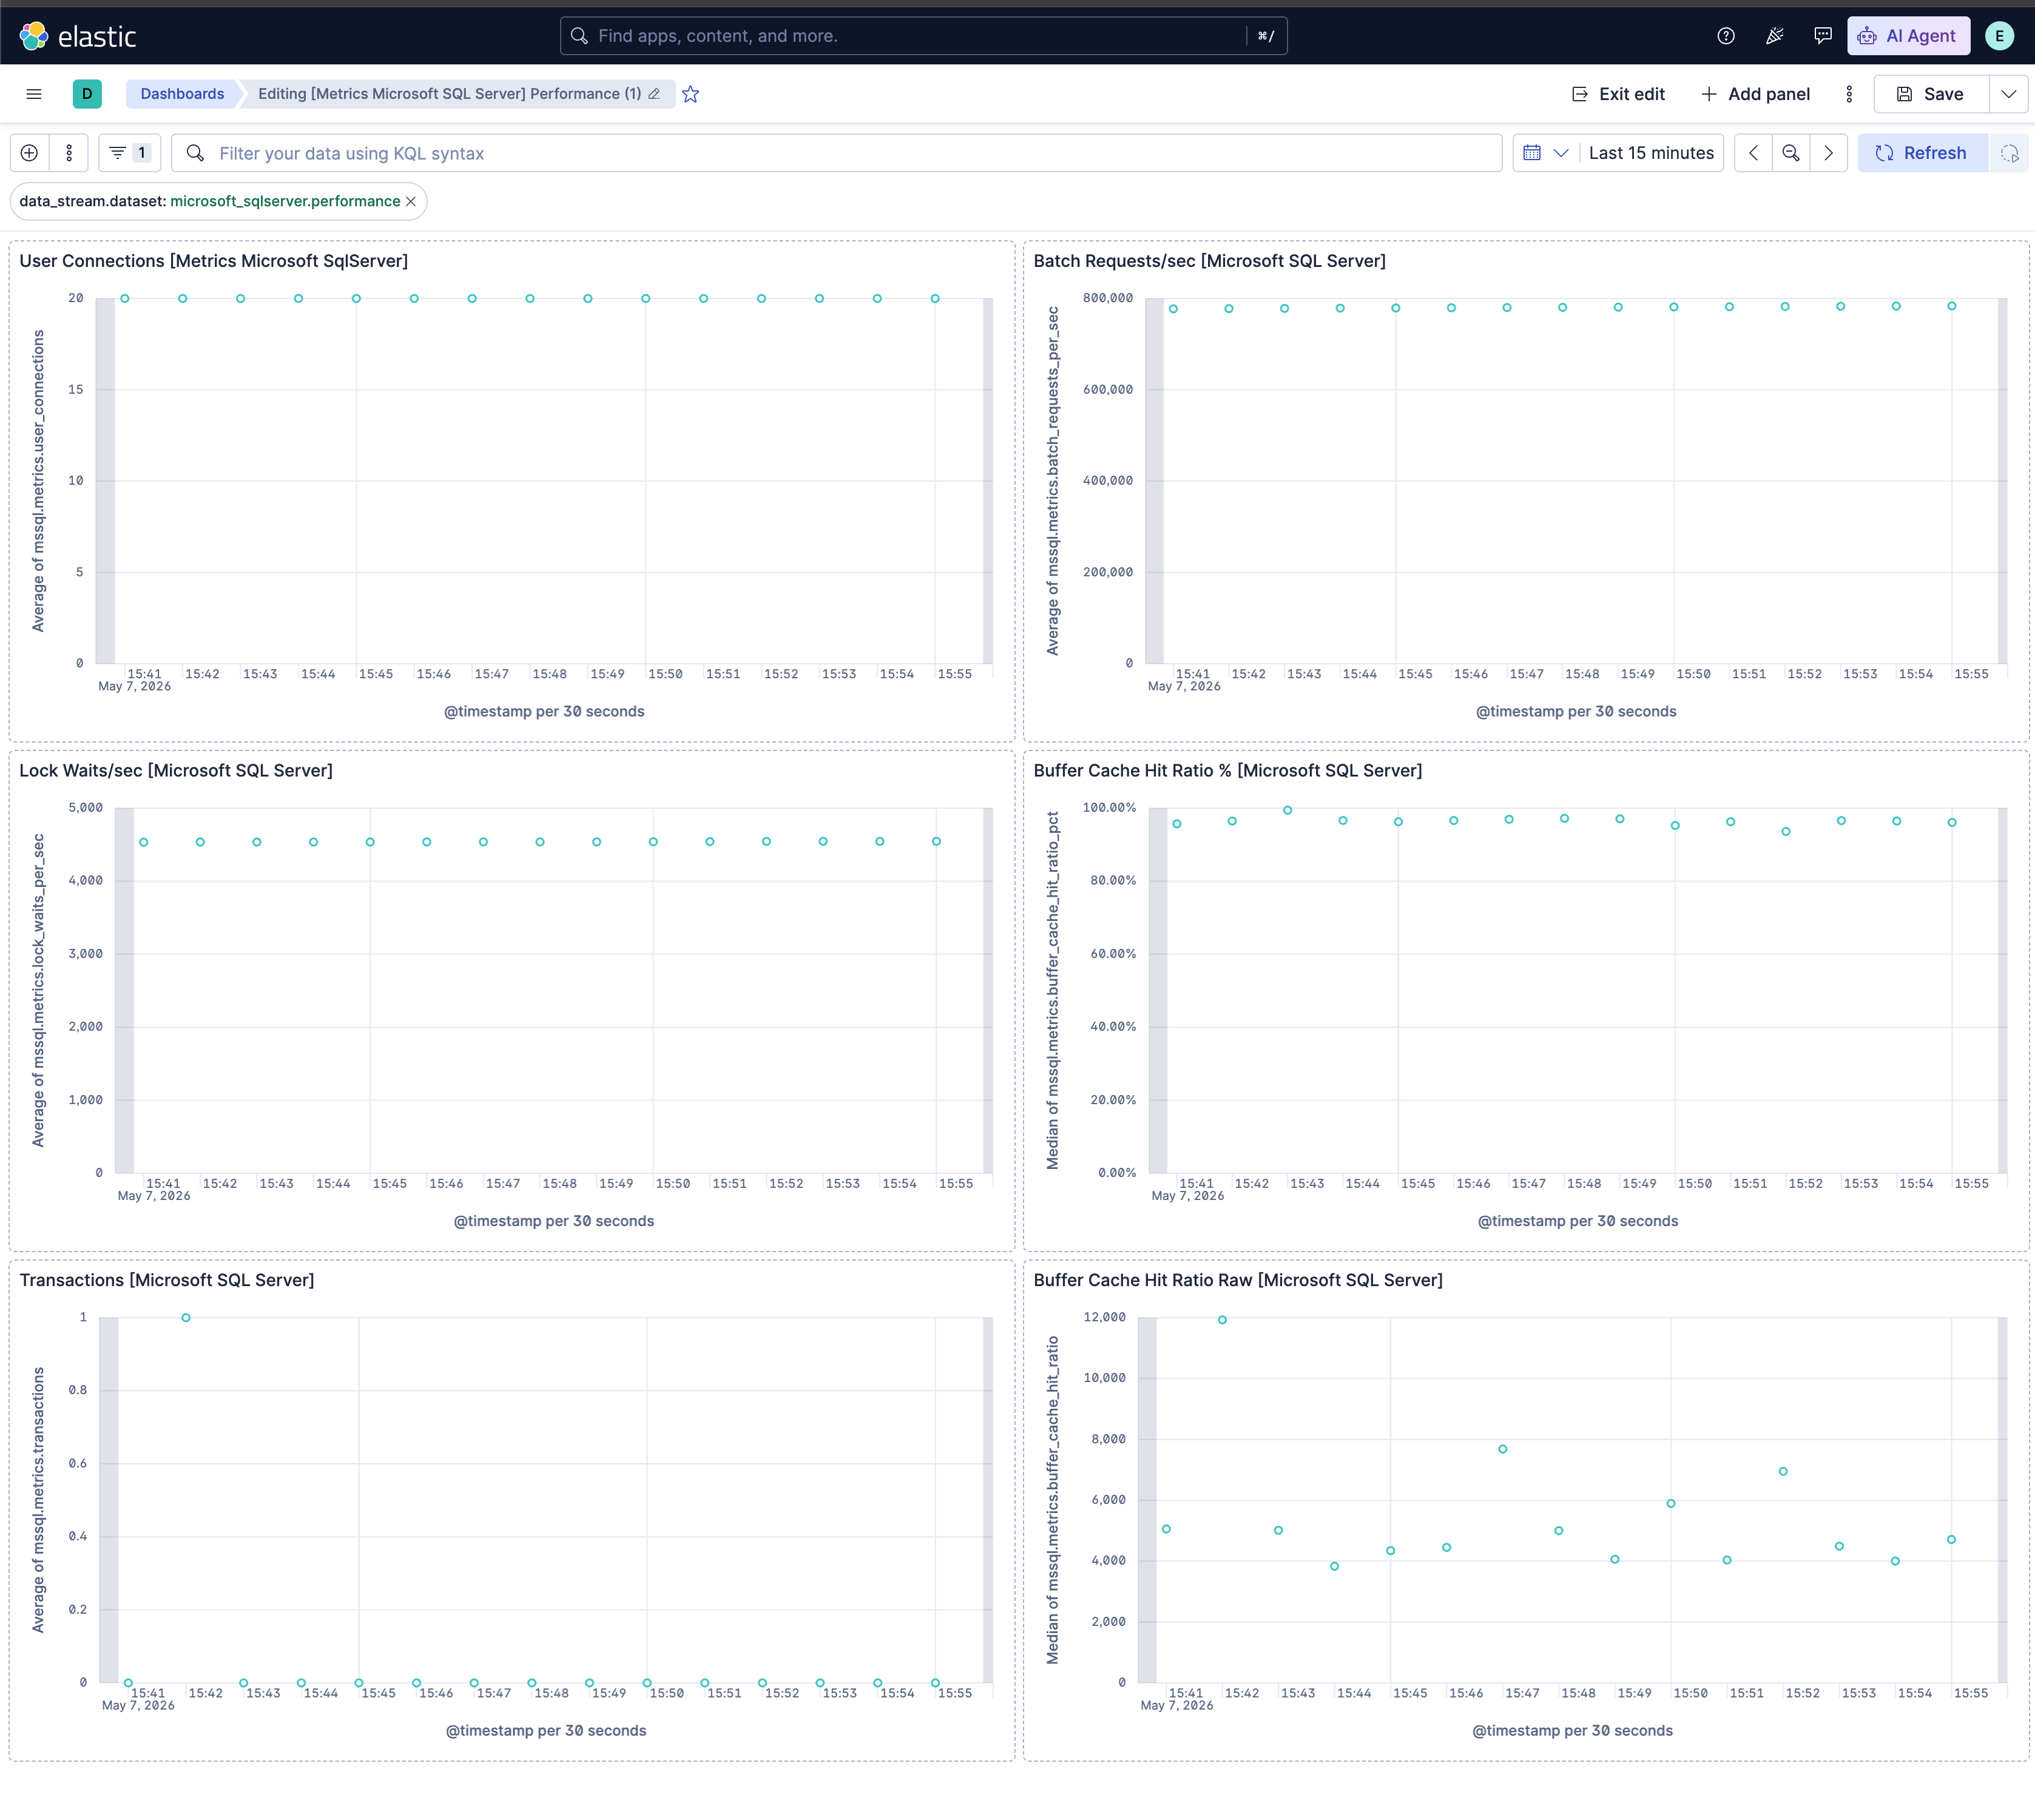
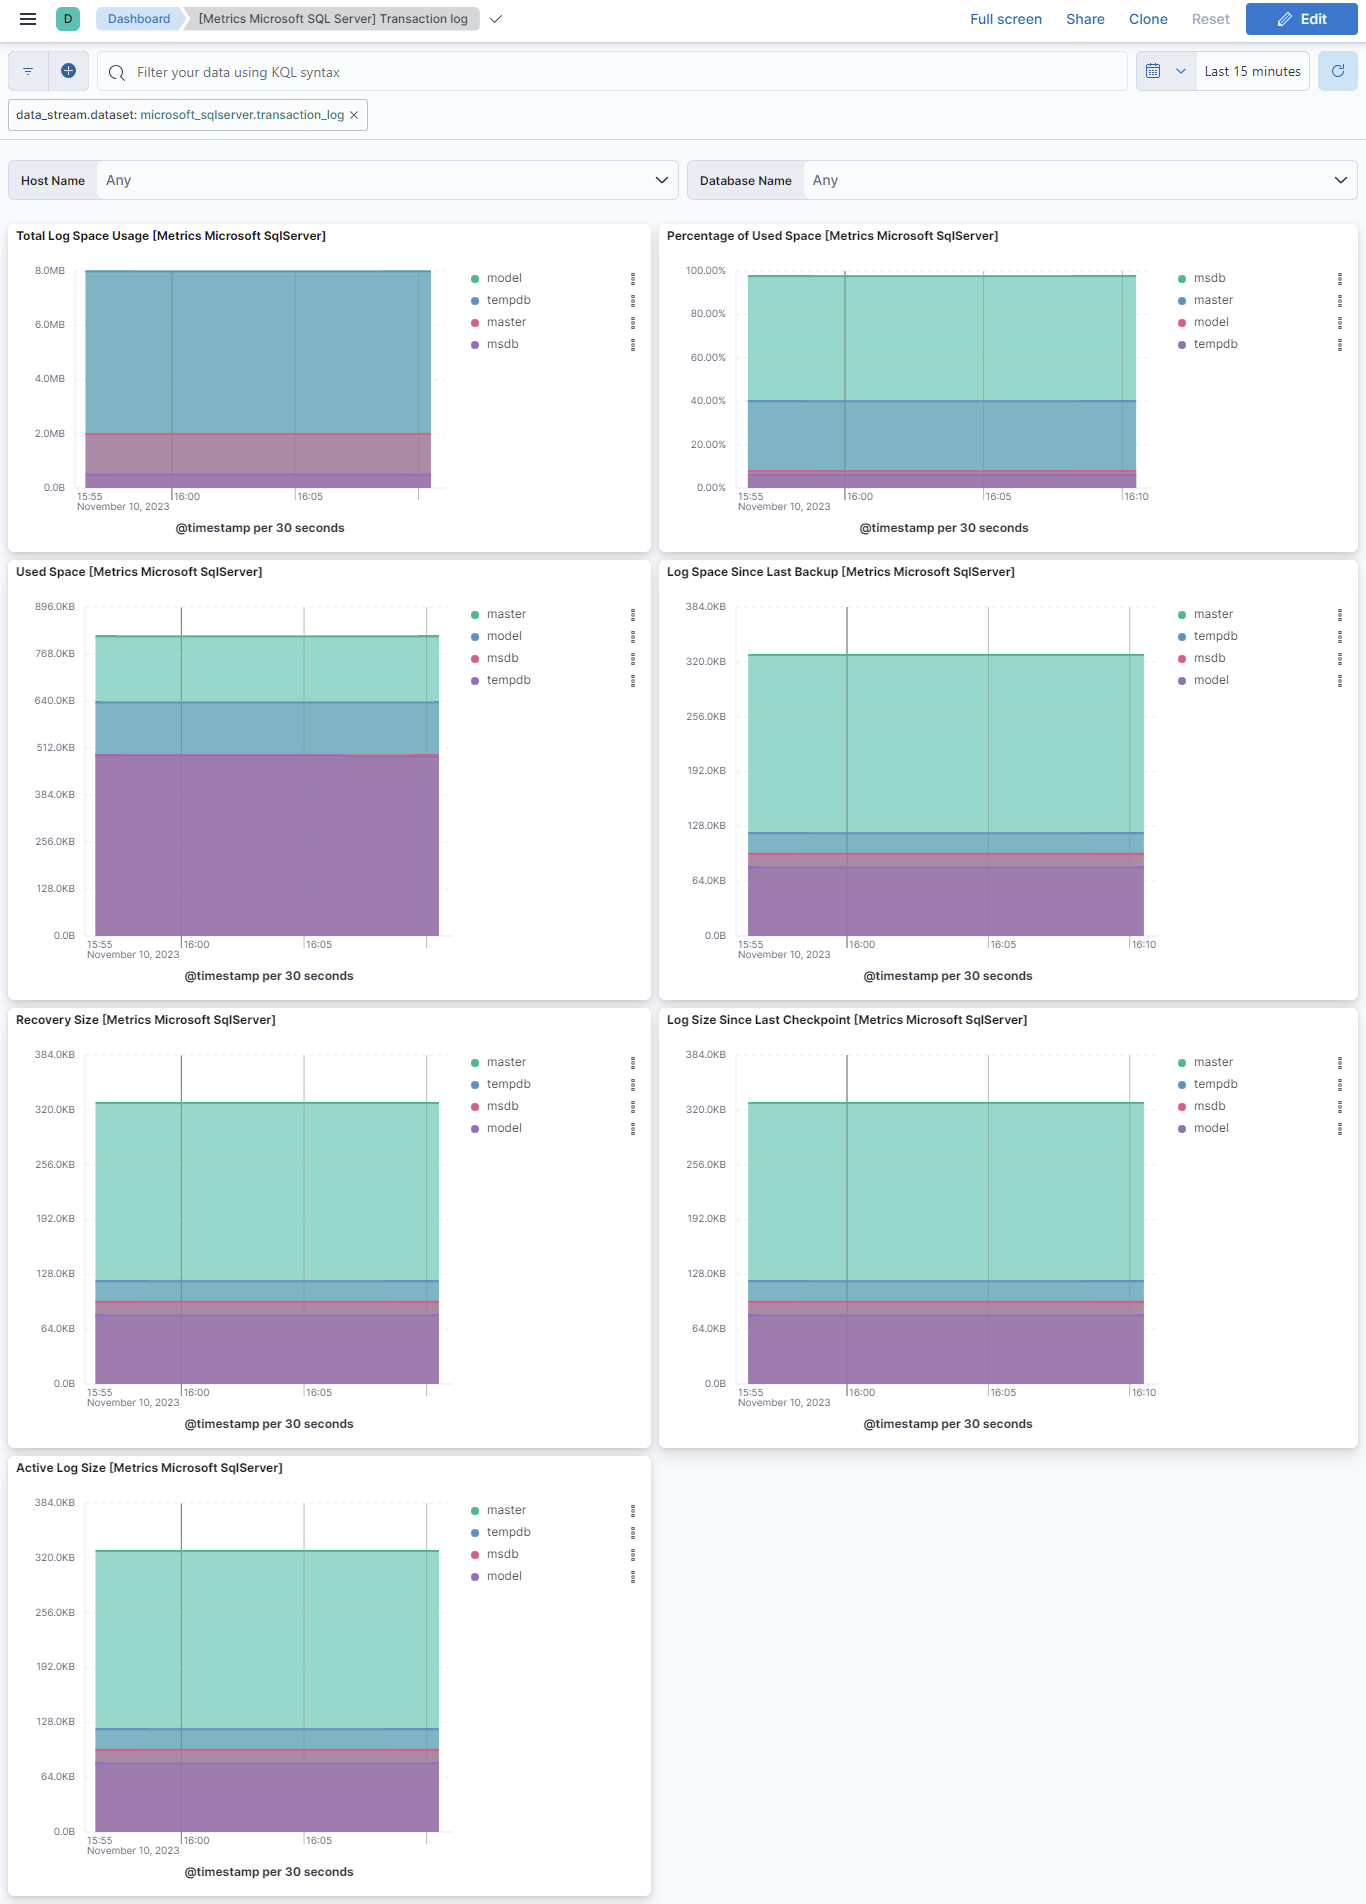
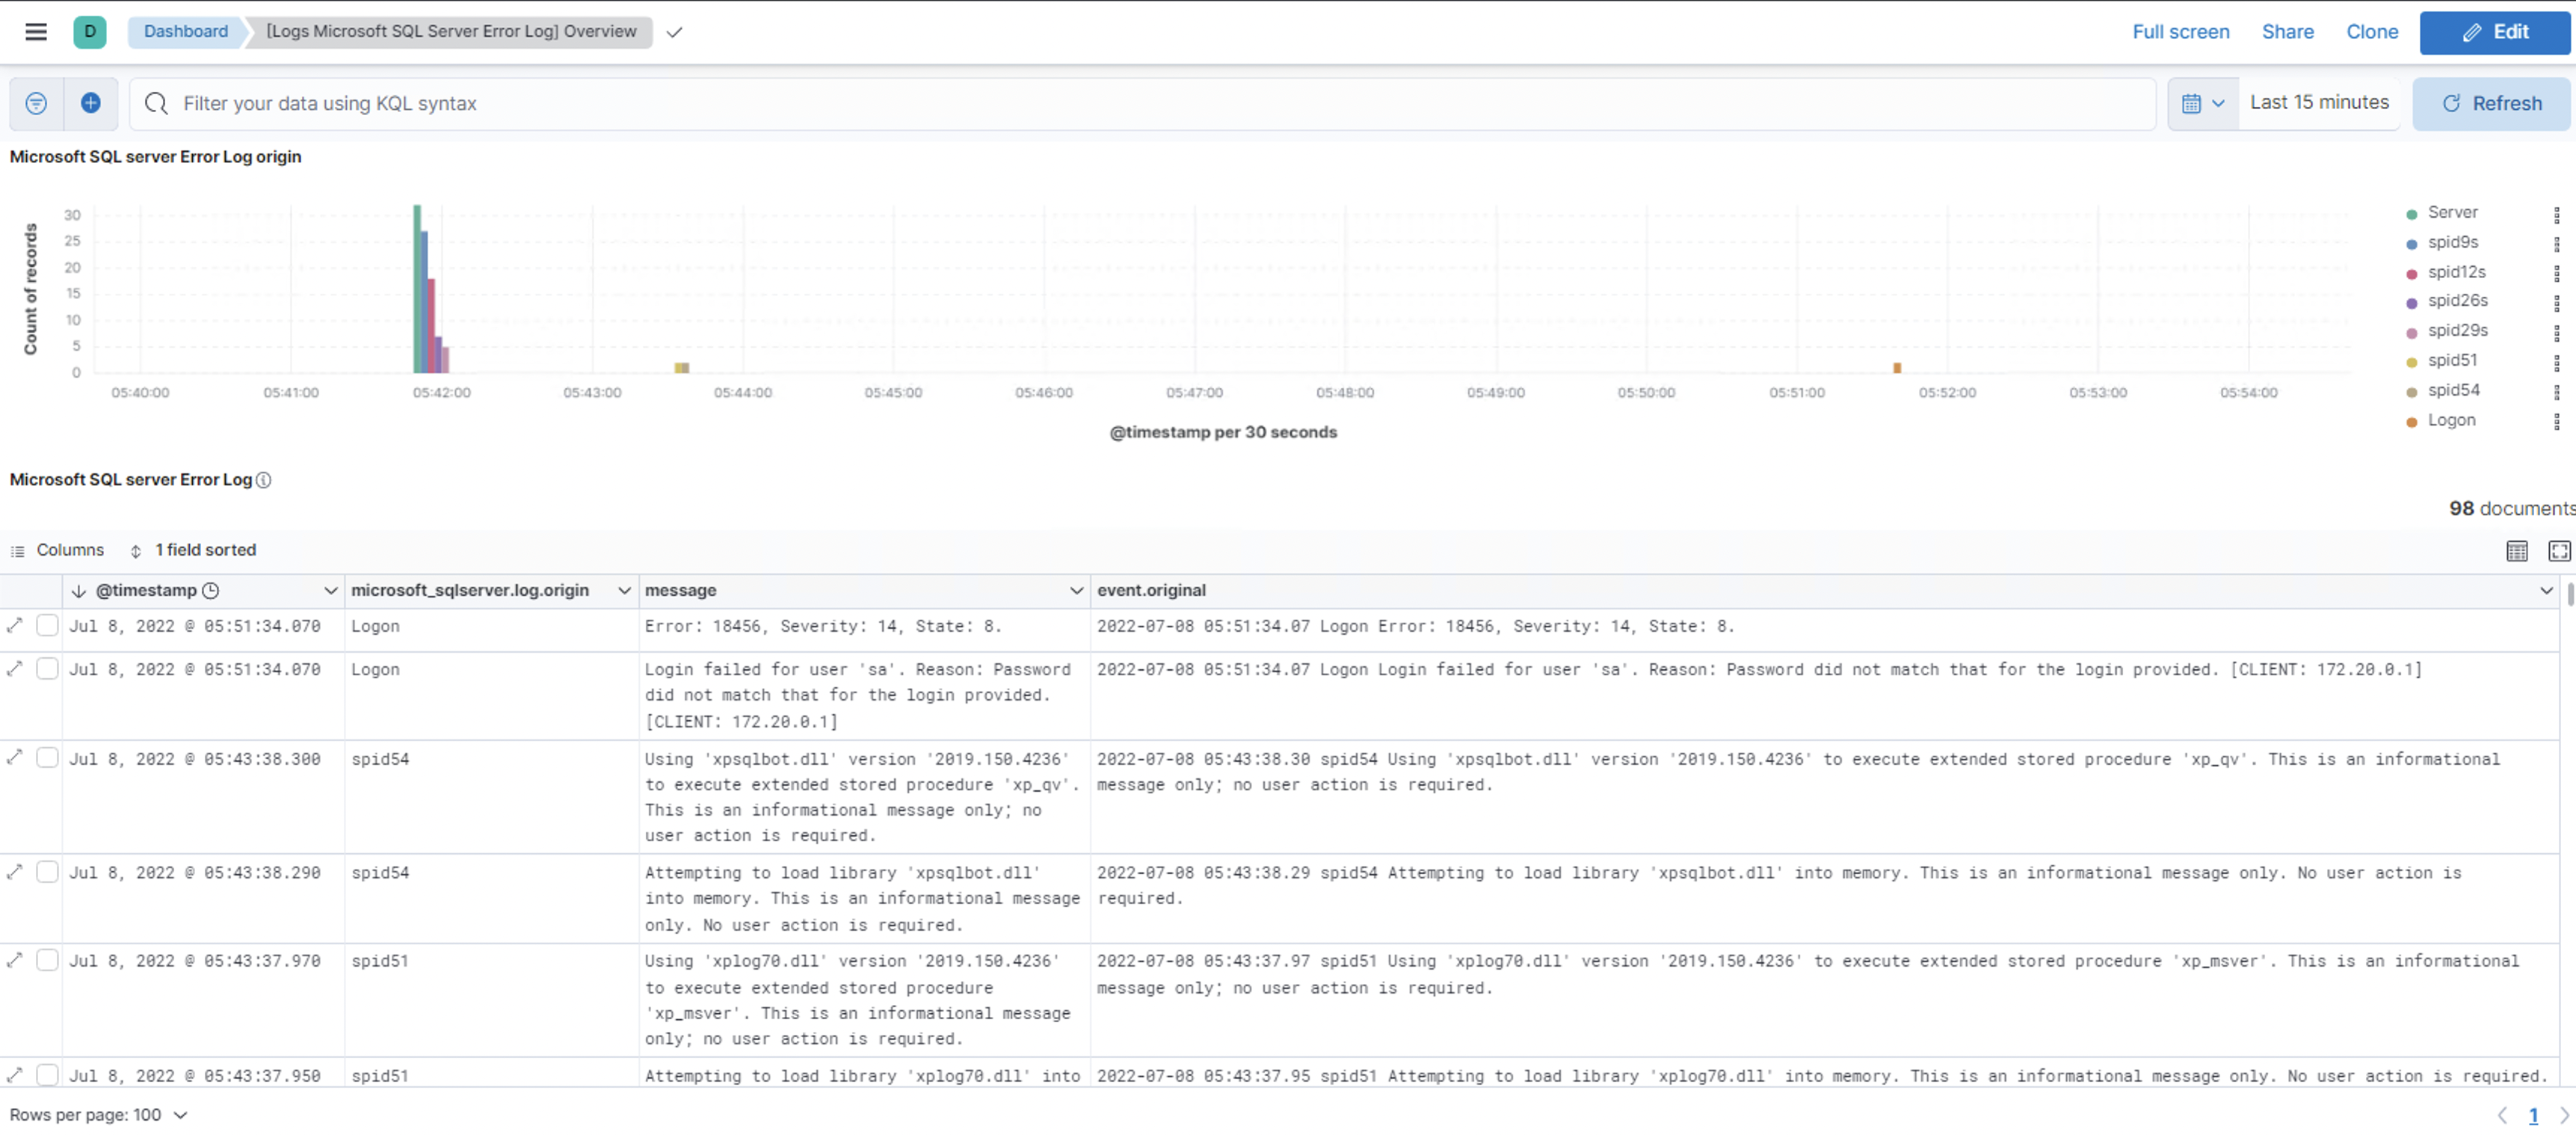
This integration includes one or more Kibana dashboards that visualizes the data collected by the integration. The screenshots below illustrate how the ingested data is displayed.
Changelog
| Version | Details | Minimum Kibana version |
|---|---|---|
| 2.18.0 | Bug fix (View pull request) Migrate the log (error logs) data stream from the deprecated logfile input to filestream. This prevents the Elastic Agent unit from degrading when an empty, utf-16le-bom encoded SQL Server error log is harvested and allows short error logs to be read. |
9.2.1 8.19.0 |
| 2.17.1 | Bug fix (View pull request) Fix availability_groups SQL query being split across multiple lines, which caused missing whitespace between keywords (e.g. FROM, JOIN) when the YAML was folded by some Elastic Agent versions. |
9.2.1 8.19.0 |
| 2.17.0 | Enhancement (View pull request) Add mssql.metrics.buffer_cache_hit_ratio_pct field to the performance data stream |
9.2.1 8.19.0 |
| 2.16.0 | Enhancement (View pull request) Add health metrics for Always On Availability Groups. |
9.2.1 8.19.0 |
| 2.15.0 | Enhancement (View pull request) Update README with Alerting Rule Template. |
9.2.1 8.19.0 |
| 2.14.1 | Enhancement (View pull request) Change the default value for the username. |
9.2.1 8.19.0 |
| 2.14.0 | Enhancement (View pull request) Add Alerting Rule Template. |
9.2.1 8.19.0 |
| 2.13.0 | Enhancement (View pull request) Add a flag fips_compatible to control whether the package is allowed in the ECH FedRAMP High environment. |
9.0.0 8.13.0 |
| 2.12.0 | Enhancement (View pull request) Add support for Kibana 9.0.0. |
9.0.0 8.13.0 |
| 2.11.0 | Enhancement (View pull request) Allow the usage of deprecated log input and support for stack 9.0 |
8.13.0 |
| 2.10.1 | Enhancement (View pull request) Add optional mssql.query field to transaction_logs data stream for debugging purposes. |
8.13.0 |
| 2.10.0 | Enhancement (View pull request) Add optional mssql.query field to performance data stream for debugging purposes. |
8.13.0 |
| 2.9.6 | Bug fix (View pull request) Update links to getting started docs |
8.13.0 |
| 2.9.5 | Enhancement (View pull request) Add observability category. |
8.13.0 |
| 2.9.4 | Bug fix (View pull request) Fix broken link for Microsoft SQL Server Integration. |
8.13.0 |
| 2.9.3 | Enhancement (View pull request) Improve documentation to add more information about required permissions. |
8.13.0 |
| 2.9.2 | Bug fix (View pull request) Fix documentation for transaction_logs on default and custom database metrics. |
8.13.0 |
| 2.9.1 | Bug fix (View pull request) Convert error.code to string |
8.13.0 |
| 2.9.0 | Enhancement (View pull request) Add missing options to winlog input |
8.13.0 |
| 2.8.0 | Enhancement (View pull request) Add processor support for performance and transaction_log data streams. |
8.13.0 |
| 2.7.0 | Enhancement (View pull request) ECS version updated to 8.11.0. Update the kibana constraint to ^8.13.0. Modified the field definitions to remove ECS fields made redundant by the ecs@mappings component template. |
8.13.0 |
| 2.6.0 | Enhancement (View pull request) Add global filter on data_stream.dataset to improve performance. |
8.12.0 |
| 2.5.1 | Enhancement (View pull request) Update documentation for transaction_logs metric collection limits. |
8.12.0 |
| 2.5.0 | Enhancement (View pull request) Enable 'secret' for the sensitive fields. |
8.12.0 |
| 2.4.1 | Enhancement (View pull request) Inline "by reference" visualizations |
8.10.2 |
| 2.4.0 | Enhancement (View pull request) Update the "Microsoft SQL Server Transaction log" dashboard. |
8.10.2 |
| 2.3.2 | Enhancement (View pull request) Update documentation |
8.10.2 |
| 2.3.1 | Enhancement (View pull request) Update README to use documentation guidelines |
8.10.2 |
| 2.3.0 | Enhancement (View pull request) Update the package format_version to 3.0.0. |
8.10.2 |
| 2.2.2 | Bug fix (View pull request) Bump minimum kibana version for fetch_from_all_databases feature |
8.10.2 |
| 2.2.1 | Bug fix (View pull request) Add null check and ignore_missing check to the rename processor |
8.8.0 |
| 2.2.0 | Enhancement (View pull request) Add support for fetch_from_all_databases for Microsoft SQL server |
8.8.0 |
| 2.1.1 | Bug fix (View pull request) Add ecs mapping for error.code to avoid type conflicts |
8.8.0 |
| 2.1.0 | Enhancement (View pull request) Enable time series data streams for the metrics datasets. This dramatically reduces storage for metrics and is expected to progressively improve query performance. For more details, see https://www.elastic.co/guide/en/elasticsearch/reference/current/tsds.html. |
8.8.0 |
| 2.0.0 | Enhancement (View pull request) Make performance, transaction_log & log datastream GA. |
8.4.0 |
| 1.23.0 | Enhancement (View pull request) Update documentation with database permissions link. |
8.4.0 |
| 1.22.0 | Enhancement (View pull request) Add missing agent and ECS fields mapping. |
8.4.0 |
| 1.21.0 | Enhancement (View pull request) Rename ownership from obs-service-integrations to obs-infraobs-integrations |
8.4.0 |
| 1.20.0 | Enhancement (View pull request) Manually encoding backslash for domain accounts |
8.4.0 |
| 1.19.1 | Bug fix (View pull request) Adding some more dimensions fields. |
8.4.0 |
| 1.19.0 | Enhancement (View pull request) Migrate Transaction log(dashboard) visualizations to lens. |
8.4.0 |
| 1.18.0 | Enhancement (View pull request) Migrate Audit Events Overview(dashboard), Error Log Overview(dashboard) and Performance(dashboard) visualizations to lens. |
8.4.0 |
| 1.17.0 | Enhancement (View pull request) Add support for user database names with special characters for transaction log metrics. |
8.3.0 |
| 1.16.0 | Enhancement (View pull request) Update dimension fields for transaction log datastream to enable TSDB. |
8.3.0 |
| 1.15.0 | Enhancement (View pull request) Update metrictype for fields of performance data stream. |
8.3.0 |
| 1.14.0 | Enhancement (View pull request) Add dimension fields for performance datastream to support TSDB enablement. |
8.3.0 |
| 1.13.1 | Enhancement (View pull request) Added categories and/or subcategories. |
8.3.0 |
| 1.13.0 | Enhancement (View pull request) Update documentation for password. |
8.3.0 |
| 1.12.0 | Enhancement (View pull request) Update package to ECS 8.6.0. |
8.3.0 |
| 1.11.1 | Bug fix (View pull request) Fixed connection resets performance query. |
8.3.0 |
| 1.11.0 | Enhancement (View pull request) Support user databases for transaction log. |
8.3.0 |
| 1.10.0 | Enhancement (View pull request) Ingest instance name and server names. |
8.3.0 |
| 1.9.0 | Enhancement (View pull request) Support list of dynamic counter name. |
8.3.0 |
| 1.8.0 | Enhancement (View pull request) Added infrastructure category. |
8.3.0 |
| 1.7.0 | Enhancement (View pull request) Merge results introduced in performance. Enhancement (View pull request) Allow text encoding configuration. |
8.3.0 |
| 1.6.0 | Enhancement (View pull request) Update package to ECS 8.5.0. |
8.3.0 |
| 1.5.0 | Enhancement (View pull request) Adding support for Named Instance connection using instance name or by port number. |
8.3.0 |
| 1.4.0 | Enhancement (View pull request) Update package to ECS 8.4.0 |
8.3.0 |
| 1.3.0 | Enhancement (View pull request) Added the log datastream. |
8.3.0 |
| 1.2.0 | Enhancement (View pull request) Update package to ECS 8.3.0. |
8.3.0 |
| 1.1.1 | Enhancement (View pull request) Added transaction log datastream |
8.3.0 |
| 1.1.0 | Enhancement (View pull request) Added performance datastream |
— |
| 1.0.0 | Enhancement (View pull request) Make GA |
8.0.0 7.16.0 |
| 0.5.0 | Enhancement (View pull request) Update to ECS 8.2 |
8.0.0 7.16.0 |
| 0.4.5 | Enhancement (View pull request) Update Readme. Added links to Microsoft documentation |
8.0.0 7.16.0 |
| 0.4.4 | Enhancement (View pull request) Add documentation for multi-fields |
8.0.0 7.16.0 |
| 0.4.3 | Bug fix (View pull request) Fix field conflict for winlog.record_id |
— |
| 0.4.2 | Bug fix (View pull request) Fix mapper_parsing_exception when parsing sqlserver.audit.event_time. |
8.0.0 7.16.0 |
| 0.4.1 | Bug fix (View pull request) Change owner to SEI |
8.0.0 7.16.0 |
| 0.4.0 | Enhancement (View pull request) Update to ECS 8.0 |
— |
| 0.3.0 | Enhancement (View pull request) Expose winlog input ignore_older option. Bug fix (View pull request) Fix preserve original event option Enhancement (View pull request) Make order of options consistent with other winlog based integrations. |
— |
| 0.2.0 | Enhancement (View pull request) Expose winlog input language option. |
8.0.0 7.16.0 |
| 0.1.0 | Enhancement (View pull request) Initial draft of the package |
— |