Ceph Integration
Elastic Cloud Serverless projects are autoscaled environments, fully managed by Elastic and available on Elastic Cloud. Availability This functionality is generally available and ready for production usage. Elastic Cloud Serverless projects are autoscaled environments, fully managed by Elastic and available on Elastic Cloud. Availability This functionality is generally available and ready for production usage. The Elastic Stack includes Elastic's core products such as Elasticsearch, Kibana, Logstash, and Beats. Availability This functionality is generally available and ready for production usage. Unless stated otherwise on the page, this functionality is available when your Elastic Stack is deployed on Elastic Cloud Hosted, Elastic Cloud Enterprise, Elastic Cloud on Kubernetes, and self-managed environments. This documentation corresponds to the latest patch available for each minor version. If you're not using the latest patch, check the release notes for changes.
Serverless Observability
Generally available
Serverless Security
Generally available
Stack
9.0+
Generally available since 9.0
| Version | 1.9.0 (View all) |
| Subscription level What's this? |
Basic |
| Developed by What's this? |
Elastic |
| Ingestion method(s) | API |
| Minimum Kibana version(s) | 9.0.0 8.13.0 |
Ceph is a framework for distributed storage clusters. The frontend client framework is based on RADOS (Reliable Autonomic Distributed Object Store). Clients can directly access Ceph storage clusters with librados, but also can use RADOSGW (object storage), RBD (block storage), and CephFS (file storage). The backend server framework consists of several daemons that manage nodes, and backend object stores to store user's actual data.
Use the Ceph integration to:
- Collect metrics related to the cluster disk, cluster health, cluster status, Object Storage Daemons (OSD) performance, Object Storage Daemons (OSD) pool stats, Object Storage Daemons (OSD) tree and pool disk.
- Create visualizations to monitor, measure and analyze the usage trend and key data, and derive business insights.
- Create alerts to reduce the MTTD and also the MTTR by referencing relevant logs when troubleshooting an issue.
The Ceph integration collects metrics data.
Metrics give you insight into the statistics of the Ceph. The Metric data streams collected by the Ceph integration are cluster_disk, cluster_health, cluster_status, osd_performance, osd_pool_stats, osd_tree and pool_disk, so that the user can monitor and troubleshoot the performance of the Ceph instance.
Data streams:
cluster_disk: Collects information related to overall storage of the cluster.cluster_health: Collects information related to health of the cluster.cluster_status: Collects information related to status of the cluster.osd_performance: Collects information related to Object Storage Daemons (OSD) performance.osd_pool_stats: Collects information related to client I/O rates.osd_tree: Collects information related to structure of the Object Storage Daemons (OSD) tree.pool_disk: Collects information related to memory of each pool.
Note:
- Users can monitor and see the metrics inside the ingested documents for Ceph in the
logs-*index pattern fromDiscover.
This integration has been tested against Ceph 15.2.17 (Octopus) and 14.2.22 (Nautilus).
In order to find out the Ceph version of your instance, see following approaches:
On the Ceph Dashboard, in the top right corner of the screen, go to
Help>About. You can see the version of Ceph.Please run the following command from Ceph instance:
ceph version
- The
ceph-rest-apitool has been deprecated and dropped from Ceph versionMimiconwards. Please refer here: https://docs.ceph.com/en/latest/releases/luminous/#id32
You need Elasticsearch for storing and searching your data and Kibana for visualizing and managing it. You can use our hosted Elasticsearch Service on Elastic Cloud, which is recommended or self-manage the Elastic Stack on your own hardware.
To ingest data from the Ceph, you must have:
- Enable RESTful module. Refer: https://docs.ceph.com/en/octopus/mgr/restful/#restful-module
- Create API keys to allow users to perform API key authentication. To create API User and API Secret Key, please refer https://docs.ceph.com/en/octopus/mgr/restful/#creating-an-api-user
For step-by-step instructions on how to set up an integration, see the Getting started guide.
You need the following information from your Ceph instance to configure this integration in Elastic:
Host Configuration Format: http[s]://<ceph-mgr>:<port>
Example Host Configuration: https://127.0.0.1:8003
To list all of your API keys, please run the following command from Ceph instance:
ceph restful list-keys
The ceph restful list-keys command will output in JSON:
{
      "api": "52dffd92-a103-4a10-bfce-5b60f48f764e"
}
In the above JSON, please consider api as API User and value of 52dffd92-a103-4a10-bfce-5b60f48f764e as API Secret Key while configuring an integration.
After the integration is successfully configured, clicking on the Assets tab of the Ceph Integration should display a list of available dashboards. Click on the dashboard available for your configured data stream. It should be populated with the required data.
- If
host.ipappears conflicted under thelogs-*data view, this issue can be resolved by reindexing theCluster Disk,Cluster health,Cluster Status,OSD Performance,OSD Pool Stats,OSD TreeandPool Diskdata streams.
This is the cluster_disk data stream. This data stream collects metrics related to the total storage, available storage and used storage of cluster disk.
Example
{
    "@timestamp": "2023-01-16T14:19:00.980Z",
    "agent": {
        "ephemeral_id": "52dd7029-5dcd-4371-bc36-cfc30e808264",
        "id": "fa18bd63-06b2-4f0e-b03b-9c891269c756",
        "name": "docker-fleet-agent",
        "type": "filebeat",
        "version": "8.5.1"
    },
    "ceph": {
        "cluster_disk": {
            "available": {
                "bytes": 81199562752
            },
            "total": {
                "bytes": 85882568704
            },
            "used": {
                "bytes": 388038656,
                "raw": {
                    "bytes": 4683005952
                }
            }
        }
    },
    "data_stream": {
        "dataset": "ceph.cluster_disk",
        "namespace": "ep",
        "type": "logs"
    },
    "ecs": {
        "version": "8.11.0"
    },
    "elastic_agent": {
        "id": "fa18bd63-06b2-4f0e-b03b-9c891269c756",
        "snapshot": false,
        "version": "8.5.1"
    },
    "event": {
        "agent_id_status": "verified",
        "created": "2023-01-16T14:19:00.980Z",
        "dataset": "ceph.cluster_disk",
        "ingested": "2023-01-16T14:19:01Z",
        "kind": "metric",
        "module": "ceph",
        "original": "{\"command\":\"df format=json\",\"outb\":{\"pools\":[{\"id\":1,\"name\":\"device_health_metrics\",\"stats\":{\"bytes_used\":6488064,\"kb_used\":6336,\"max_avail\":25633505280,\"objects\":4,\"percent_used\":0.0000843624584376812,\"stored\":2142673}},{\"id\":4,\"name\":\"elk\",\"stats\":{\"bytes_used\":3735552,\"kb_used\":3648,\"max_avail\":25633505280,\"objects\":3,\"percent_used\":0.000048574063839623705,\"stored\":1176572}},{\"id\":9,\"name\":\"elastic\",\"stats\":{\"bytes_used\":4325376,\"kb_used\":4224,\"max_avail\":25633505280,\"objects\":5,\"percent_used\":0.00005624322147923522,\"stored\":1349210}}],\"stats\":{\"num_osds\":4,\"num_per_pool_omap_osds\":4,\"num_per_pool_osds\":4,\"total_avail_bytes\":81199562752,\"total_bytes\":85882568704,\"total_used_bytes\":388038656,\"total_used_raw_bytes\":4683005952,\"total_used_raw_ratio\":0.05452801287174225},\"stats_by_class\":{\"hdd\":{\"total_avail_bytes\":81199562752,\"total_bytes\":85882568704,\"total_used_bytes\":388038656,\"total_used_raw_bytes\":4683005952,\"total_used_raw_ratio\":0.05452801287174225}}},\"outs\":\"\"}",
        "type": [
            "info"
        ]
    },
    "input": {
        "type": "httpjson"
    },
    "service": {
        "address": "http://elastic-package-service_ceph_1:8080"
    },
    "tags": [
        "preserve_original_event",
        "ceph-cluster_disk",
        "forwarded"
    ]
}
ECS Field Reference
Please refer to the following document for detailed information on ECS fields.
Exported fields
| Field | Description | Type | Unit | Metric Type |
|---|---|---|---|---|
| @timestamp | Event timestamp. | date | ||
| ceph.cluster_disk.available.bytes | Available bytes of the cluster disk. | long | byte | gauge |
| ceph.cluster_disk.total.bytes | Total bytes of the cluster disk. | long | byte | gauge |
| ceph.cluster_disk.used.bytes | Used bytes of the cluster disk. | long | byte | gauge |
| ceph.cluster_disk.used.raw.bytes | Used raw bytes of the cluster disk. | long | byte | gauge |
| data_stream.dataset | Data stream dataset. | constant_keyword | ||
| data_stream.namespace | Data stream namespace. | constant_keyword | ||
| data_stream.type | Data stream type. | constant_keyword | ||
| input.type | Type of Filebeat input. | keyword |
This is the cluster_health data stream. This data stream collects metrics related to the cluster health.
Example
{
    "@timestamp": "2023-01-10T06:47:15.877Z",
    "agent": {
        "ephemeral_id": "52b8b8e6-e3de-46a1-b5df-e11e207c1dc0",
        "id": "7d789115-66d9-472a-89d4-c748c2551a51",
        "name": "docker-fleet-agent",
        "type": "filebeat",
        "version": "8.5.1"
    },
    "ceph": {
        "cluster_health": {
            "epoch": 7,
            "round": {
                "count": 0,
                "status": "finished"
            }
        }
    },
    "data_stream": {
        "dataset": "ceph.cluster_health",
        "namespace": "ep",
        "type": "logs"
    },
    "ecs": {
        "version": "8.11.0"
    },
    "elastic_agent": {
        "id": "7d789115-66d9-472a-89d4-c748c2551a51",
        "snapshot": false,
        "version": "8.5.1"
    },
    "event": {
        "agent_id_status": "verified",
        "created": "2023-01-10T06:47:15.877Z",
        "dataset": "ceph.cluster_health",
        "ingested": "2023-01-10T06:47:16Z",
        "kind": "metric",
        "module": "ceph",
        "original": "{\"command\":\"time-sync-status format=json\",\"outb\":{\"timechecks\":{\"epoch\":7,\"round\":0,\"round_status\":\"finished\"}},\"outs\":\"\"}",
        "type": [
            "info"
        ]
    },
    "input": {
        "type": "httpjson"
    },
    "service": {
        "address": "http://elastic-package-service_ceph_1:8080"
    },
    "tags": [
        "preserve_original_event",
        "ceph-cluster_health",
        "forwarded"
    ]
}
ECS Field Reference
Please refer to the following document for detailed information on ECS fields.
Exported fields
| Field | Description | Type | Metric Type |
|---|---|---|---|
| @timestamp | Event timestamp. | date | |
| ceph.cluster_health.epoch | Map version. | long | |
| ceph.cluster_health.round.count | Timecheck round. | long | gauge |
| ceph.cluster_health.round.status | Status of the round. | keyword | |
| data_stream.dataset | Data stream dataset. | constant_keyword | |
| data_stream.namespace | Data stream namespace. | constant_keyword | |
| data_stream.type | Data stream type. | constant_keyword | |
| input.type | Type of Filebeat input. | keyword |
This is the cluster_status data stream. This data stream collects metrics related to cluster health status, number of monitors in the cluster, cluster version, cluster placement group (pg) count, cluster osd states and cluster storage.
Example
{
    "@timestamp": "2023-02-08T15:11:32.486Z",
    "agent": {
        "ephemeral_id": "255caad4-76f8-4423-bc37-5833c0067375",
        "id": "686da057-e16f-4744-acb7-421b88c9b3ca",
        "name": "docker-fleet-agent",
        "type": "filebeat",
        "version": "8.5.1"
    },
    "ceph": {
        "cluster_status": {
            "cluster_version": "octopus",
            "health": "HEALTH_WARN",
            "monitor": {
                "count": 1
            },
            "object": {
                "count": 12
            },
            "osd": {
                "count": 6,
                "epoch": 958,
                "in": {
                    "count": 4
                },
                "up": {
                    "count": 3
                }
            },
            "pg": {
                "available": {
                    "bytes": 60636725248
                },
                "count": 96,
                "data": {
                    "bytes": 134217728
                },
                "degraded": {
                    "object": {
                        "count": 9
                    },
                    "ratio": 0.25,
                    "total": {
                        "count": 36
                    }
                },
                "remapped": {
                    "count": 0
                },
                "state": [
                    {
                        "count": 56,
                        "state_name": "active+undersized"
                    },
                    {
                        "count": 31,
                        "state_name": "active+clean"
                    },
                    {
                        "count": 9,
                        "state_name": "active+undersized+degraded"
                    }
                ],
                "total": {
                    "bytes": 64411926528
                },
                "used": {
                    "bytes": 3775201280
                }
            },
            "pool": {
                "count": 3
            },
            "traffic": {
                "read": {
                    "bytes": 0,
                    "operation": {
                        "count": 50
                    }
                },
                "write": {
                    "bytes": 0,
                    "operation": {
                        "count": 55
                    }
                }
            }
        }
    },
    "data_stream": {
        "dataset": "ceph.cluster_status",
        "namespace": "ep",
        "type": "logs"
    },
    "ecs": {
        "version": "8.11.0"
    },
    "elastic_agent": {
        "id": "686da057-e16f-4744-acb7-421b88c9b3ca",
        "snapshot": false,
        "version": "8.5.1"
    },
    "event": {
        "agent_id_status": "verified",
        "created": "2023-02-08T15:11:32.486Z",
        "dataset": "ceph.cluster_status",
        "ingested": "2023-02-08T15:11:33Z",
        "kind": "metric",
        "module": "ceph",
        "original": "{\"command\":\"status format=json\",\"outb\":{\"election_epoch\":9,\"fsid\":\"72840c24-3a82-4e28-be87-cf9f905918fb\",\"fsmap\":{\"by_rank\":[],\"epoch\":1,\"up:standby\":0},\"health\":{\"checks\":{\"OSD_DOWN\":{\"muted\":false,\"severity\":\"HEALTH_WARN\",\"summary\":{\"count\":1,\"message\":\"1 osds down\"}},\"OSD_HOST_DOWN\":{\"muted\":false,\"severity\":\"HEALTH_WARN\",\"summary\":{\"count\":1,\"message\":\"1 host (1 osds) down\"}},\"PG_DEGRADED\":{\"muted\":false,\"severity\":\"HEALTH_WARN\",\"summary\":{\"count\":74,\"message\":\"Degraded data redundancy: 9/36 objects degraded (25.000%), 9 pgs degraded, 65 pgs undersized\"}}},\"mutes\":[],\"status\":\"HEALTH_WARN\"},\"monmap\":{\"epoch\":2,\"min_mon_release_name\":\"octopus\",\"num_mons\":1},\"osdmap\":{\"epoch\":958,\"num_in_osds\":4,\"num_osds\":6,\"num_remapped_pgs\":0,\"num_up_osds\":3,\"osd_in_since\":1672393287,\"osd_up_since\":1674808261},\"pgmap\":{\"bytes_avail\":60636725248,\"bytes_total\":64411926528,\"bytes_used\":3775201280,\"data_bytes\":134217728,\"degraded_objects\":9,\"degraded_ratio\":0.25,\"degraded_total\":36,\"num_objects\":12,\"num_pgs\":96,\"num_pools\":3,\"pgs_by_state\":[{\"count\":56,\"state_name\":\"active+undersized\"},{\"count\":31,\"state_name\":\"active+clean\"},{\"count\":9,\"state_name\":\"active+undersized+degraded\"}],\"read_bytes_sec\":0,\"read_op_per_sec\":50,\"write_bytes_sec\":0,\"write_op_per_sec\":55},\"progress_events\":{},\"quorum\":[0],\"quorum_age\":2395803,\"quorum_names\":[\"node01\"],\"servicemap\":{\"epoch\":9675,\"modified\":\"2023-02-06T06:30:50.727008+0000\",\"services\":{}}},\"outs\":\"\"}",
        "type": [
            "info"
        ]
    },
    "input": {
        "type": "httpjson"
    },
    "service": {
        "address": "http://elastic-package-service_ceph_1:8080"
    },
    "tags": [
        "preserve_original_event",
        "ceph-cluster_status",
        "forwarded"
    ]
}
ECS Field Reference
Please refer to the following document for detailed information on ECS fields.
Exported fields
| Field | Description | Type | Unit | Metric Type |
|---|---|---|---|---|
| @timestamp | Event timestamp. | date | ||
| ceph.cluster_status.cluster_version | Version of the cluster. | keyword | ||
| ceph.cluster_status.health | Health status of the cluster. | keyword | ||
| ceph.cluster_status.monitor.count | Total number of monitors in the cluster. | long | gauge | |
| ceph.cluster_status.object.count | Number of objects in the cluster. | long | gauge | |
| ceph.cluster_status.osd.count | Shows how many osds are in the cluster. | long | gauge | |
| ceph.cluster_status.osd.epoch | Epoch number. | long | ||
| ceph.cluster_status.osd.in.count | Shows how many osds are in the IN state. | long | gauge | |
| ceph.cluster_status.osd.up.count | Shows how many osds are in the UP state. | long | gauge | |
| ceph.cluster_status.pg.available.bytes | Available bytes of the cluster. | long | byte | gauge |
| ceph.cluster_status.pg.count | Total Placement Groups (pgs) in the cluster. | long | counter | |
| ceph.cluster_status.pg.data.bytes | Placement groups (pgs) data bytes in the cluster. | long | byte | gauge |
| ceph.cluster_status.pg.degraded.object.count | Total degraded Placement Groups (pgs) objects. | long | counter | |
| ceph.cluster_status.pg.degraded.ratio | Degraded objects ratio in Placement Groups (pgs). | double | gauge | |
| ceph.cluster_status.pg.degraded.total.count | Total degraded Placement Groups (pgs). | long | counter | |
| ceph.cluster_status.pg.remapped.count | Number of Placement Groups (pgs) in cluster. | long | gauge | |
| ceph.cluster_status.pg.state.count | Total number of Placement Groups (pgs) in cluster. | long | ||
| ceph.cluster_status.pg.state.state_name | Represents the current status of individual Placement Groups (pgs). | keyword | ||
| ceph.cluster_status.pg.total.bytes | Total bytes of the cluster. | long | byte | gauge |
| ceph.cluster_status.pg.used.bytes | Used bytes of the cluster. | long | byte | gauge |
| ceph.cluster_status.pool.count | Number of pools in the cluster. | long | gauge | |
| ceph.cluster_status.traffic.read.bytes | Number of client I/O read rates in bytes per second. | long | byte | gauge |
| ceph.cluster_status.traffic.read.operation.count | Number of client I/O rates read operations per second. | long | gauge | |
| ceph.cluster_status.traffic.write.bytes | Number of client I/O write rates in bytes per second. | long | byte | gauge |
| ceph.cluster_status.traffic.write.operation.count | Number of client I/O rates write operations per second. | long | gauge | |
| data_stream.dataset | Data stream dataset. | constant_keyword | ||
| data_stream.namespace | Data stream namespace. | constant_keyword | ||
| data_stream.type | Data stream type. | constant_keyword | ||
| input.type | Type of Filebeat input. | keyword |
This is the osd_performance data stream. This data stream collects metrics related to Object Storage Daemon (OSD) id, commit latency and apply latency.
Example
{
    "@timestamp": "2023-02-02T09:28:01.254Z",
    "agent": {
        "ephemeral_id": "04b608b3-b57b-4629-b657-93ad26aaa4fa",
        "id": "b4585197-fa24-4fd1-be65-c31972000431",
        "name": "docker-fleet-agent",
        "type": "filebeat",
        "version": "8.5.1"
    },
    "ceph": {
        "osd_performance": {
            "latency": {
                "apply": {
                    "ms": 3.495
                },
                "commit": {
                    "ms": 5.621
                }
            },
            "osd_id": 1
        }
    },
    "data_stream": {
        "dataset": "ceph.osd_performance",
        "namespace": "ep",
        "type": "logs"
    },
    "ecs": {
        "version": "8.11.0"
    },
    "elastic_agent": {
        "id": "b4585197-fa24-4fd1-be65-c31972000431",
        "snapshot": false,
        "version": "8.5.1"
    },
    "event": {
        "agent_id_status": "verified",
        "created": "2023-02-02T09:28:01.254Z",
        "dataset": "ceph.osd_performance",
        "ingested": "2023-02-02T09:28:02Z",
        "kind": "metric",
        "module": "ceph",
        "original": "{\"id\":1,\"perf_stats\":{\"apply_latency_ms\":3.495,\"apply_latency_ns\":3495000,\"commit_latency_ms\":5.621,\"commit_latency_ns\":5621000}}",
        "type": [
            "info"
        ]
    },
    "input": {
        "type": "httpjson"
    },
    "service": {
        "address": "http://elastic-package-service_ceph_1:8080"
    },
    "tags": [
        "preserve_original_event",
        "ceph-osd_performance",
        "forwarded"
    ]
}
ECS Field Reference
Please refer to the following document for detailed information on ECS fields.
Exported fields
| Field | Description | Type | Unit | Metric Type |
|---|---|---|---|---|
| @timestamp | Event timestamp. | date | ||
| ceph.osd_performance.latency.apply.ms | Time taken to flush an update to disks. Collects in milliseconds. | float | ms | gauge |
| ceph.osd_performance.latency.commit.ms | Time taken to commit an operation to the journal. Collects in milliseconds. | float | ms | gauge |
| ceph.osd_performance.osd_id | Id of the Object Storage Daemon (OSD). | long | ||
| data_stream.dataset | Data stream dataset. | constant_keyword | ||
| data_stream.namespace | Data stream namespace. | constant_keyword | ||
| data_stream.type | Data stream type. | constant_keyword | ||
| input.type | Type of Filebeat input. | keyword |
This is the osd_pool_stats data stream. This data stream collects metrics related to Object Storage Daemon (OSD) client I/O rates.
Example
{
    "@timestamp": "2023-01-31T06:11:06.132Z",
    "agent": {
        "ephemeral_id": "bce6666c-db6c-4e84-8fc3-8f52f9f507a8",
        "id": "7365f693-ae62-4cba-9383-2a2b681c625b",
        "name": "docker-fleet-agent",
        "type": "filebeat",
        "version": "8.5.1"
    },
    "ceph": {
        "osd_pool_stats": {
            "client_io_rate": {
                "count": 22,
                "read": {
                    "bytes": 6622518,
                    "count": 11
                },
                "write": {
                    "bytes": 6622518,
                    "count": 11
                }
            },
            "pool_id": 1,
            "pool_name": "device_health_metrics"
        }
    },
    "data_stream": {
        "dataset": "ceph.osd_pool_stats",
        "namespace": "ep",
        "type": "logs"
    },
    "ecs": {
        "version": "8.11.0"
    },
    "elastic_agent": {
        "id": "7365f693-ae62-4cba-9383-2a2b681c625b",
        "snapshot": false,
        "version": "8.5.1"
    },
    "event": {
        "agent_id_status": "verified",
        "created": "2023-01-31T06:11:06.132Z",
        "dataset": "ceph.osd_pool_stats",
        "ingested": "2023-01-31T06:11:07Z",
        "kind": "metric",
        "module": "ceph",
        "original": "{\"client_io_rate\":{\"read_bytes_sec\":6622518,\"read_op_per_sec\":11,\"write_bytes_sec\":6622518,\"write_op_per_sec\":11},\"pool_id\":1,\"pool_name\":\"device_health_metrics\",\"recovery\":{},\"recovery_rate\":{}}",
        "type": [
            "info"
        ]
    },
    "input": {
        "type": "httpjson"
    },
    "service": {
        "address": "http://elastic-package-service_ceph_1:8080"
    },
    "tags": [
        "preserve_original_event",
        "ceph-osd_pool_stats",
        "forwarded"
    ]
}
ECS Field Reference
Please refer to the following document for detailed information on ECS fields.
Exported fields
| Field | Description | Type | Unit | Metric Type |
|---|---|---|---|---|
| @timestamp | Event timestamp. | date | ||
| ceph.osd_pool_stats.client_io_rate.count | Total number of client I/O rates operation per second. | long | gauge | |
| ceph.osd_pool_stats.client_io_rate.read.bytes | Number of client I/O read rates in bytes per second | long | byte | gauge |
| ceph.osd_pool_stats.client_io_rate.read.count | Number of client I/O rates read operations per second. | long | gauge | |
| ceph.osd_pool_stats.client_io_rate.write.bytes | Number of client I/O write rates in bytes per second | long | byte | gauge |
| ceph.osd_pool_stats.client_io_rate.write.count | Number of client I/O rates write operations per second. | long | byte | gauge |
| ceph.osd_pool_stats.pool_id | Pool ID. | long | ||
| ceph.osd_pool_stats.pool_name | Pool name. | keyword | ||
| data_stream.dataset | Data stream dataset. | constant_keyword | ||
| data_stream.namespace | Data stream namespace. | constant_keyword | ||
| data_stream.type | Data stream type. | constant_keyword | ||
| input.type | Type of Filebeat input. | keyword |
This is the osd_tree data stream. This data stream collects metrics related to Object Storage Daemon (OSD) tree id, name, status, exists, crush_weight, etc.
Example
{
    "@timestamp": "2023-02-06T17:09:29.195Z",
    "agent": {
        "ephemeral_id": "3c25da0e-9512-425a-ab31-343c7bf017eb",
        "id": "7f9a4074-766e-4b2e-91f7-f9311ac8b74a",
        "name": "docker-fleet-agent",
        "type": "filebeat",
        "version": "8.5.1"
    },
    "ceph": {
        "osd_tree": {
            "crush_weight": 0.0194854736328125,
            "depth": 2,
            "device_class": "hdd",
            "exists": true,
            "node_osd_id": 0,
            "node_osd_name": "osd.0",
            "primary_affinity": {
                "count": 1
            },
            "reweight": 1,
            "status": "up",
            "type": {
                "id": 0,
                "name": "osd"
            }
        }
    },
    "data_stream": {
        "dataset": "ceph.osd_tree",
        "namespace": "ep",
        "type": "logs"
    },
    "ecs": {
        "version": "8.11.0"
    },
    "elastic_agent": {
        "id": "7f9a4074-766e-4b2e-91f7-f9311ac8b74a",
        "snapshot": false,
        "version": "8.5.1"
    },
    "event": {
        "agent_id_status": "verified",
        "created": "2023-02-06T17:09:29.195Z",
        "dataset": "ceph.osd_tree",
        "ingested": "2023-02-06T17:09:30Z",
        "kind": "metric",
        "module": "ceph",
        "original": "{\"crush_weight\":0.0194854736328125,\"depth\":2,\"device_class\":\"hdd\",\"exists\":1,\"id\":0,\"name\":\"osd.0\",\"pool_weights\":{},\"primary_affinity\":1,\"reweight\":1,\"status\":\"up\",\"type\":\"osd\",\"type_id\":0}",
        "type": [
            "info"
        ]
    },
    "input": {
        "type": "httpjson"
    },
    "service": {
        "address": "http://elastic-package-service_ceph_1:8080"
    },
    "tags": [
        "preserve_original_event",
        "ceph-osd_tree",
        "forwarded"
    ]
}
ECS Field Reference
Please refer to the following document for detailed information on ECS fields.
Exported fields
| Field | Description | Type | Metric Type |
|---|---|---|---|
| @timestamp | Event timestamp. | date | |
| ceph.osd_tree.children | Bucket children list, separated by a comma. | keyword | |
| ceph.osd_tree.crush_weight | CRUSH buckets reflect the sum of the weights of the buckets or the devices they contain. For example, a rack containing a two hosts with two OSDs each, might have a weight of 4.0 and each host a weight of 2.0. The sum for each OSD, where the weight per OSD is 1.00. | float | gauge |
| ceph.osd_tree.depth | Depth of OSD node. | long | |
| ceph.osd_tree.device_class | The device class of OSD. i.e. hdd, ssd etc. | keyword | |
| ceph.osd_tree.exists | Represent OSD node still exist or not (1-true, 0-false). | boolean | |
| ceph.osd_tree.node_osd_id | OSD or bucket node id. | long | |
| ceph.osd_tree.node_osd_name | OSD or bucket node name. | keyword | |
| ceph.osd_tree.primary_affinity.count | The weight of reading data from primary OSD. | float | gauge |
| ceph.osd_tree.reweight | OSD reweight sets an override weight on the OSD. This value is in the range 0 to 1, and forces CRUSH to re-place (1-weight) of the data that would otherwise live on the drive. | float | |
| ceph.osd_tree.status | Status of the OSD, it should be up or down. | keyword | |
| ceph.osd_tree.type.id | OSD or bucket node typeID. | long | |
| ceph.osd_tree.type.name | OSD or bucket node type, illegal type include osd, host, root etc. | keyword | |
| data_stream.dataset | Data stream dataset. | constant_keyword | |
| data_stream.namespace | Data stream namespace. | constant_keyword | |
| data_stream.type | Data stream type. | constant_keyword | |
| input.type | Type of Filebeat input. | keyword |
This is the pool_disk data stream. This data stream collects metrics related to pool id, pool name, pool objects, used bytes and available bytes of the pool disk.
Example
{
    "@timestamp": "2023-02-07T05:52:52.471Z",
    "agent": {
        "ephemeral_id": "eb0767e3-08fd-4b51-9325-5e22c2a46f26",
        "id": "fc67a49e-143a-47a1-96bc-0e4881f0fcb6",
        "name": "docker-fleet-agent",
        "type": "filebeat",
        "version": "8.5.1"
    },
    "ceph": {
        "pool_disk": {
            "available": {
                "bytes": 25633505280
            },
            "object": {
                "count": 4
            },
            "pool_id": 1,
            "pool_name": "device_health_metrics",
            "stored": {
                "bytes": 2142673
            },
            "used": {
                "bytes": 6488064,
                "pct": 0.0000843624584376812
            }
        }
    },
    "data_stream": {
        "dataset": "ceph.pool_disk",
        "namespace": "ep",
        "type": "logs"
    },
    "ecs": {
        "version": "8.11.0"
    },
    "elastic_agent": {
        "id": "fc67a49e-143a-47a1-96bc-0e4881f0fcb6",
        "snapshot": false,
        "version": "8.5.1"
    },
    "event": {
        "agent_id_status": "verified",
        "created": "2023-02-07T05:52:52.471Z",
        "dataset": "ceph.pool_disk",
        "ingested": "2023-02-07T05:52:53Z",
        "kind": "metric",
        "module": "ceph",
        "original": "{\"id\":1,\"name\":\"device_health_metrics\",\"stats\":{\"bytes_used\":6488064,\"kb_used\":6336,\"max_avail\":25633505280,\"objects\":4,\"percent_used\":0.0000843624584376812,\"stored\":2142673}}",
        "type": [
            "info"
        ]
    },
    "input": {
        "type": "httpjson"
    },
    "service": {
        "address": "http://elastic-package-service_ceph_1:8080"
    },
    "tags": [
        "preserve_original_event",
        "ceph-pool_disk",
        "forwarded"
    ]
}
ECS Field Reference
Please refer to the following document for detailed information on ECS fields.
Exported fields
| Field | Description | Type | Unit | Metric Type |
|---|---|---|---|---|
| @timestamp | Event timestamp. | date | ||
| ceph.pool_disk.available.bytes | Available bytes of the pool. | long | byte | gauge |
| ceph.pool_disk.object.count | Number of objects of the pool. | long | gauge | |
| ceph.pool_disk.pool_id | Id of the pool. | long | ||
| ceph.pool_disk.pool_name | Name of the pool. | keyword | ||
| ceph.pool_disk.stored.bytes | Stored data of the pool. | long | byte | gauge |
| ceph.pool_disk.used.bytes | Used bytes of the pool. | long | byte | gauge |
| ceph.pool_disk.used.pct | Used bytes in percentage of the pool. | double | percent | gauge |
| data_stream.dataset | Data stream dataset. | constant_keyword | ||
| data_stream.namespace | Data stream namespace. | constant_keyword | ||
| data_stream.type | Data stream type. | constant_keyword | ||
| input.type | Type of Filebeat input. | keyword |
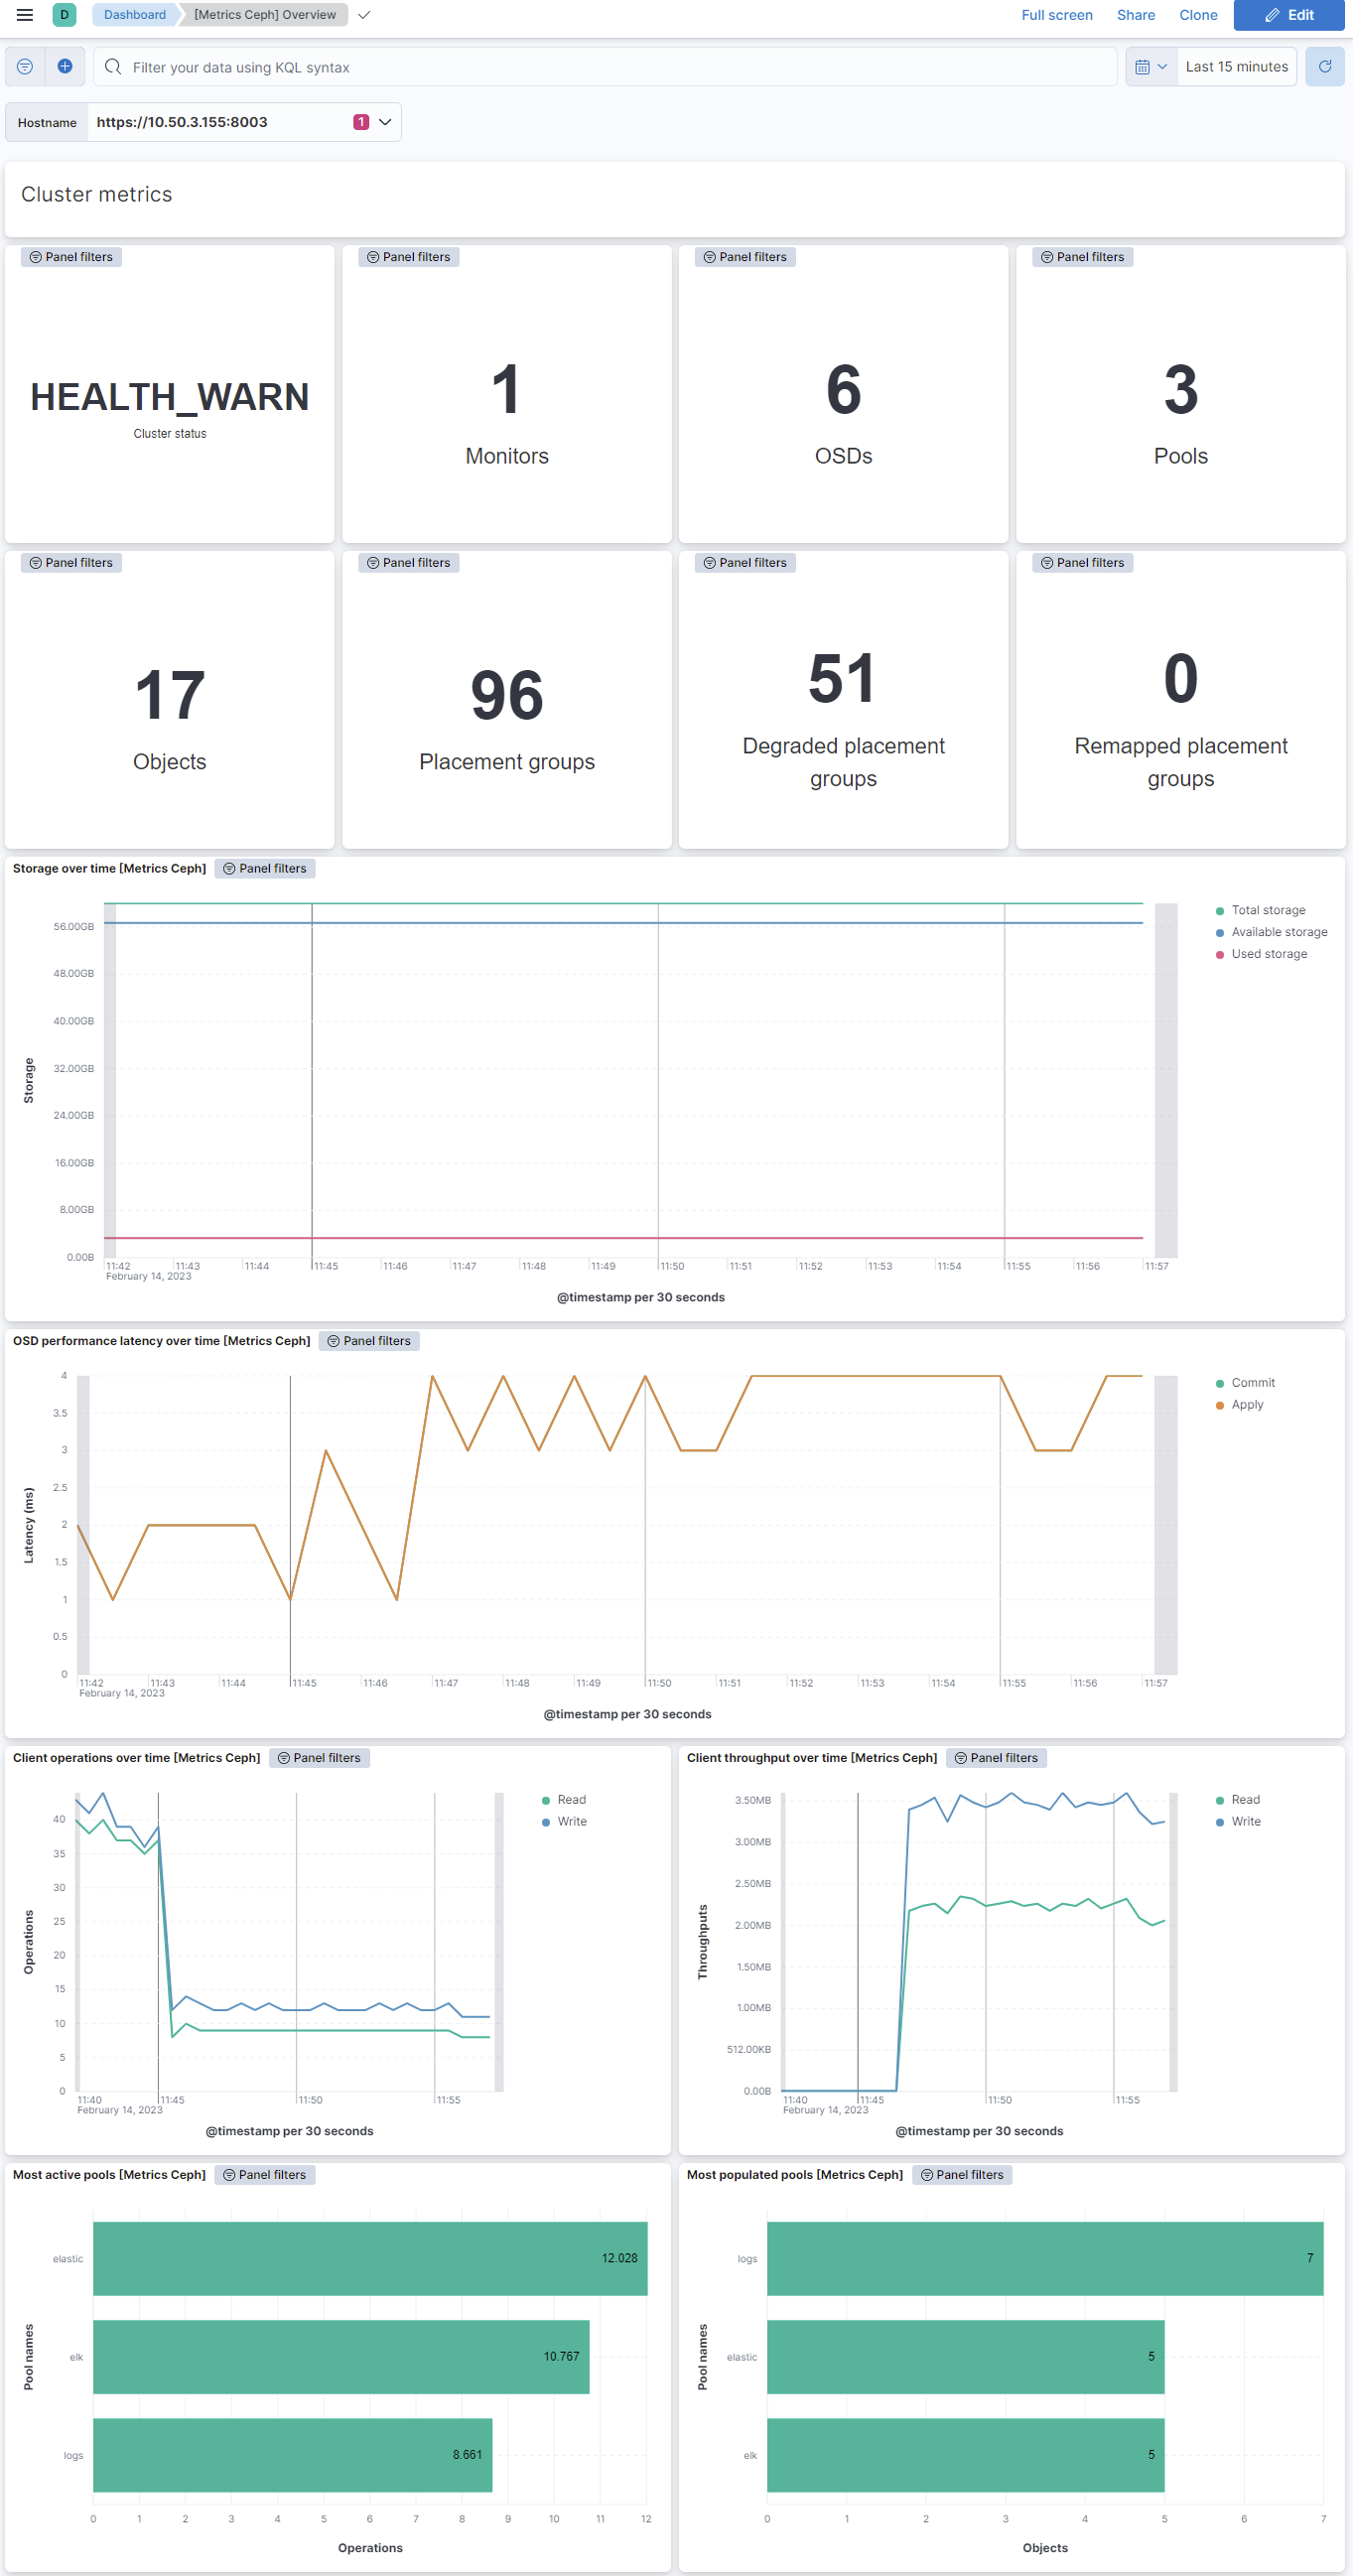
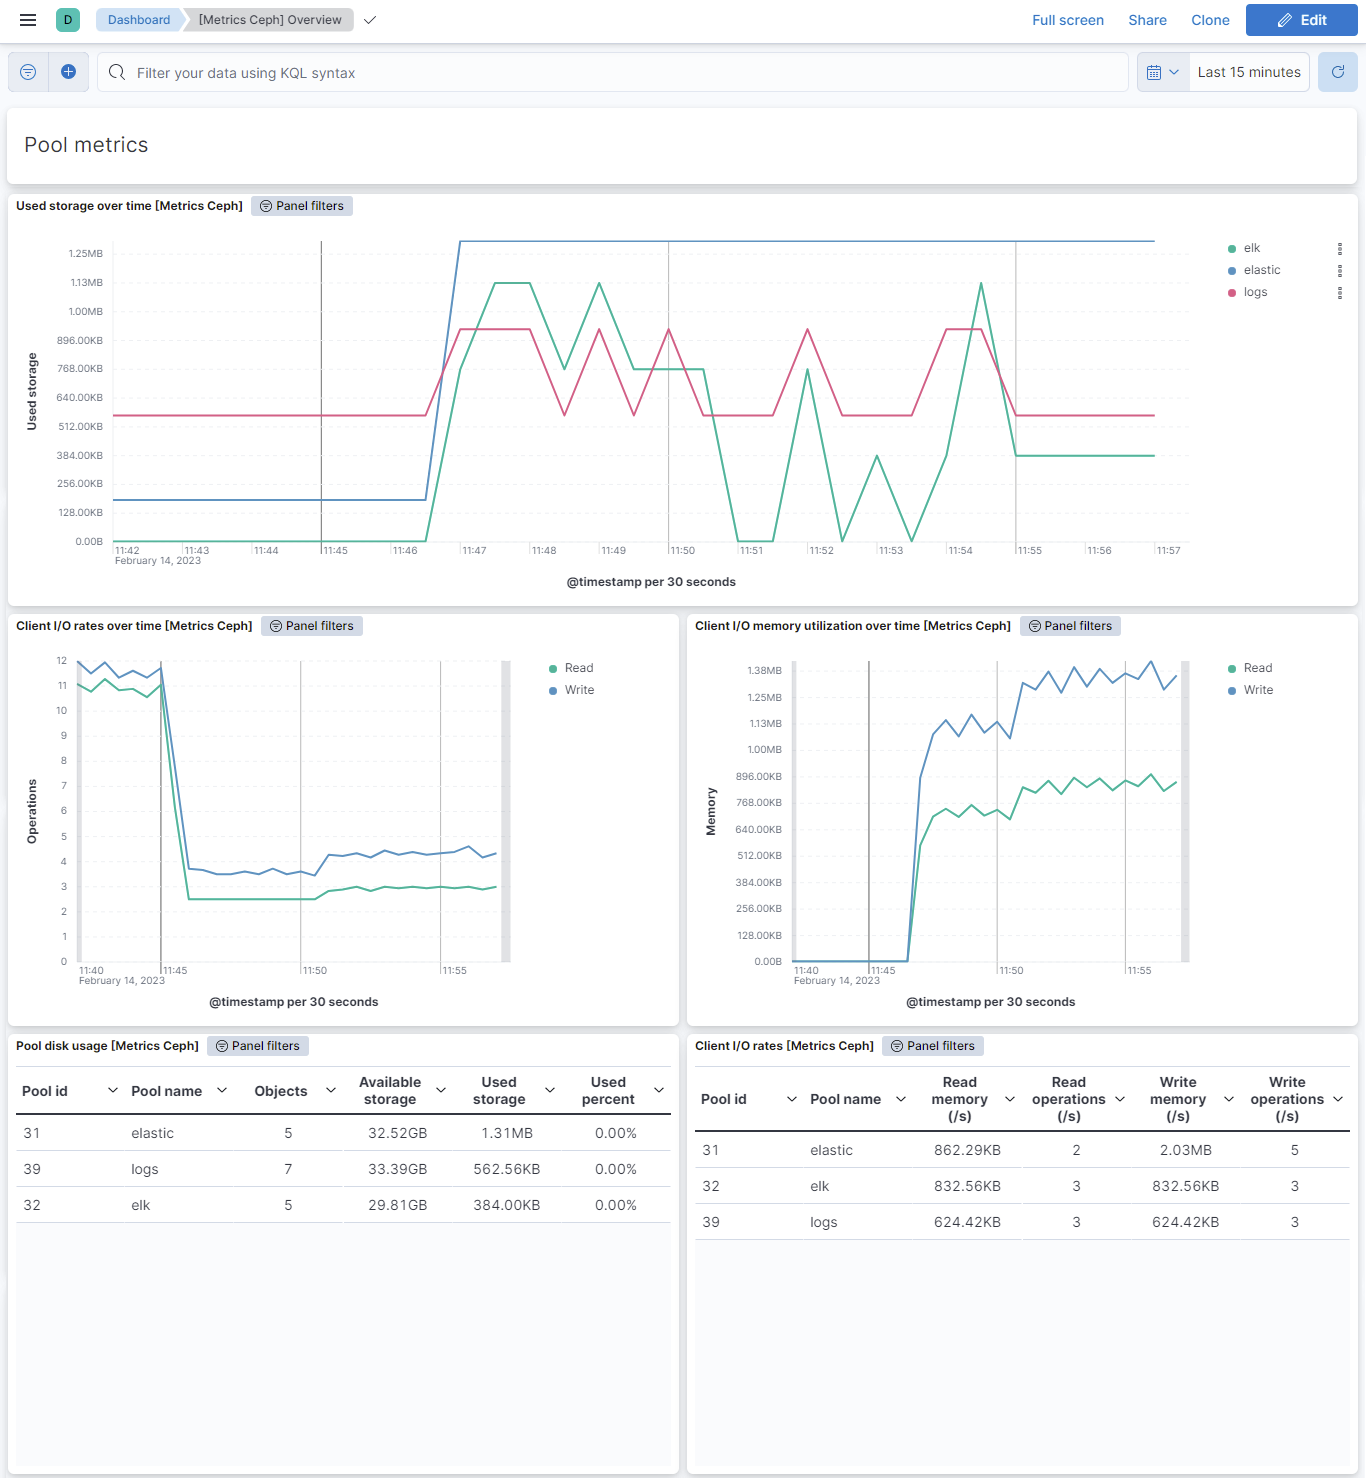
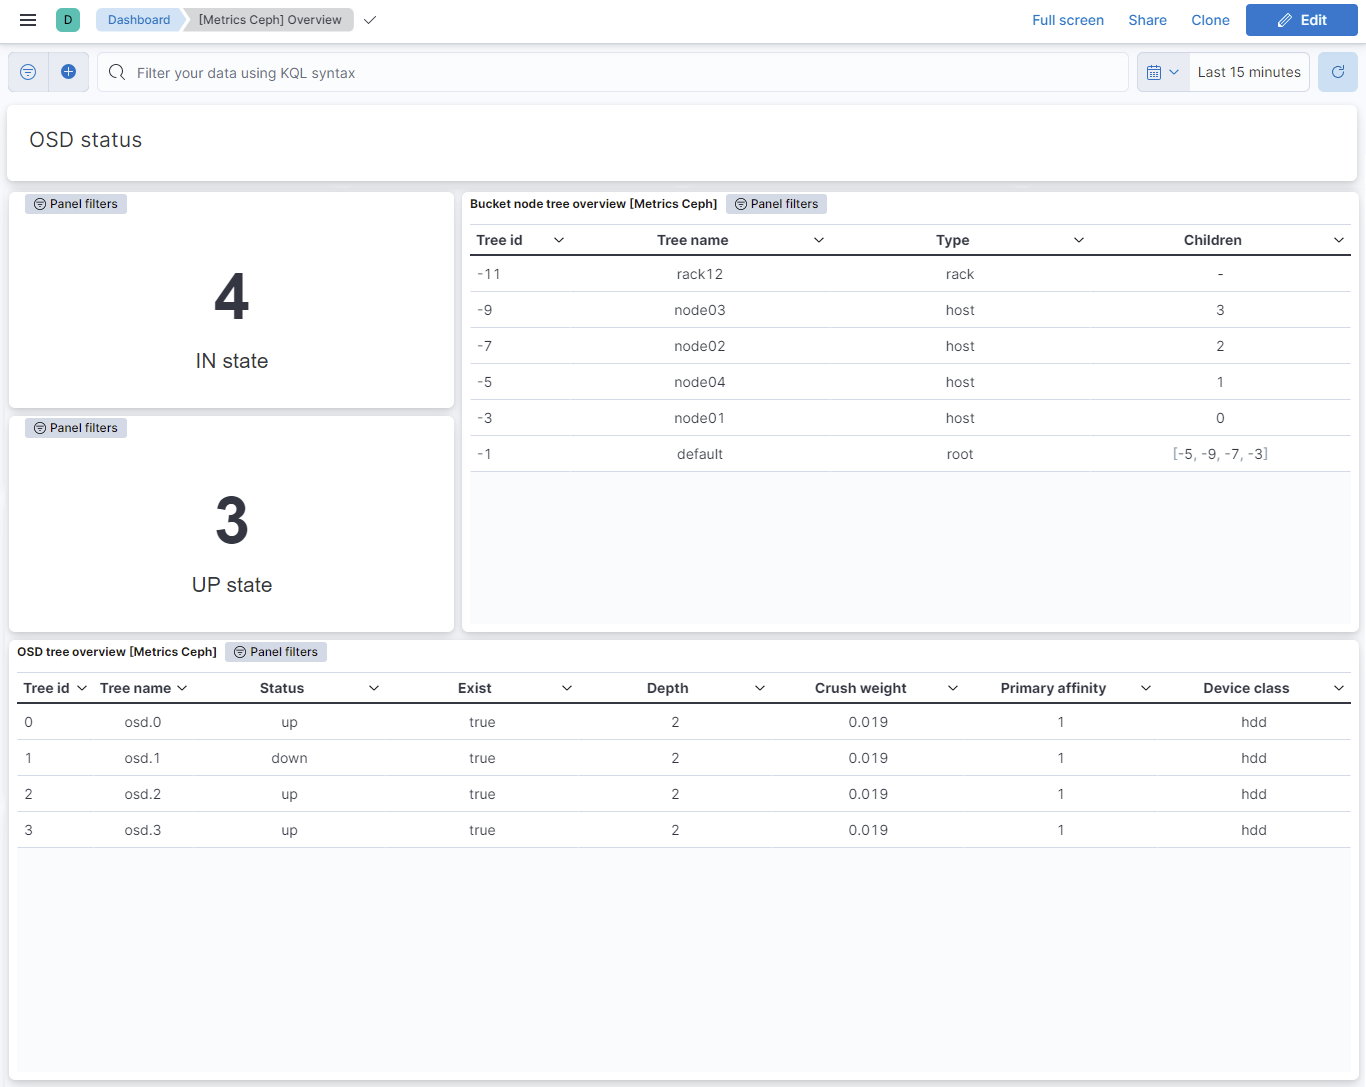
This integration includes one or more Kibana dashboards that visualizes the data collected by the integration. The screenshots below illustrate how the ingested data is displayed.
Changelog
| Version | Details | Minimum Kibana version |
|---|---|---|
| 1.9.0 | Enhancement (View pull request) Improve documentation |
9.0.0 8.13.0 |
| 1.8.1 | Bug fix (View pull request) Added description to ssl nodes including links to documentation. |
9.0.0 8.13.0 |
| 1.8.0 | Enhancement (View pull request) Add support for Kibana 9.0.0. |
9.0.0 8.13.0 |
| 1.7.2 | Bug fix (View pull request) Update links to getting started docs |
8.13.0 |
| 1.7.1 | Enhancement (View pull request) Add observability category. |
8.13.0 |
| 1.7.0 | Enhancement (View pull request) Allow @custom pipeline access to event.original without setting preserve_original_event. |
8.13.0 |
| 1.6.0 | Enhancement (View pull request) ECS version updated to 8.11.0. Update the kibana constraint to ^8.13.0. Modified the field definitions to remove ECS fields made redundant by the ecs@mappings component template. |
8.13.0 |
| 1.5.0 | Enhancement (View pull request) Add global filter on data_stream.dataset to improve performance. |
8.12.0 |
| 1.4.1 | Enhancement (View pull request) Update README with reindexing steps. |
8.12.0 |
| 1.4.0 | Enhancement (View pull request) Enable secrets for sensitive fields. For more details, refer https://www.elastic.co/guide/en/fleet/current/agent-policy.html#agent-policy-secret-values |
8.12.0 |
| 1.3.1 | Bug fix (View pull request) Disable secrets for older stack versions due to errors. |
8.7.1 |
| 1.3.0 | Enhancement (View pull request) Enable 'secret' for the sensitive fields, supported from 8.12. |
8.7.1 |
| 1.2.0 | Enhancement (View pull request) Limit request tracer log count to five. |
8.7.1 |
| 1.1.0 | Enhancement (View pull request) Update the package format_version to 3.0.0. |
8.7.1 |
| 1.0.1 | Bug fix (View pull request) Add null check and ignore_missing check to the rename processor |
8.7.1 |
| 1.0.0 | Enhancement (View pull request) Make CEPH GA. |
8.7.1 |
| 0.10.1 | Bug fix (View pull request) Resolve host.ip field conflict. |
8.7.1 |
| 0.10.0 | Enhancement (View pull request) Rename ownership from obs-service-integrations to obs-infraobs-integrations |
8.7.1 |
| 0.9.0 | Enhancement (View pull request) Add a new flag to enable request tracing |
8.7.1 |
| 0.8.0 | Enhancement (View pull request) Ceph integration package with visualizations. |
8.5.1 |
| 0.7.0 | Enhancement (View pull request) Ceph integration package with "cluster_status" data stream. |
8.5.1 |
| 0.6.0 | Enhancement (View pull request) Ceph integration package with "cluster_disk" data stream. |
8.5.1 |
| 0.5.0 | Enhancement (View pull request) Ceph integration package with "pool_disk" data stream. |
8.5.1 |
| 0.4.0 | Enhancement (View pull request) Ceph integration package with "osd_tree" data stream. |
8.5.1 |
| 0.3.0 | Enhancement (View pull request) Ceph integration package with "osd_pool_stats" data stream. |
8.5.1 |
| 0.2.0 | Enhancement (View pull request) Ceph integration package with "cluster_health" data stream. |
8.5.1 |
| 0.1.0 | Enhancement (View pull request) Ceph integration package with "osd_performance" data stream. |
8.5.1 |