RUM OpenTelemetry Assets
Elastic Cloud Serverless projects are autoscaled environments, fully managed by Elastic and available on Elastic Cloud. Availability This functionality is in technical preview and is ready for evaluation. Use with caution in production; it is not recommended for mission-critical workloads. Elastic will work to fix any issues, but features in technical preview are not subject to the support SLA of official GA features. Specific Support terms apply. Elastic Cloud Serverless projects are autoscaled environments, fully managed by Elastic and available on Elastic Cloud. Availability This functionality is in technical preview and is ready for evaluation. Use with caution in production; it is not recommended for mission-critical workloads. Elastic will work to fix any issues, but features in technical preview are not subject to the support SLA of official GA features. Specific Support terms apply. The Elastic Stack includes Elastic's core products such as Elasticsearch, Kibana, Logstash, and Beats. Availability This functionality is in technical preview and is ready for evaluation. Use with caution in production; it is not recommended for mission-critical workloads. Elastic will work to fix any issues, but features in technical preview are not subject to the support SLA of official GA features. Specific Support terms apply. Unless stated otherwise on the page, this functionality is available when your Elastic Stack is deployed on Elastic Cloud Hosted, Elastic Cloud Enterprise, Elastic Cloud on Kubernetes, and self-managed environments. This documentation corresponds to the latest patch available for each minor version. If you're not using the latest patch, check the release notes for changes.
Serverless Observability
Preview
Preview
Serverless Security
Preview
Preview
Stack
Preview
9.5+
Preview since 9.5
| Version | 0.0.7 Availability Preview This functionality is in technical preview and is ready for evaluation. Use with caution in production; it is not recommended for mission-critical workloads. Elastic will work to fix any issues, but features in technical preview are not subject to the support SLA of official GA features. Specific Support terms apply. (View all) |
| Subscription level What's this? |
Basic |
| Developed by What's this? |
Elastic |
| Minimum Kibana version(s) | 9.5.3 |
To use pre-release integrations, go to the Integrations page in Kibana, scroll down, and toggle on the Display beta integrations option.
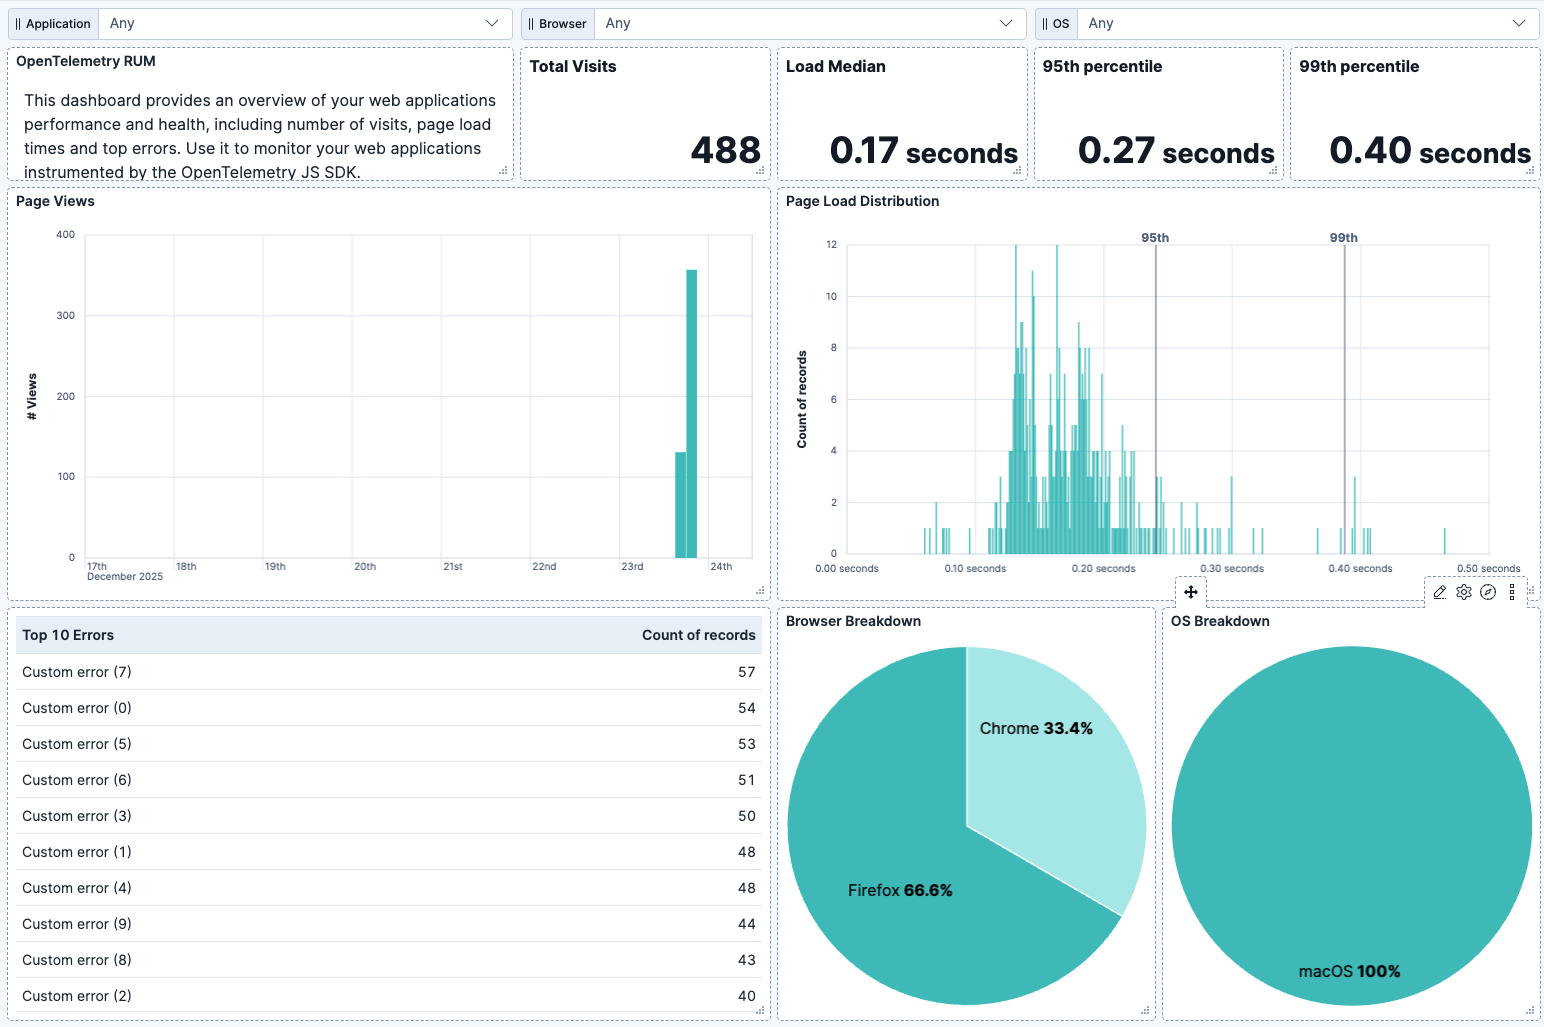
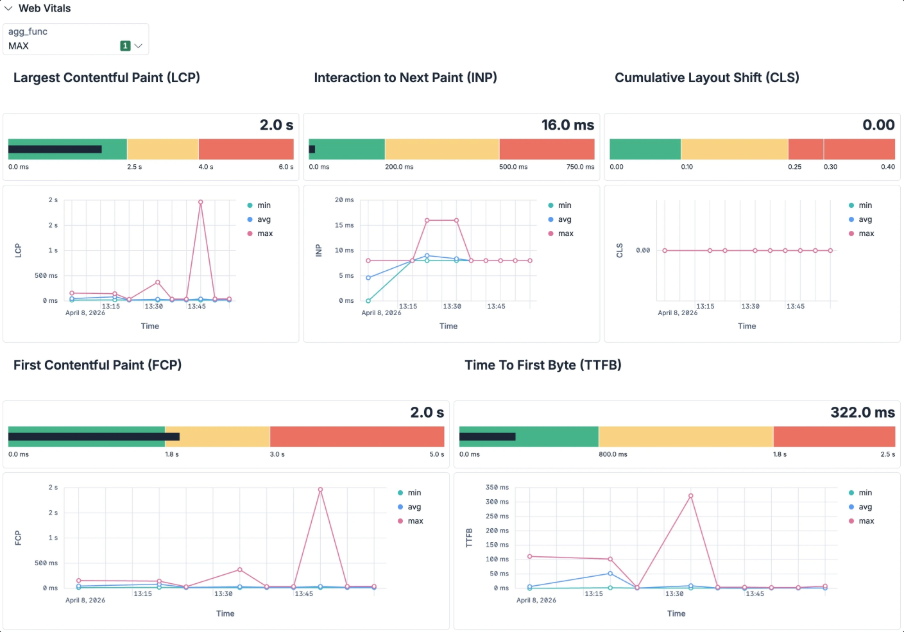
Use this package to get a dashboard which displays metrics from your web applications instrumented by Opentelemetry JS SDK. The metrics diplayed are:
- page load and visits: these metrics are calculated from the telemetry captured by
NavigationTimingInstrumentationwithin@opentelemetry/browser-instrumentationpackage. For backwards compatibility it also queries for data collected by@opentelemetry/instrumentation-document-loadinstrumentation. - errors: the top errors are calculated from the telemetry captured by
ErrorsInstrumentationwithin@opentelemetry/browser-instrumentationpackage. For backwards compatibility it also queries for data collected by@opentelemetry/instrumentation-web-exceptioninstrumentation. - web vitals: the web vitals are calculated from the telemetry captured by
WebVitalsInstrumentationwithin@opentelemetry/browser-instrumentationpackage.
You should have all instrumentations enabled in your web application to get the metrics populated in this dashboard.
This package has been tested with OpenTelemetry Browser SDK 0.3.0 and with OpenTelemetry semantic conventions 1.38.0. It should work with later versions as long as there are no breaking changes in browser.* namespace of semantic conventions.
This package requires that your log record and trace exports contain a resource attribute named user_agent.original as defined in semantic conventions. Such field is used to resolve which browser and OS the data is coming from.
This package will show metrics only if you are monitoring web applications with OpenTelemetry JS SDK. If you are new to OpenTelemetry RUM you can check the guide on how to start with the Elastic stack.
- In the top search bar in Kibana, search for Dashboards.
- In the search bar, type RUM OTel.
- Select a dashboard for the dataset you are collecting, and verify the dashboard information is populated.
If you do not see data in the dashboard make sure that:
- Elastic search has recevied the documents from Opentelemetry JS SDK. You can search for them in discover with the filter
telemetry.sdk.language : "webjs" - You can run more detailed searches to ensure the data is available for specific sections of the dashboard:
- use the filter
scope.name : "@opentelemetry/instrumentation-document-load" or scope.name : "@opentelemetry/browser-instrumentation/navigation-timing"to check if the data for page load metrics is present. - use the filter
scope.name : "@opentelemetry/instrumentation-web-exception" or scope.name : "@opentelemetry/browser-instrumentation/errors"to check if the data for error metrics is present. - use the filter
scope.name : "@opentelemetry/browser-instrumentation/web-vitals"to check if the data for web vitals metrics is present. - use the filter
resource.attributes.user_agent.original : *to check if the logs/traces contain the right resource attribute.
- use the filter
This integration includes one or more Kibana dashboards that visualizes the data collected by the integration. The screenshots below illustrate how the ingested data is displayed.
Changelog
| Version | Details | Minimum Kibana version |
|---|---|---|
| 0.0.7 | Bug fix (View pull request) Nullify unmapped fields in ESQL queries. |
9.5.3 |
| 0.0.6 | Enhancement (View pull request) Improve ESQL queries to work with newer browser instrumentations. |
9.5.3 |
| 0.0.5 | Bug fix (View pull request) Set ESQL controls selected_options to null so it is interpreted as "nothing selected" in all ES versions. |
9.4.0 |
| 0.0.4 | Bug fix (View pull request) Use ESQL to parse user_agent |
9.4.0 |
| 0.0.3 | Enhancement (View pull request) Add web vitals metrics |
9.4.0 |
| 0.0.2 | Bug fix (View pull request) Fix filters on metrics and errors panels |
9.2.1 |
| 0.0.1 | Enhancement (View pull request) Initial draft of the package |
9.2.1 |