Kubernetes OpenTelemetry Assets
Elastic Cloud Serverless projects are autoscaled environments, fully managed by Elastic and available on Elastic Cloud. Availability This functionality is generally available and ready for production usage. Elastic Cloud Serverless projects are autoscaled environments, fully managed by Elastic and available on Elastic Cloud. Availability This functionality is generally available and ready for production usage. The Elastic Stack includes Elastic's core products such as Elasticsearch, Kibana, Logstash, and Beats. Availability This functionality is generally available and ready for production usage. Unless stated otherwise on the page, this functionality is available when your Elastic Stack is deployed on Elastic Cloud Hosted, Elastic Cloud Enterprise, Elastic Cloud on Kubernetes, and self-managed environments. This documentation corresponds to the latest patch available for each minor version. If you're not using the latest patch, check the release notes for changes.
Serverless Observability
Generally available
Serverless Security
Generally available
Stack
9.4+
Generally available since 9.4
| Version | 2.6.1 (View all) |
| Subscription level What's this? |
Basic |
| Developed by What's this? |
Elastic |
| Minimum Kibana version(s) | 9.4.0 |
Kubernetes OpenTelemetry Assets must be used with OpenTelemetry data. With this package will be installed assets to monitor Kubernetes clusters.
You need Elasticsearch for storing and searching your data and Kibana for visualizing and managing it. You can use our hosted Elasticsearch Service on Elastic Cloud, which is recommended, or self-manage the Elastic Stack on your own hardware.
For step-by-step instructions on how to ingest opentelemetry data using the OpenTelemetry Operator, see the Elastic Distribution for OTel Collector quickstart guide.
Alert rule templates provide pre-defined configurations for creating alert rules in Kibana.
For more information, refer to the Elastic documentation.
Alert rule templates require Elastic Stack version 9.2.0 or later.
The following alert rule templates are available:
[K8s OTel] Container CPU throttling
Alerts when containers are using more than 90% of their CPU limit. Throttled containers experience increased latency without triggering crashes or OOMKills, making them hard to detect without explicit monitoring.
[K8s OTel] Container memory near limit
Alerts when containers are using more than 90% of their memory limit. Containers approaching their memory limit will be OOMKilled, causing restarts and service disruption.
[K8s OTel] DaemonSet mis-scheduled or not ready
Alerts when a DaemonSet has misscheduled nodes (pods running where they shouldn't) or is not fully scheduled (current < desired). Indicates node selector, taint/toleration, or scheduling issues.
[K8s OTel] Deployment unavailable replicas
Alerts when a Kubernetes deployment has fewer available replicas than desired, indicating the deployment cannot maintain its target replica count. Common causes: rolling update failures, resource starvation, image pull errors.
[K8s OTel] HPA at max replicas
Alerts when a HorizontalPodAutoscaler has scaled to its maximum replica count. This means demand is outpacing the autoscaler's ability to scale, and pods may start becoming resource-constrained or pending.
[K8s OTel] Job failures
Alerts when Kubernetes Jobs have failed pods. Non-zero failed pod counts indicate processing failures in batch workloads. Repeated failures in CronJobs can cause a backlog of active jobs.
[K8s OTel] Node CPU saturation
Alerts when a node's average CPU usage exceeds a configurable threshold. High CPU usage causes scheduling failures, pod throttling, and degraded workload performance. Threshold should be calibrated to your node's allocatable CPU.
[K8s OTel] Node disk pressure
Alerts when any Kubernetes node reports the DiskPressure condition. This is a warning signal that the node is running low on disk space and may begin evicting pods.
[K8s OTel] Node filesystem saturation
Alerts when a node's filesystem usage exceeds 85% of capacity. Disk pressure triggers pod evictions and can destabilise the node.
[K8s OTel] Node memory pressure
Alerts when any Kubernetes node reports the MemoryPressure condition. This is a warning signal that the node is running low on memory and may begin evicting pods.
[K8s OTel] Node memory saturation
Alerts when a node's memory working set exceeds a configurable threshold. High memory usage triggers OOM kills and pod evictions. Threshold should be calibrated to your node's allocatable memory.
[K8s OTel] Node not ready
Alerts when any Kubernetes node has condition_ready == 0, indicating the node is not ready to accept workloads. Pods on NotReady nodes are eventually evicted. Common causes: kubelet crashes, network partitions, resource exhaustion.
[K8s OTel] OOMKilled containers
Alerts when containers have been OOMKilled — terminated by the kernel OOM killer for exceeding their memory limit. Indicates the container's memory limit is too low or it has a memory leak.
[K8s OTel] Persistent volume space low
Alerts when PersistentVolumes have less than 20% space remaining. Running out of volume space causes application write failures and potential data loss.
[K8s OTel] Pod CrashLoopBackOff
Alerts when containers have a high restart count, indicating CrashLoopBackOff. Rapidly increasing restarts mean a container is repeatedly crashing and being restarted by the kubelet.
[K8s OTel] Pods in Failed phase
Alerts when pods are in Failed phase (phase == 4). Failed pods have terminated with an error and will not be restarted. May indicate persistent issues requiring operator intervention.
[K8s OTel] Pods stuck in Pending phase
Alerts when pods are stuck in Pending phase (phase == 1). Pending pods cannot be scheduled — typically due to insufficient node resources, node affinity/taint mismatches, or missing PVCs. Sustained Pending pods are a proxy for scheduling latency.
[K8s OTel] StatefulSet replicas not ready
Alerts when a StatefulSet has fewer ready pods than desired. StatefulSets manage stateful applications with stable identities, so missing replicas can cause data availability issues.
SLO templates provide pre-defined configurations for creating SLOs in Kibana.
For more information, refer to the Elastic documentation.
SLO templates require Elastic Stack version 9.4.0 or later.
The following SLO templates are available:
View the SLO templates
| Name | Description |
|---|---|
| [Kubernetes OTel] DaemonSet Scheduling Availability 99.0% Rolling 30 Days | This SLO tracks the scheduling availability of Kubernetes DaemonSets using OTel metrics, ensuring that 99.0% of time intervals have each DaemonSet running on all eligible nodes over a rolling period of 30 days. DaemonSets are critical for node-level infrastructure services (monitoring agents, log collectors, security agents, network plugins). |
| [Kubernetes OTel] Deployment Replica Availability 99.5% Rolling 30 Days | This SLO tracks the availability of Kubernetes Deployments using OTel metrics, ensuring that 99.5% of time intervals have each Deployment meeting its desired replica count over a rolling period of 30 days to maintain reliable application serving capacity. When k8s.deployment.available < k8s.deployment.desired, the Deployment has fewer healthy replicas than configured, indicating reduced capacity or total unavailability for the hosted application. |
| [Kubernetes OTel] Job Completion Success Rate 99.0% Rolling 30 Days | This SLO tracks the success rate of Kubernetes Jobs using OTel metrics, ensuring that 99.0% of time intervals show Jobs completing without failures over a rolling period of 30 days. Jobs represent batch workloads (ETL, backups, data pipelines, scheduled tasks) with clear completion semantics. |
| [Kubernetes OTel] StatefulSet Replica Availability 99.5% Rolling 30 Days | This SLO tracks the availability of Kubernetes StatefulSets using OTel metrics, ensuring that 99.5% of time intervals have each StatefulSet meeting its desired replica count over a rolling period of 30 days. StatefulSets manage stateful workloads (databases, message queues, caches) where pod identity and ordering matter — making availability critical for data integrity. |
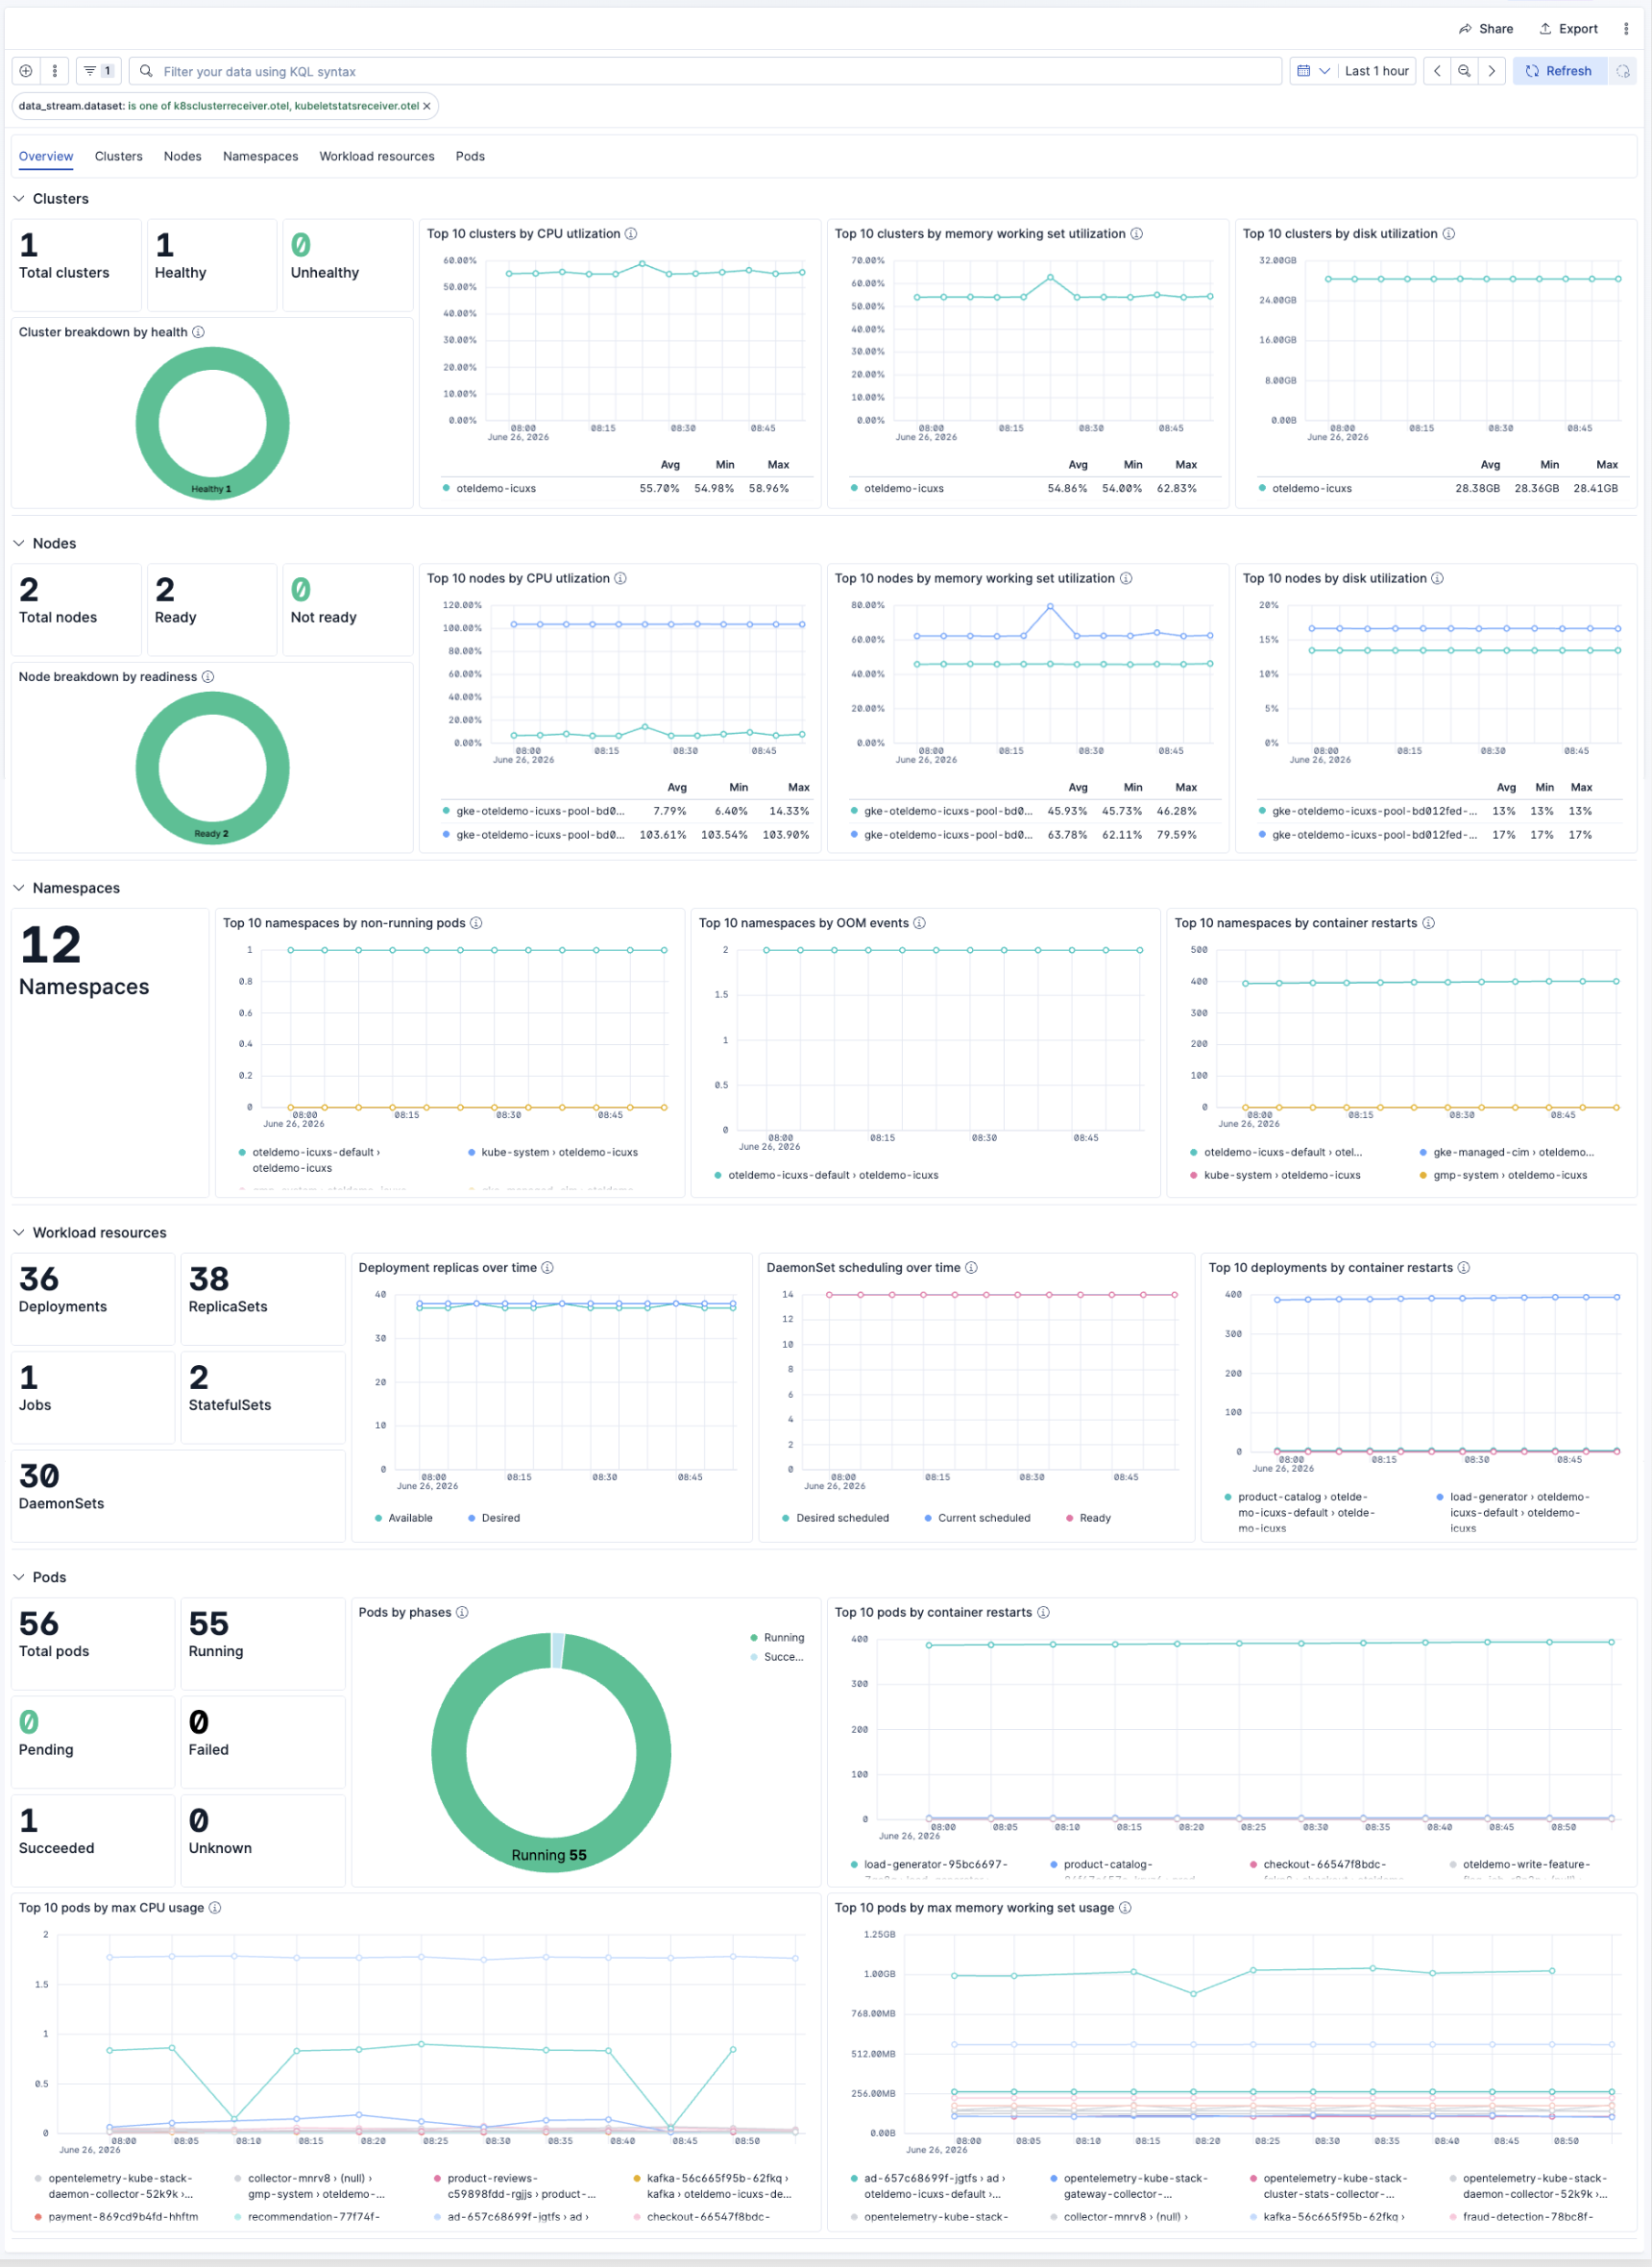
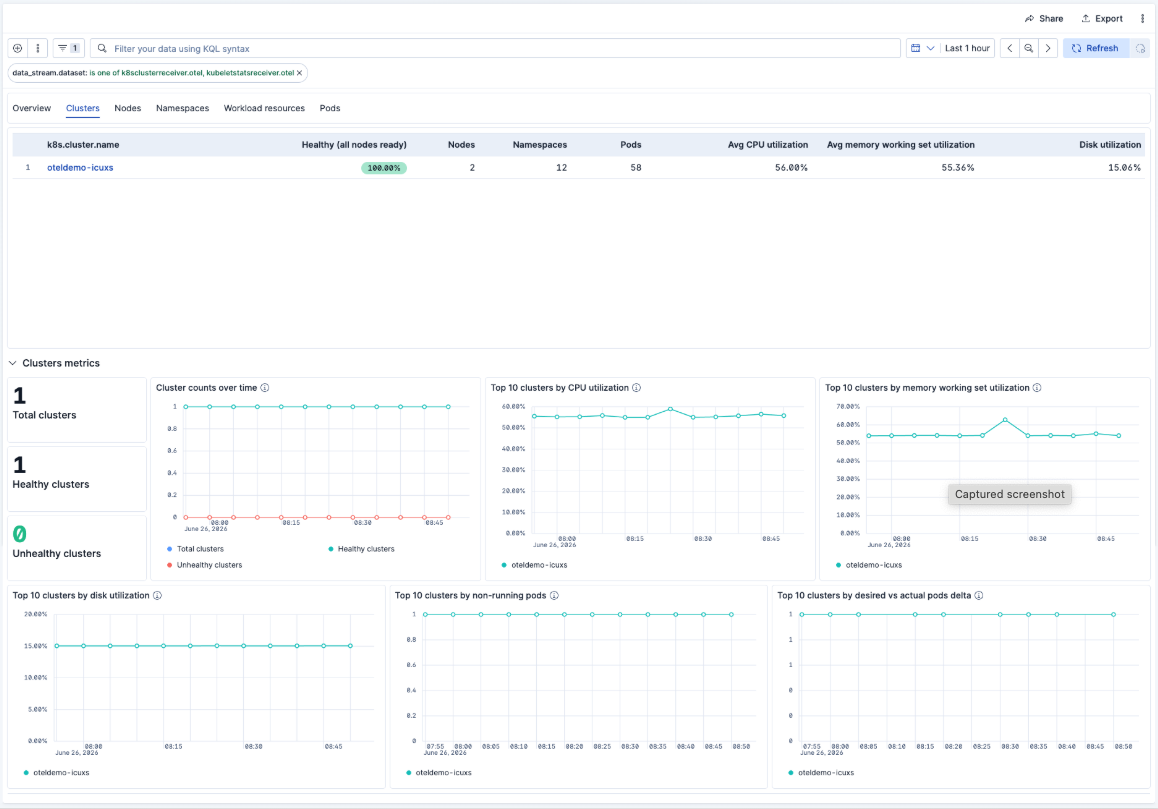
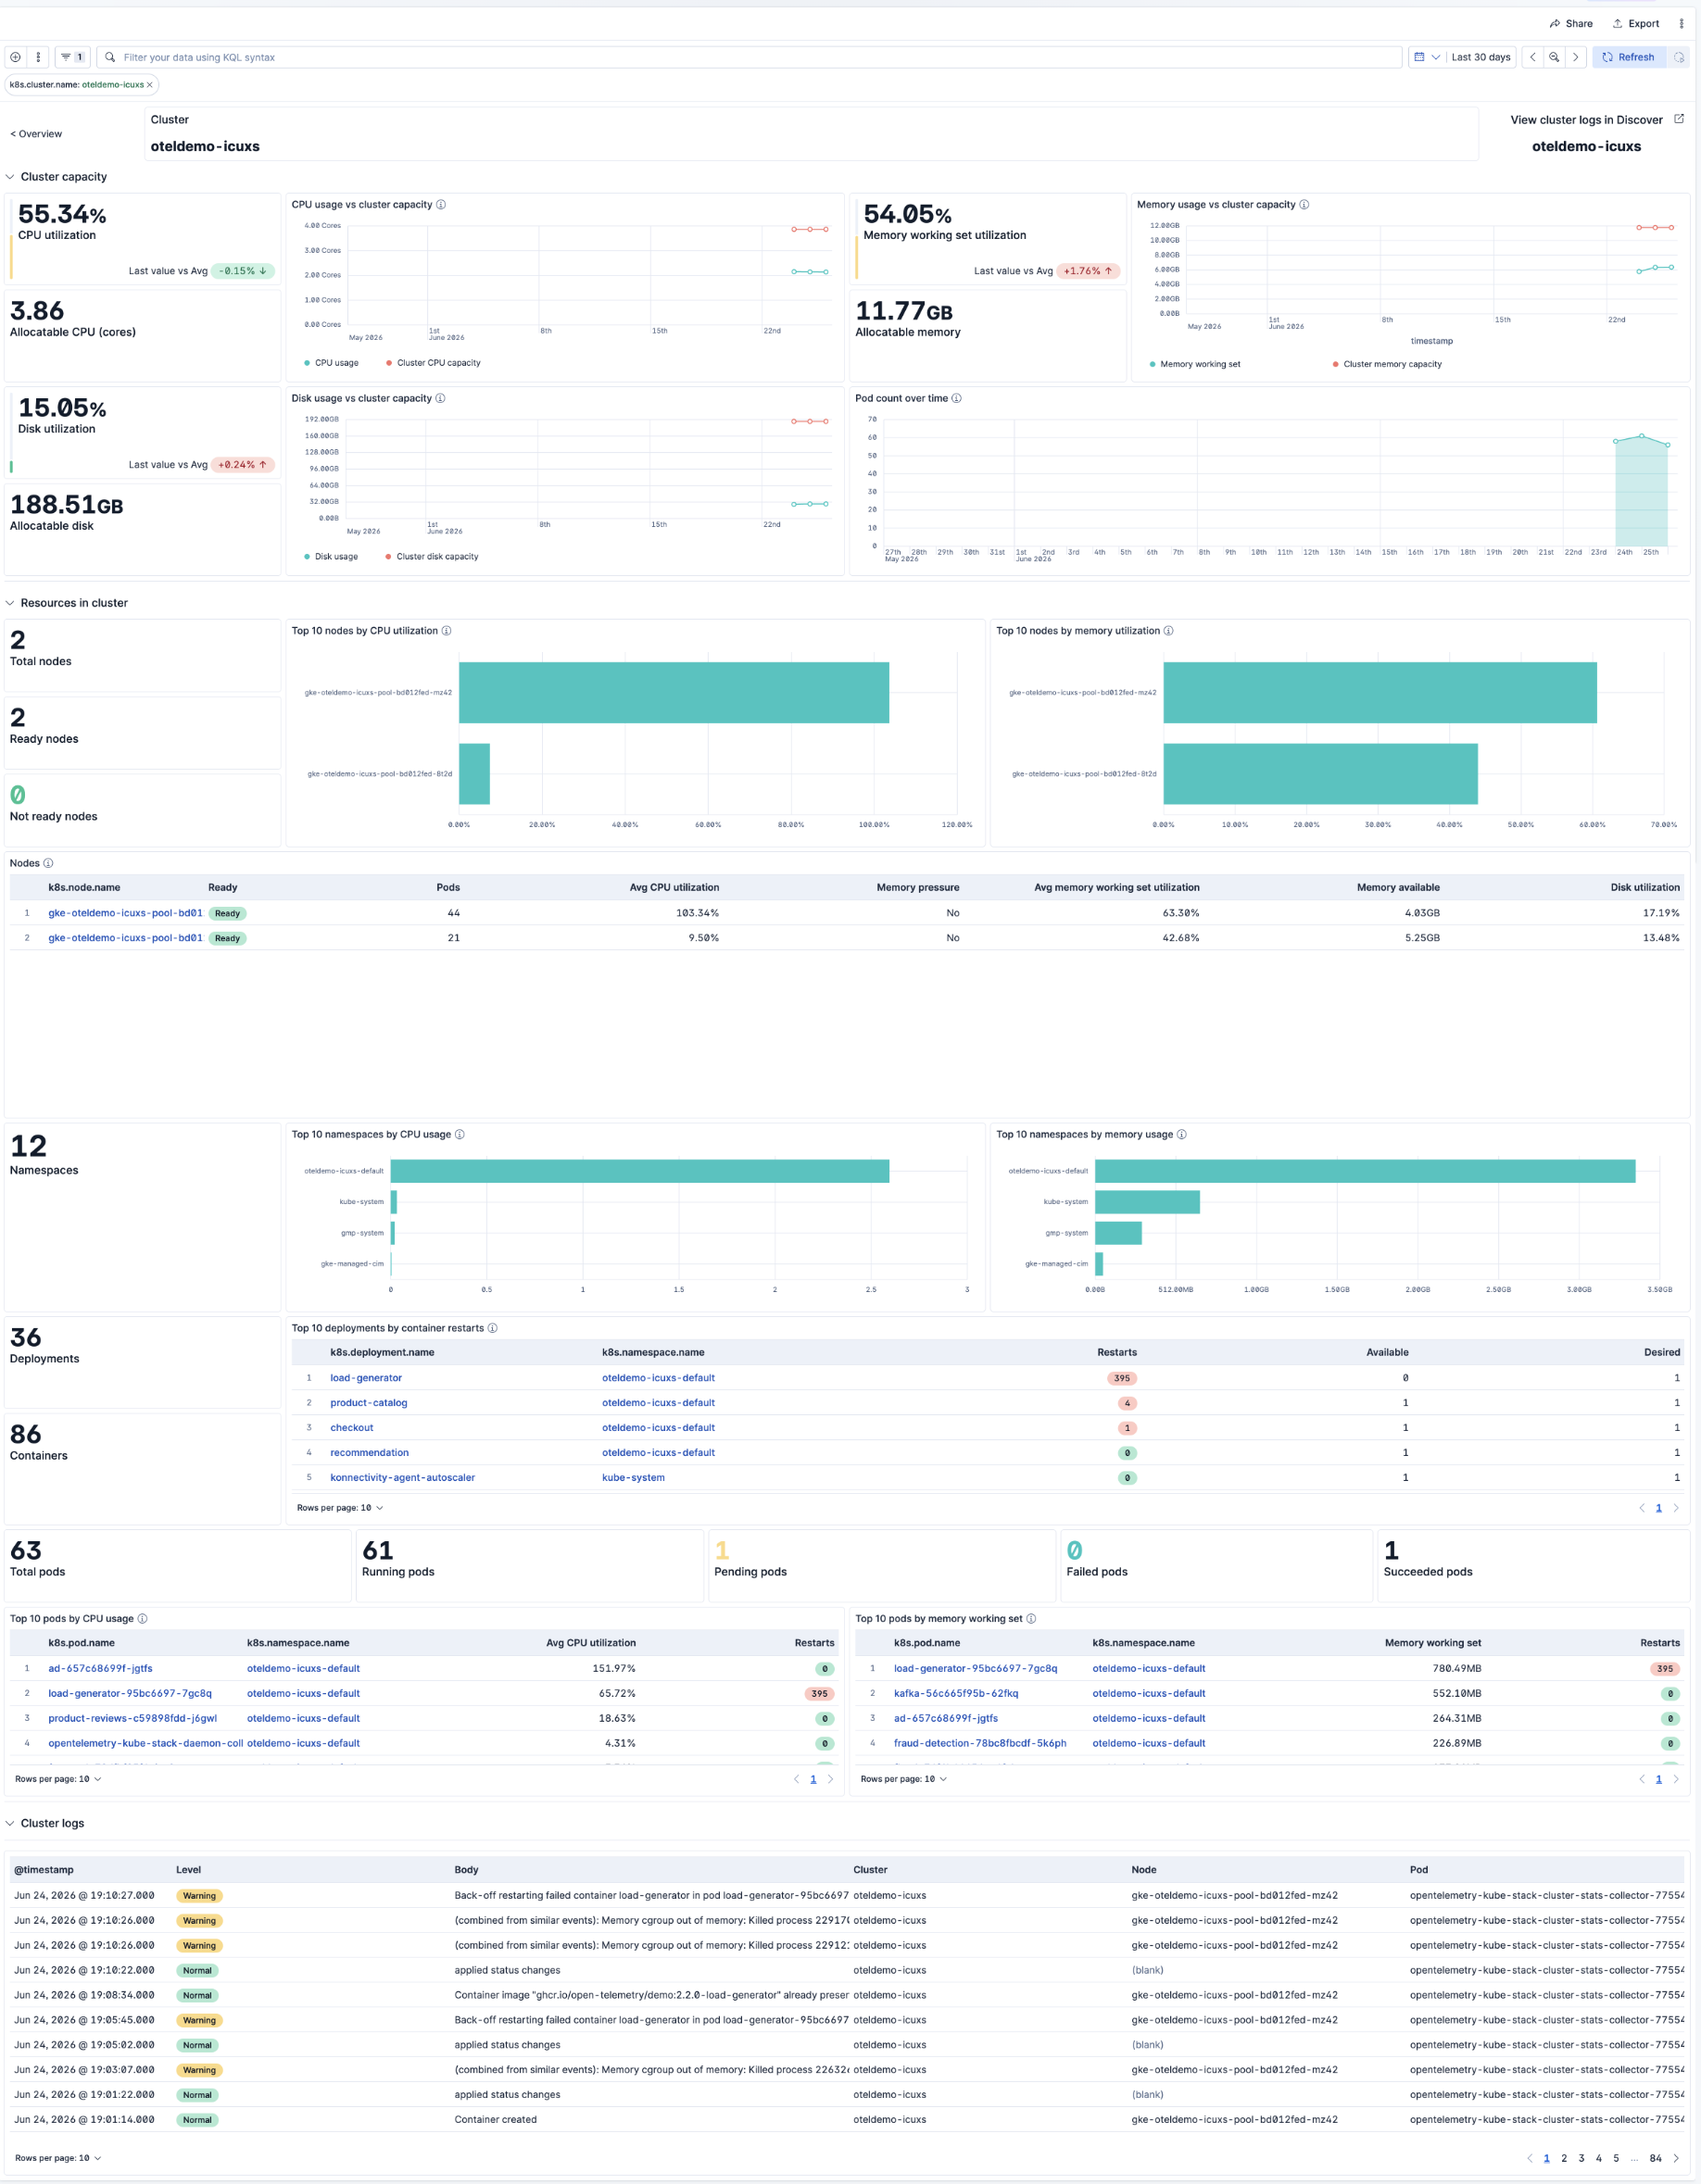
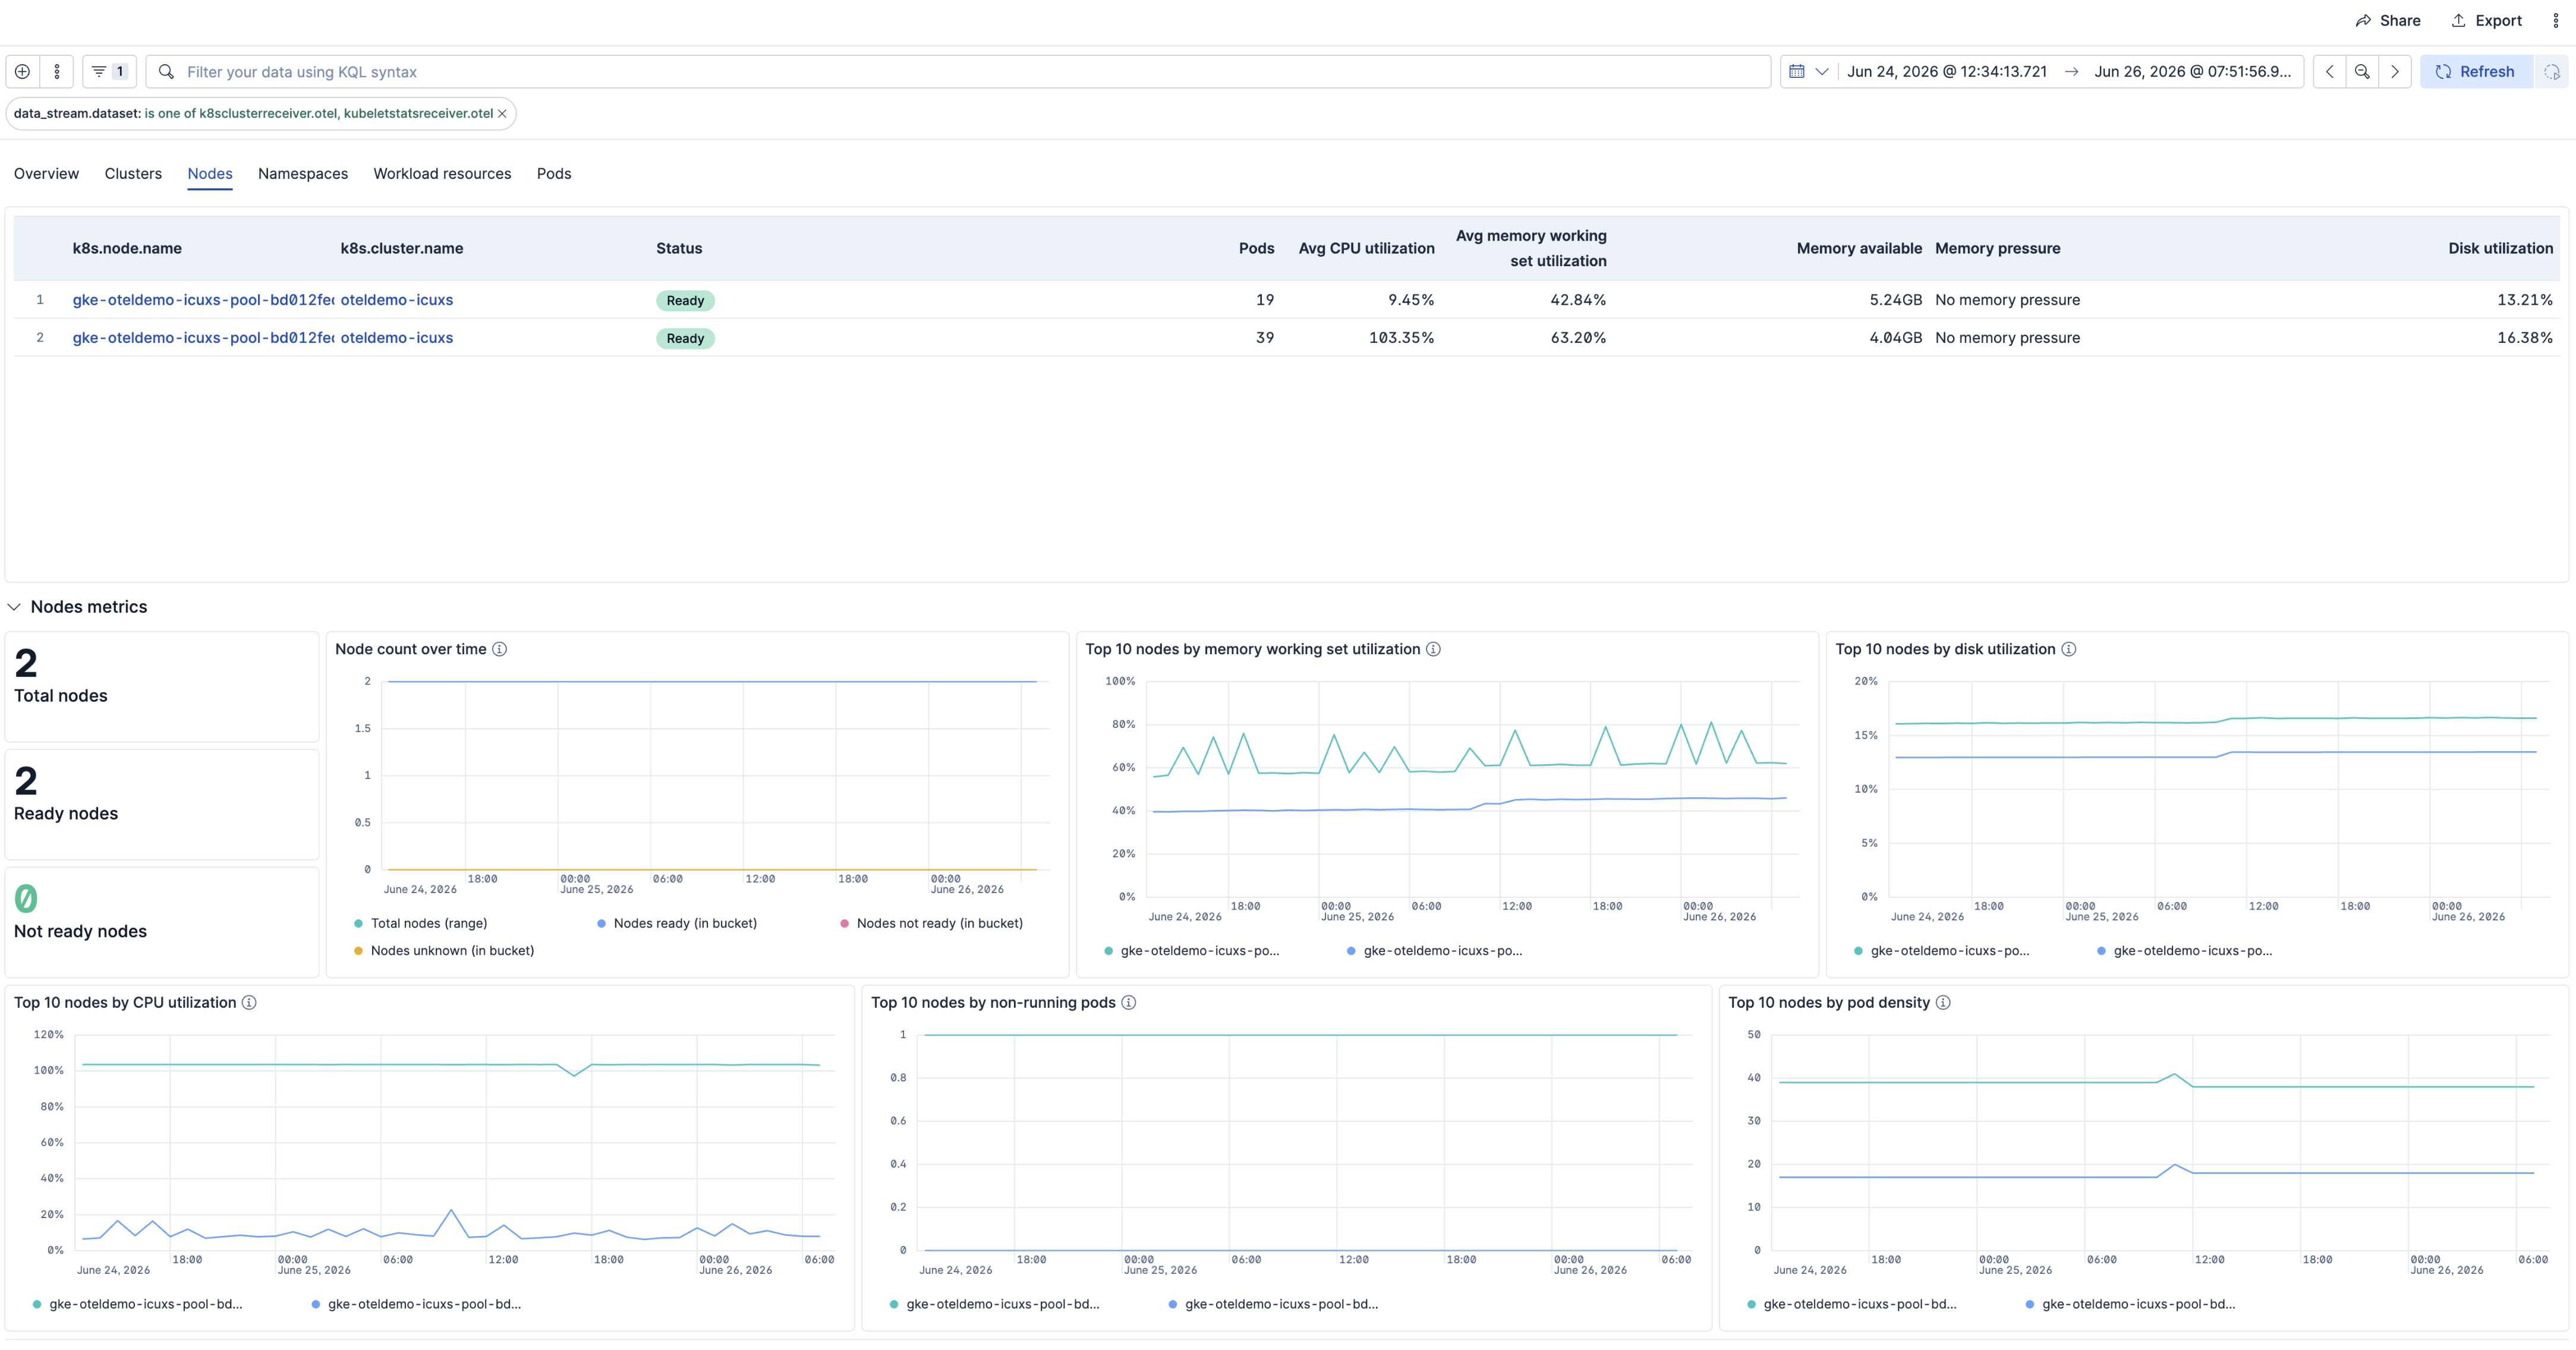
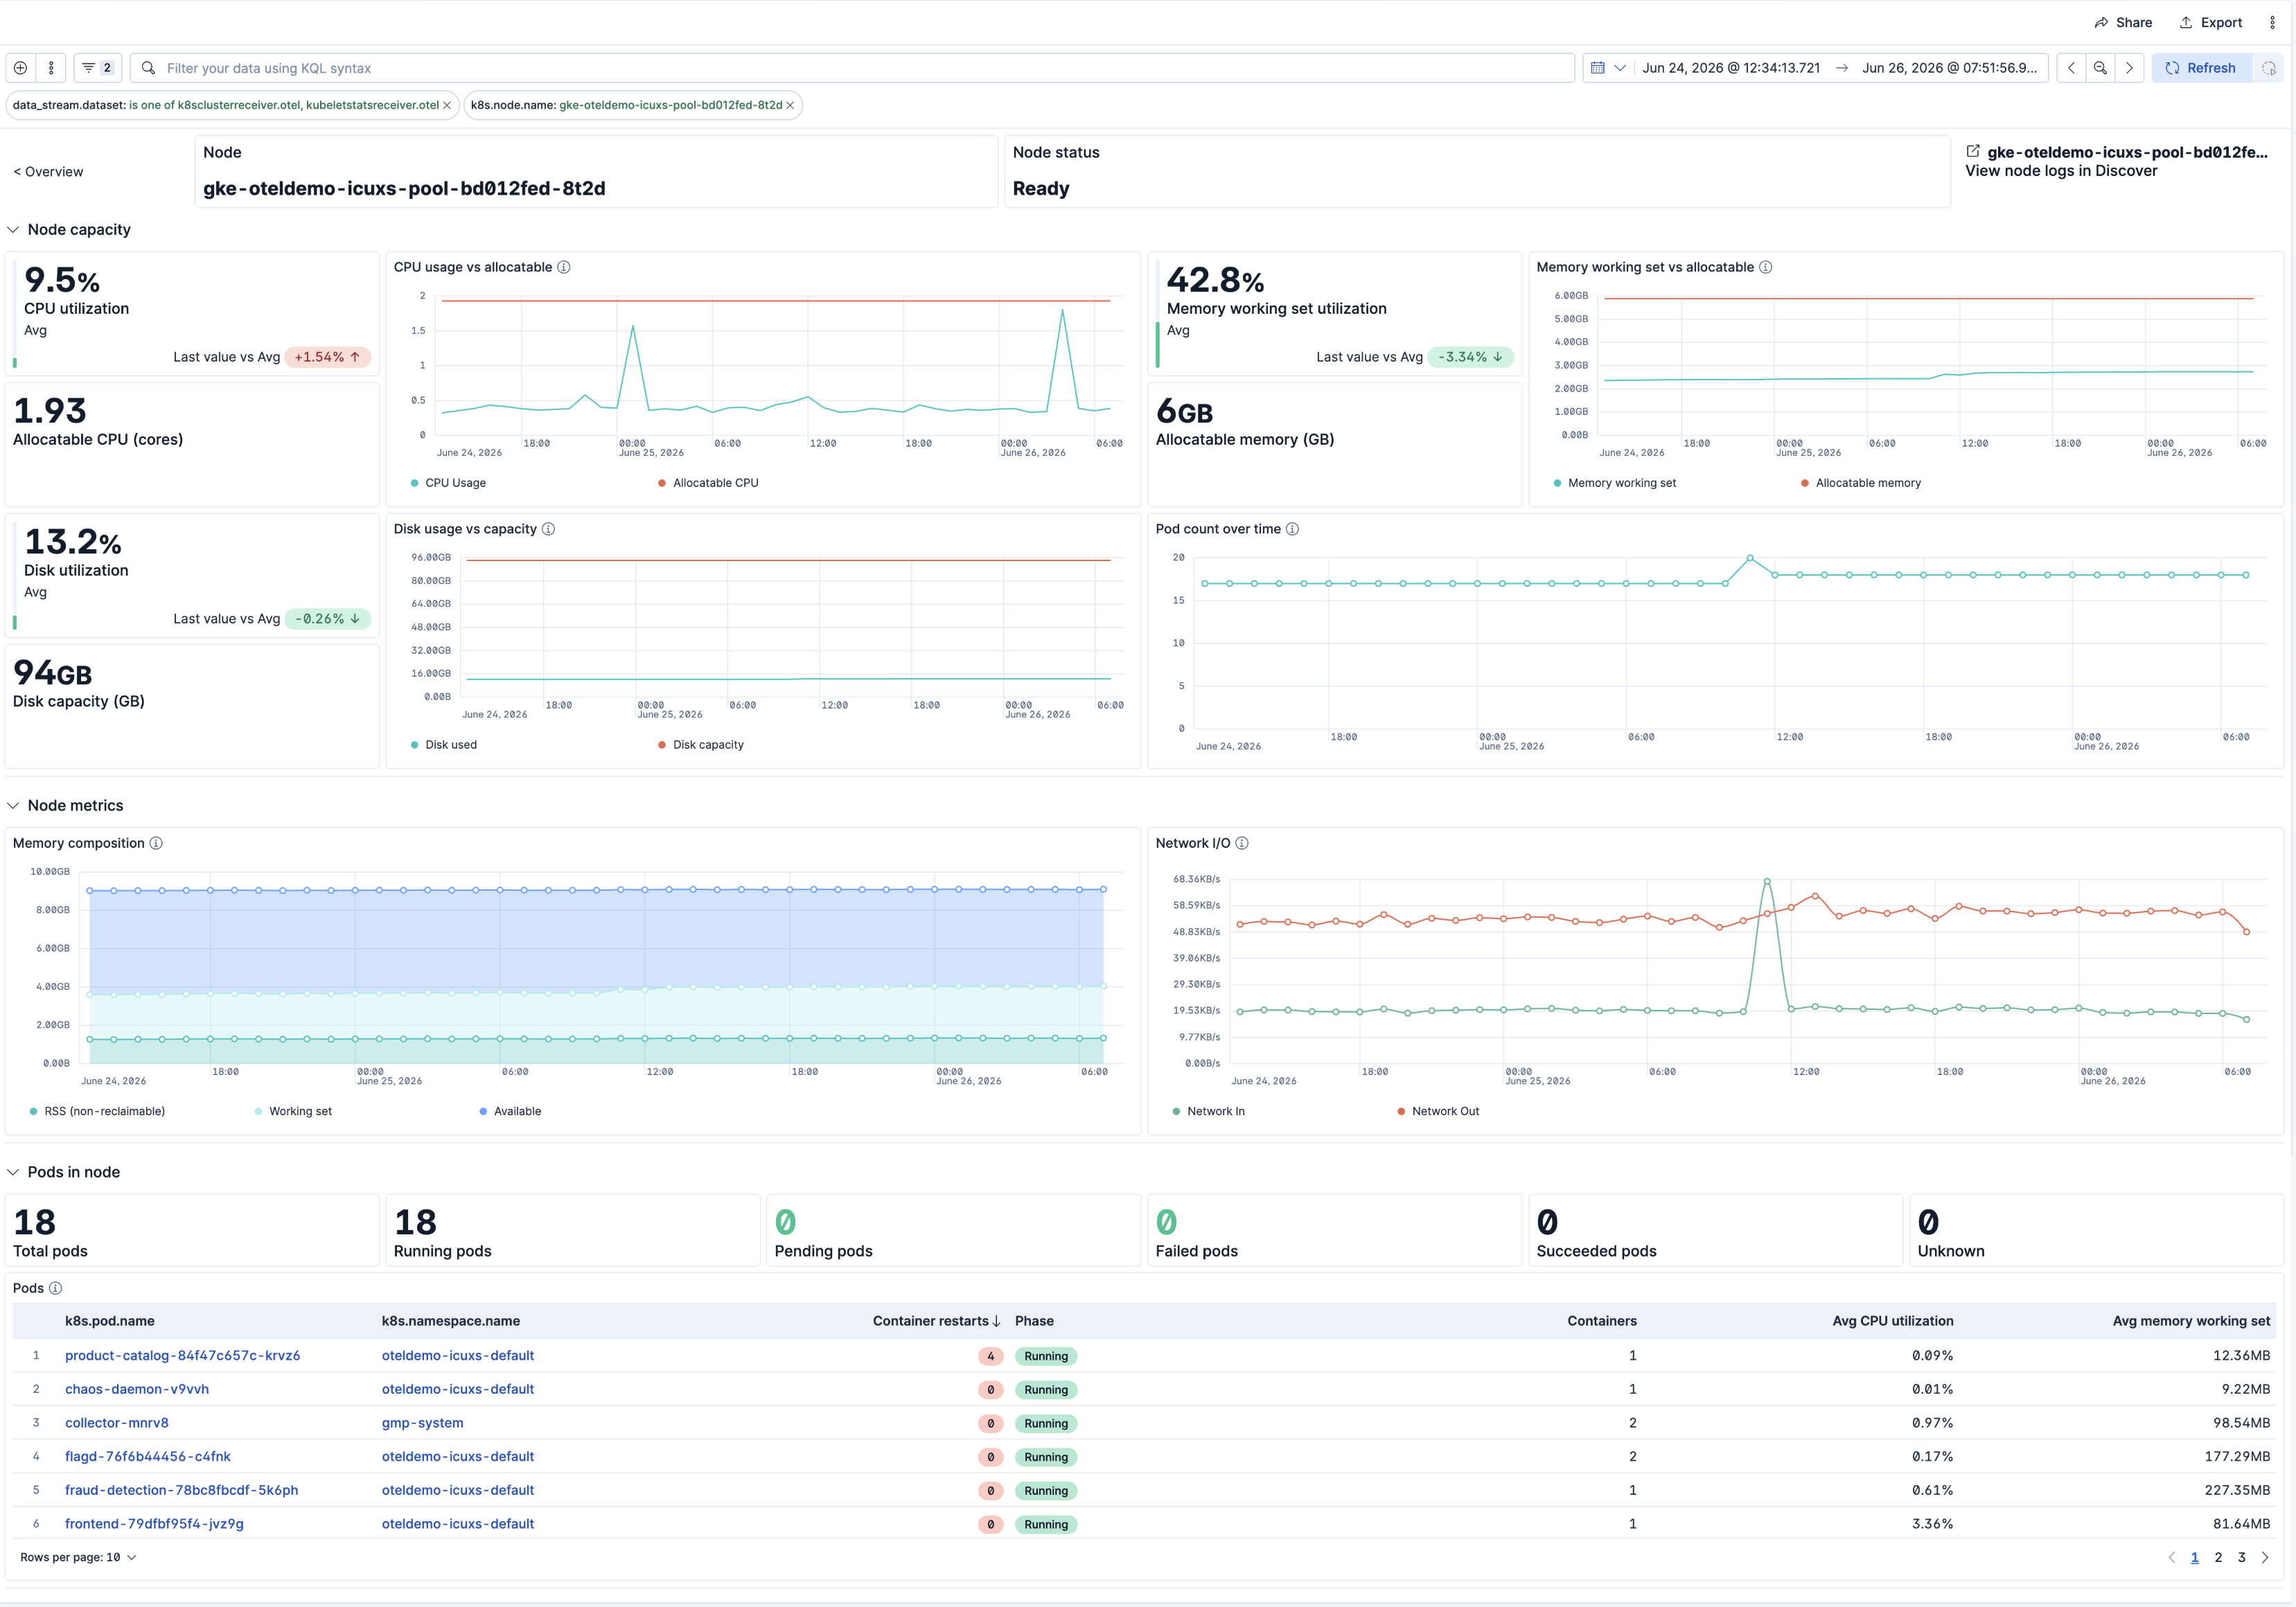
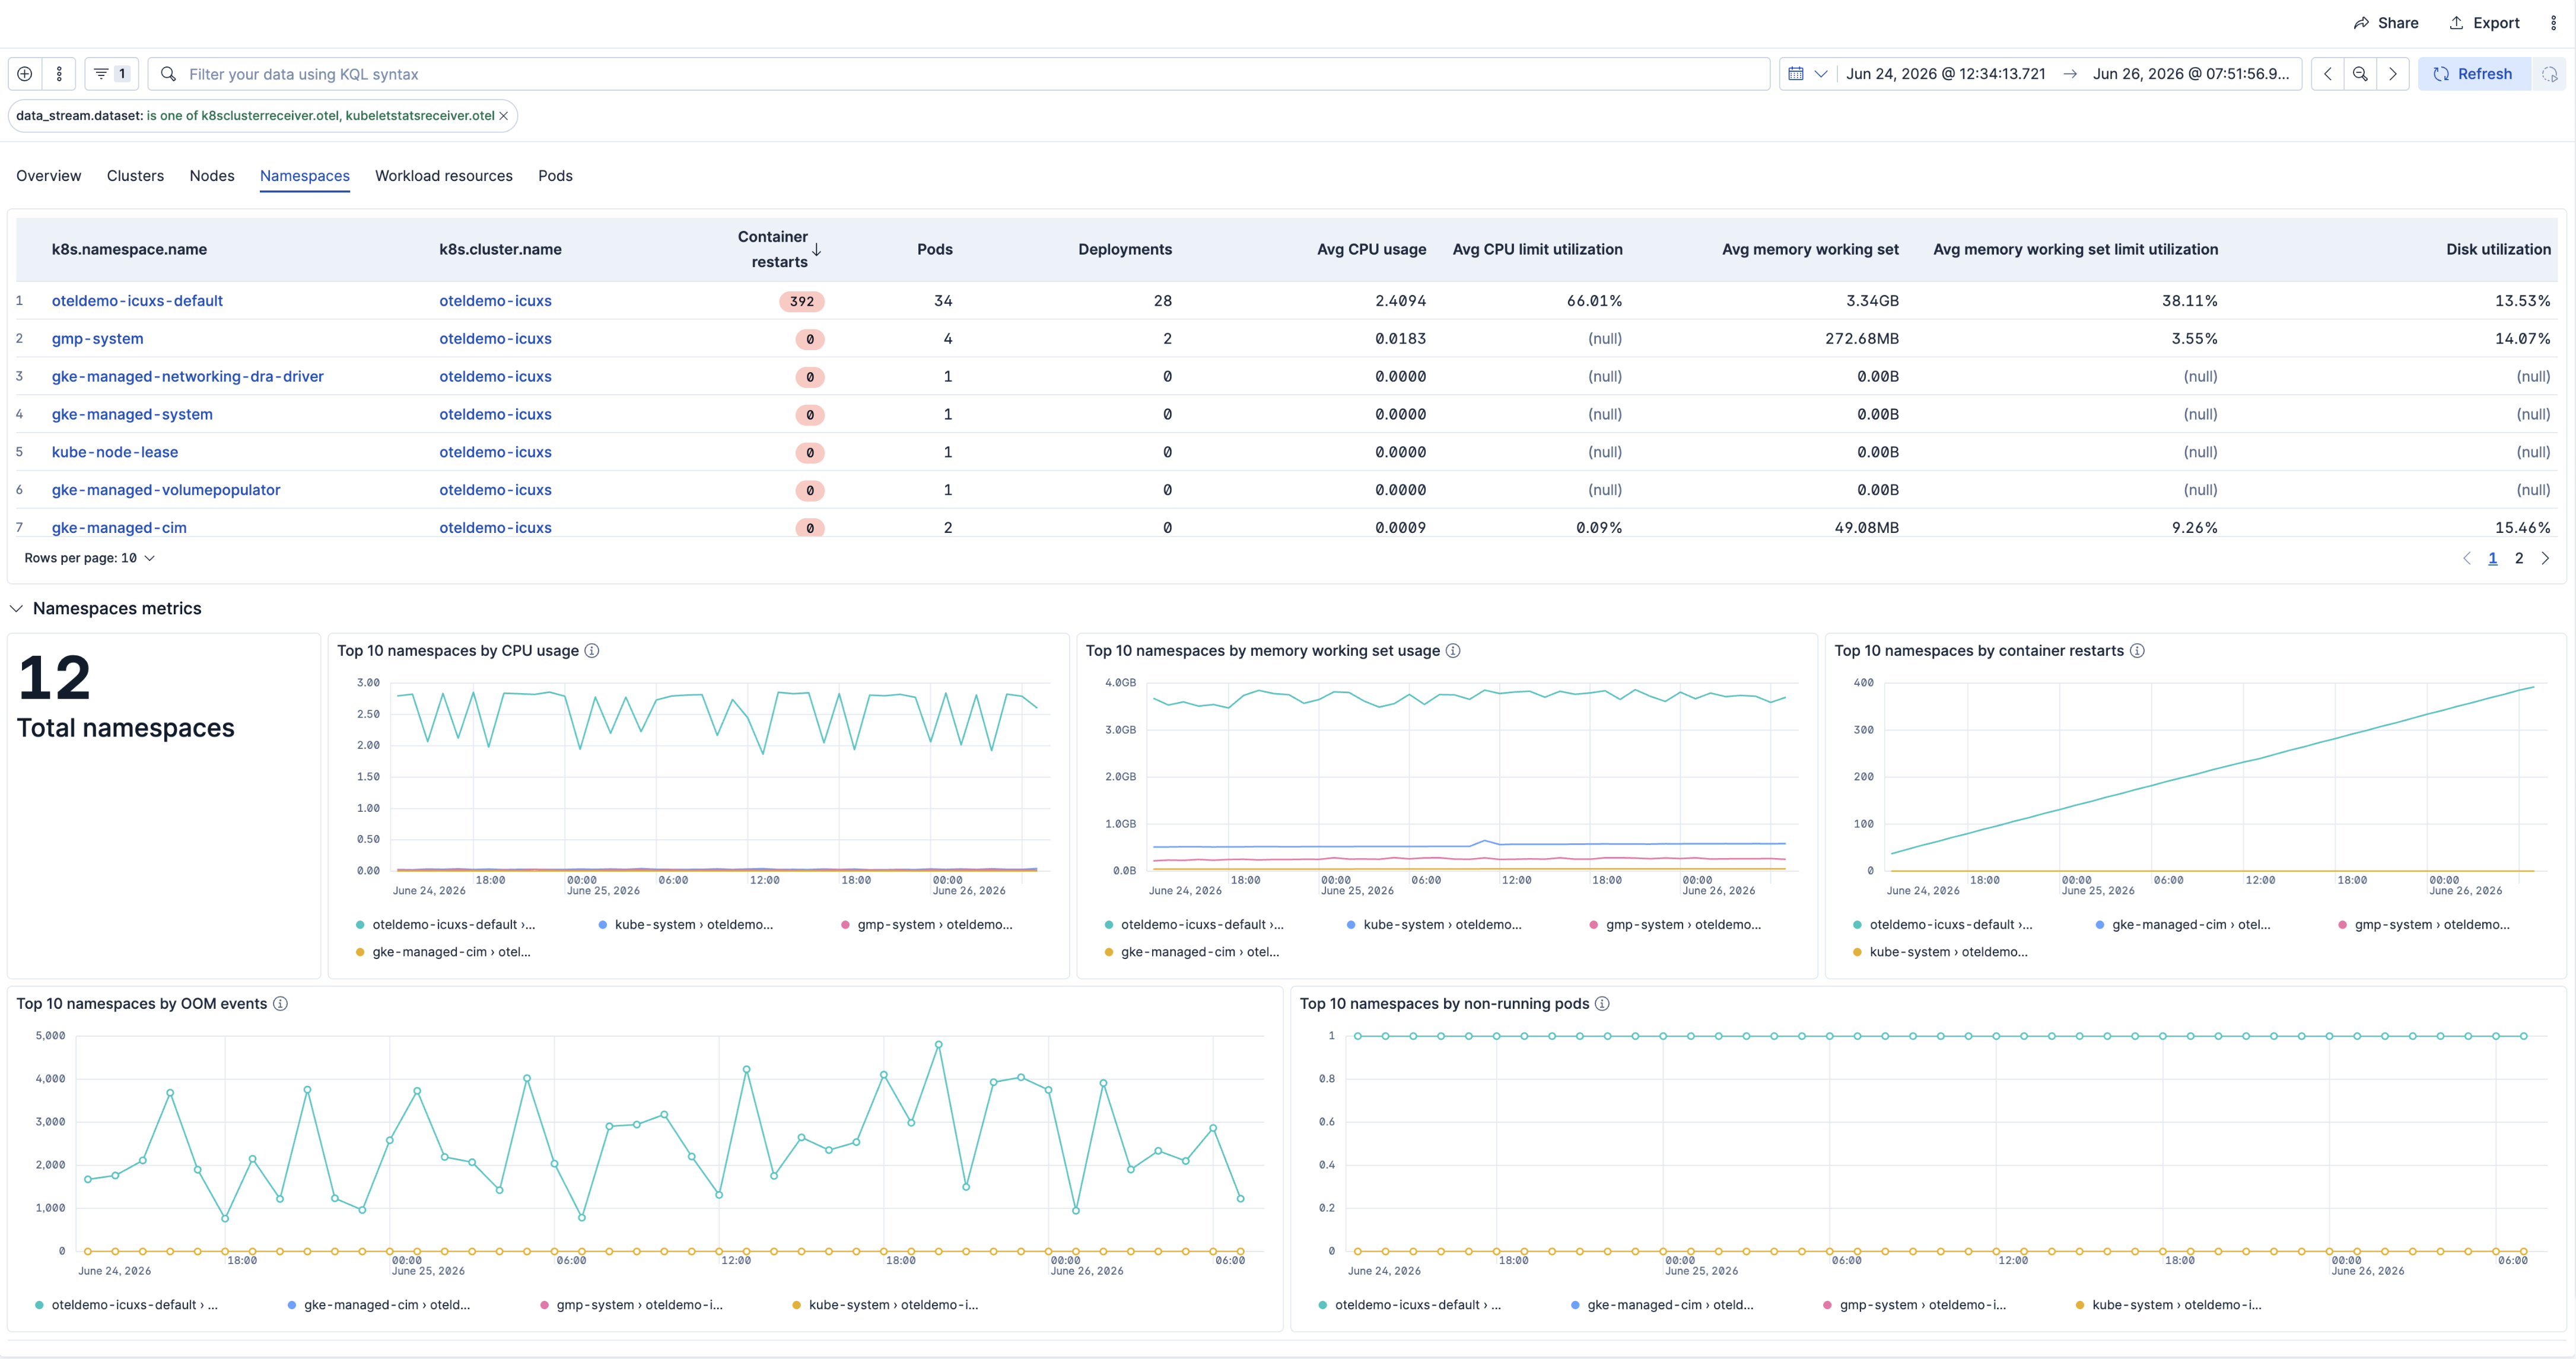
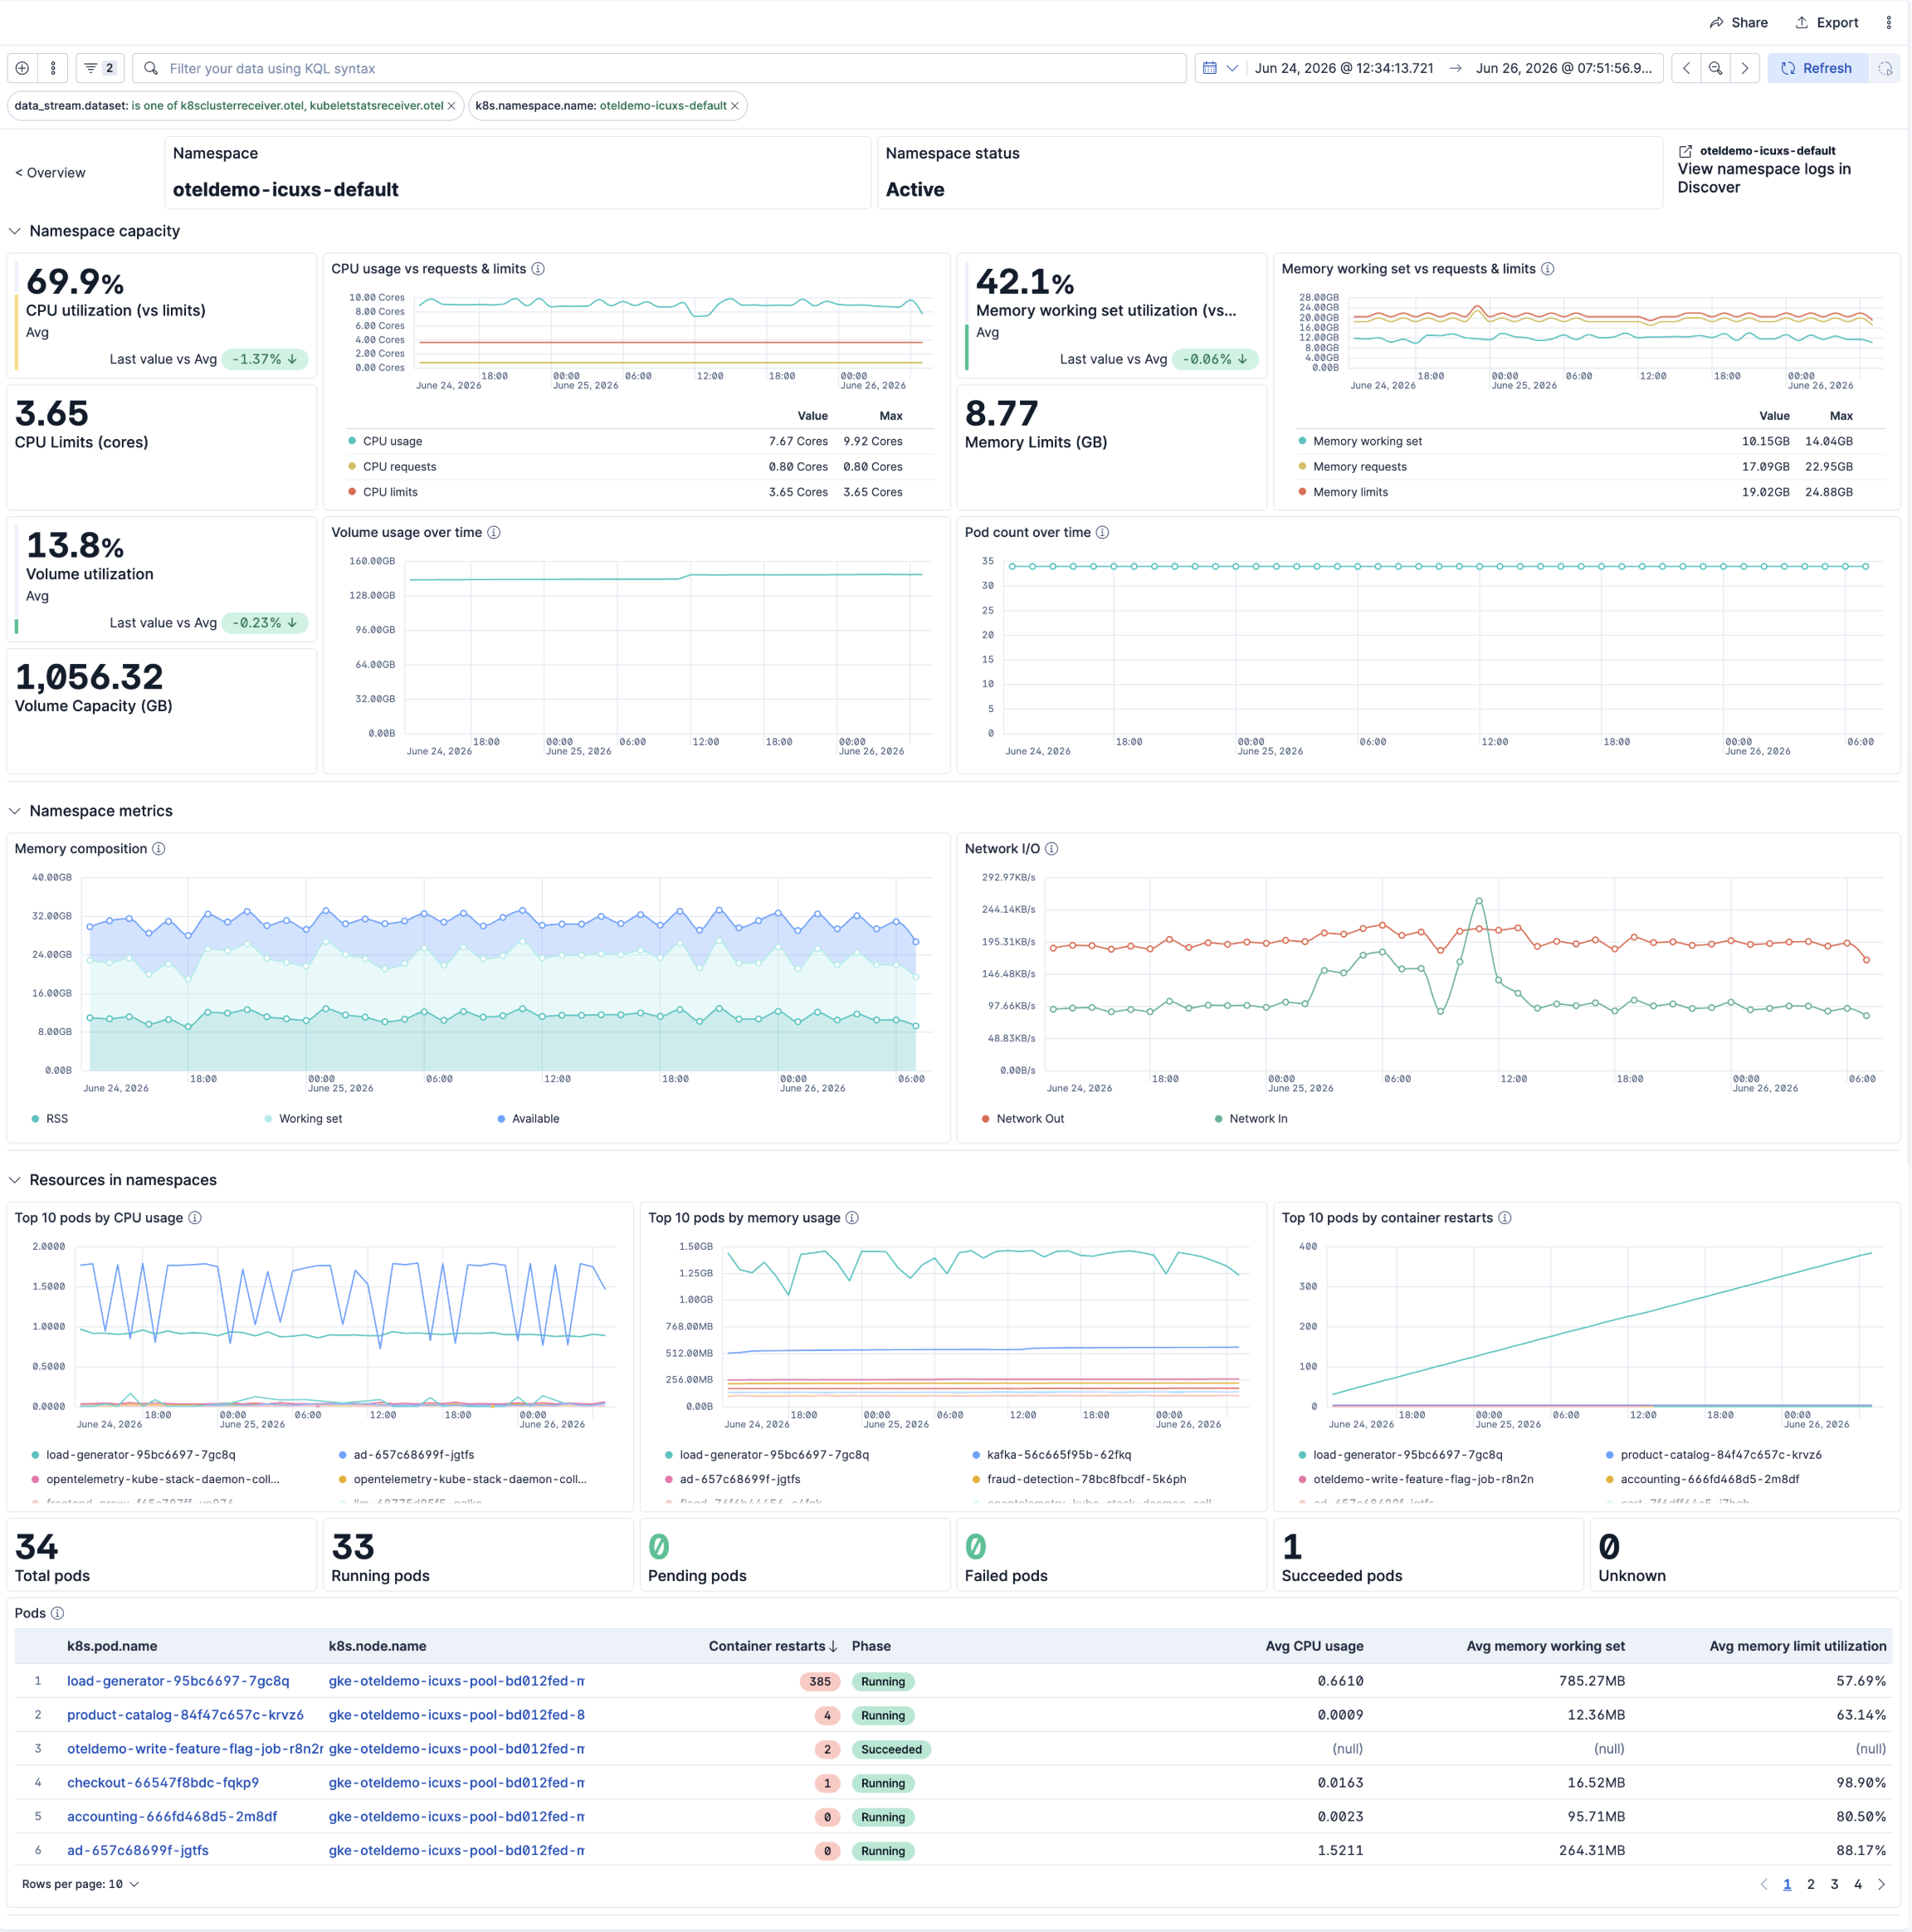
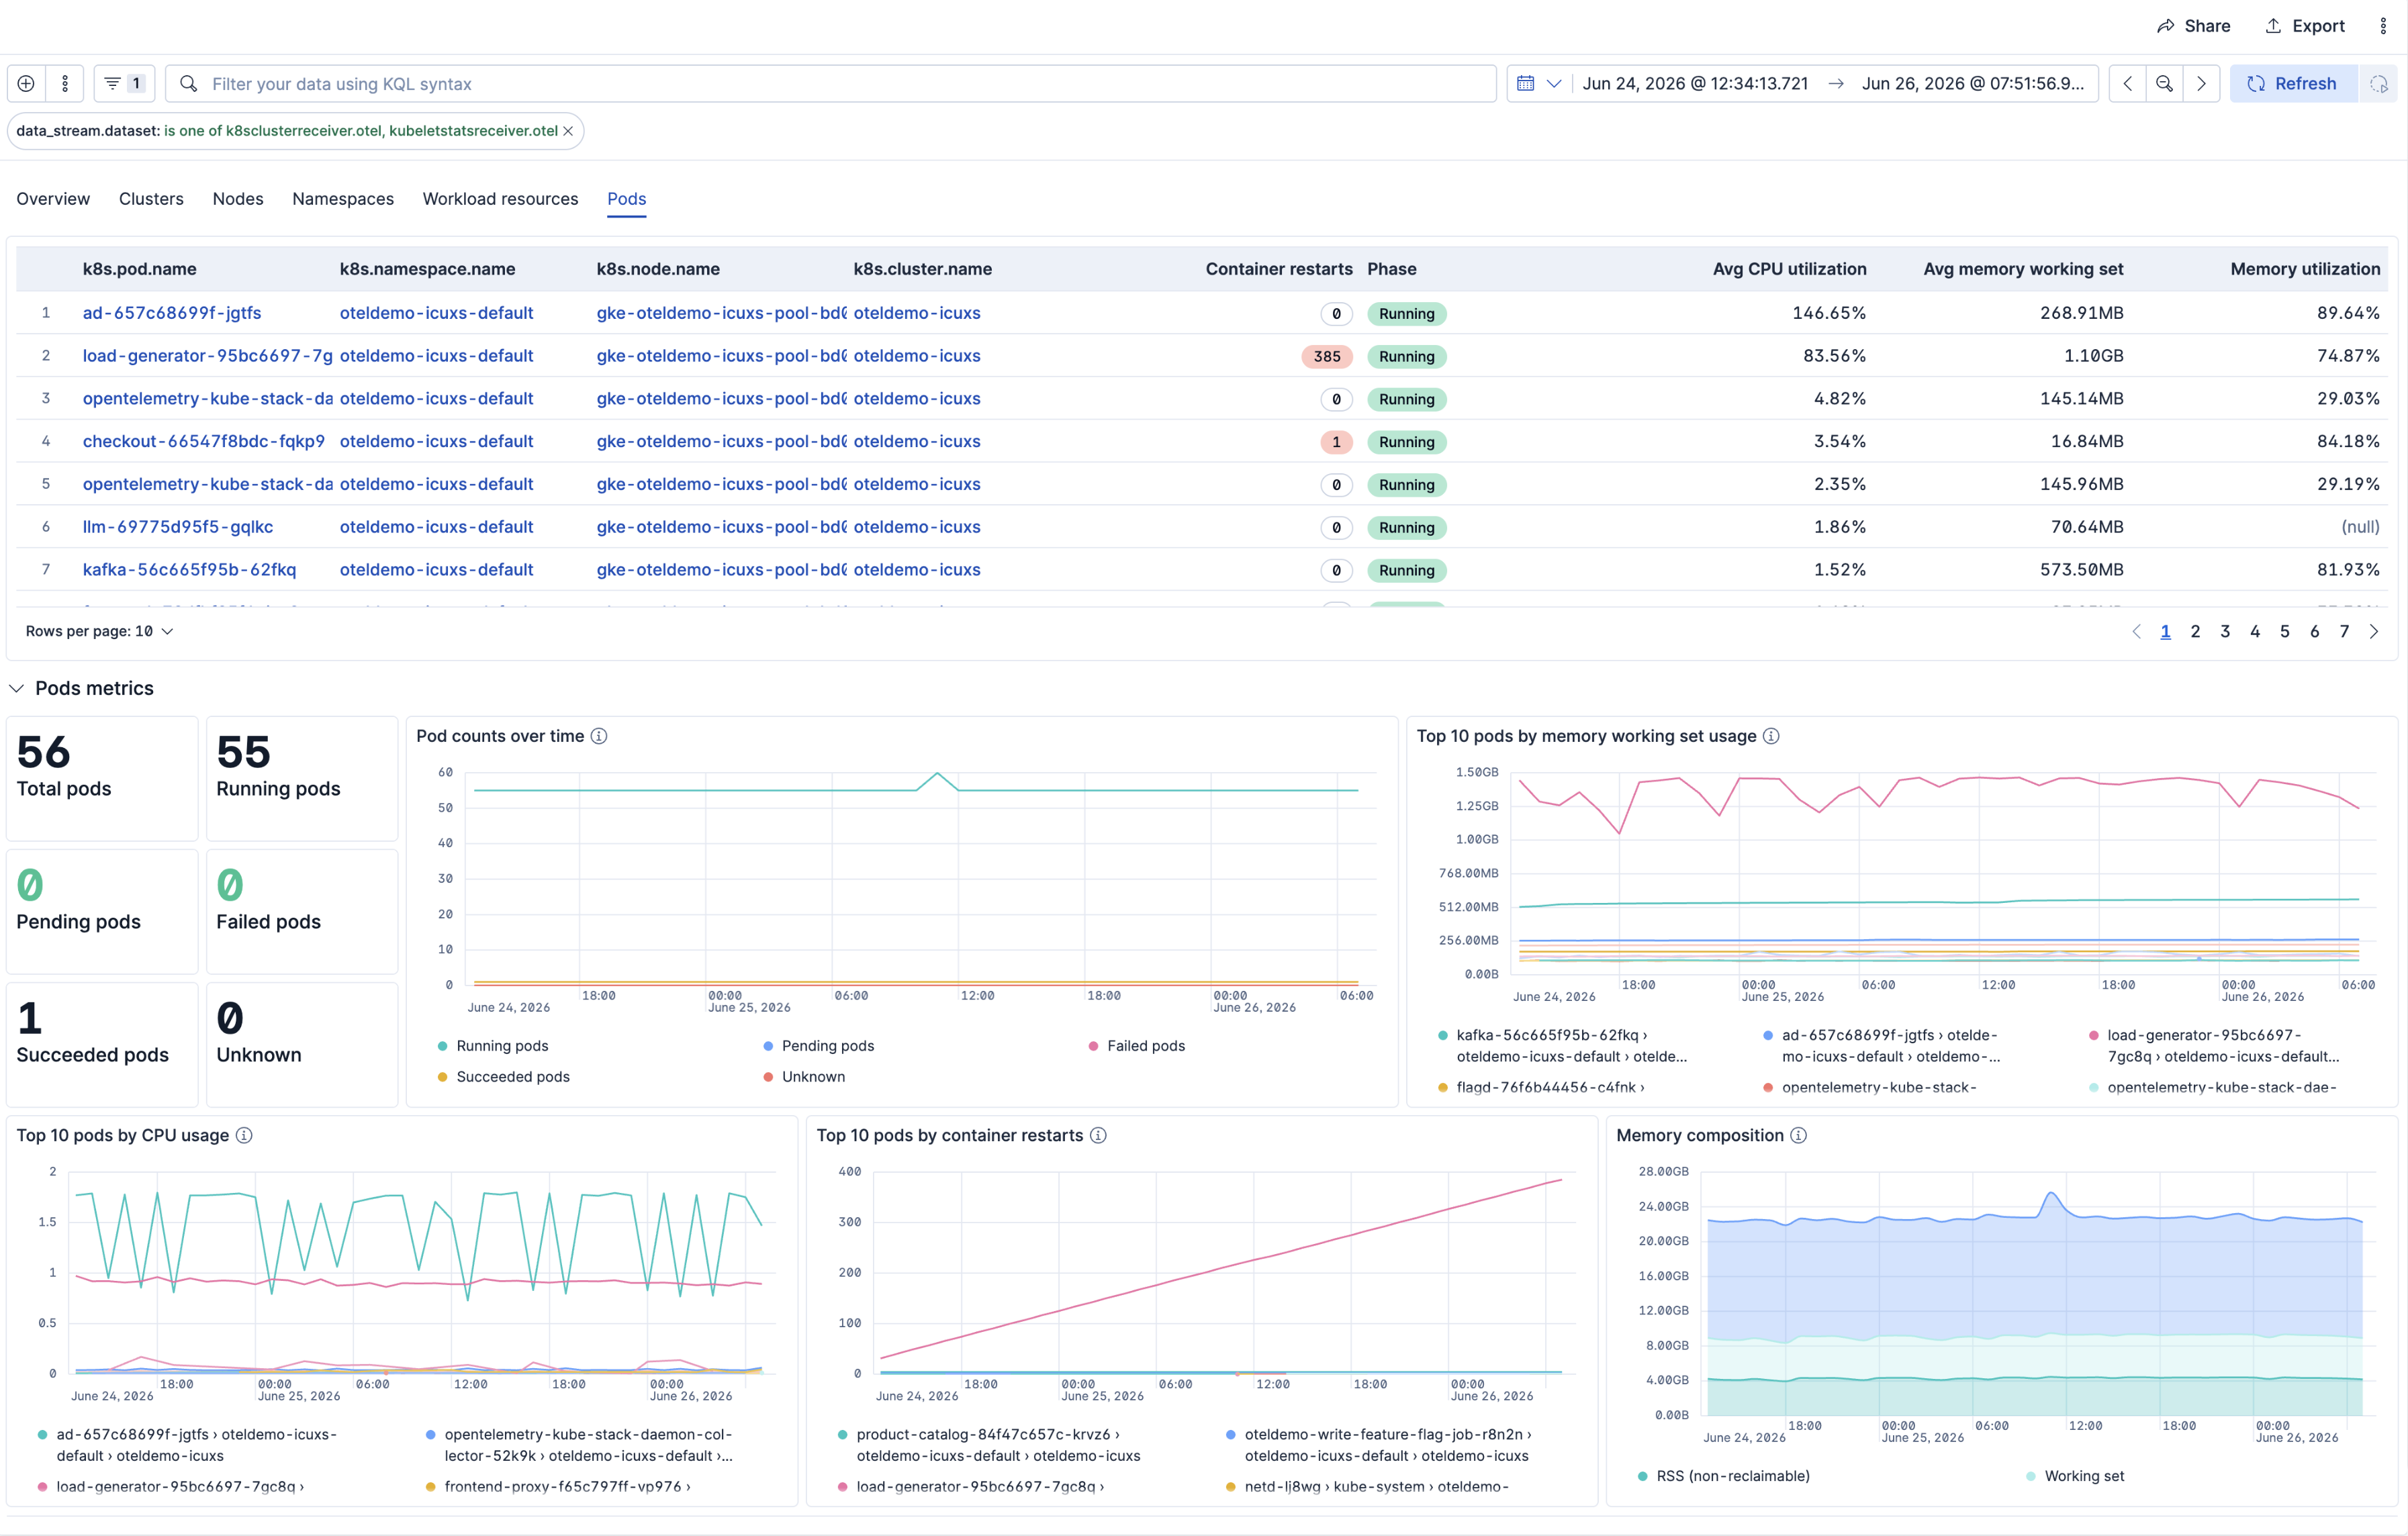
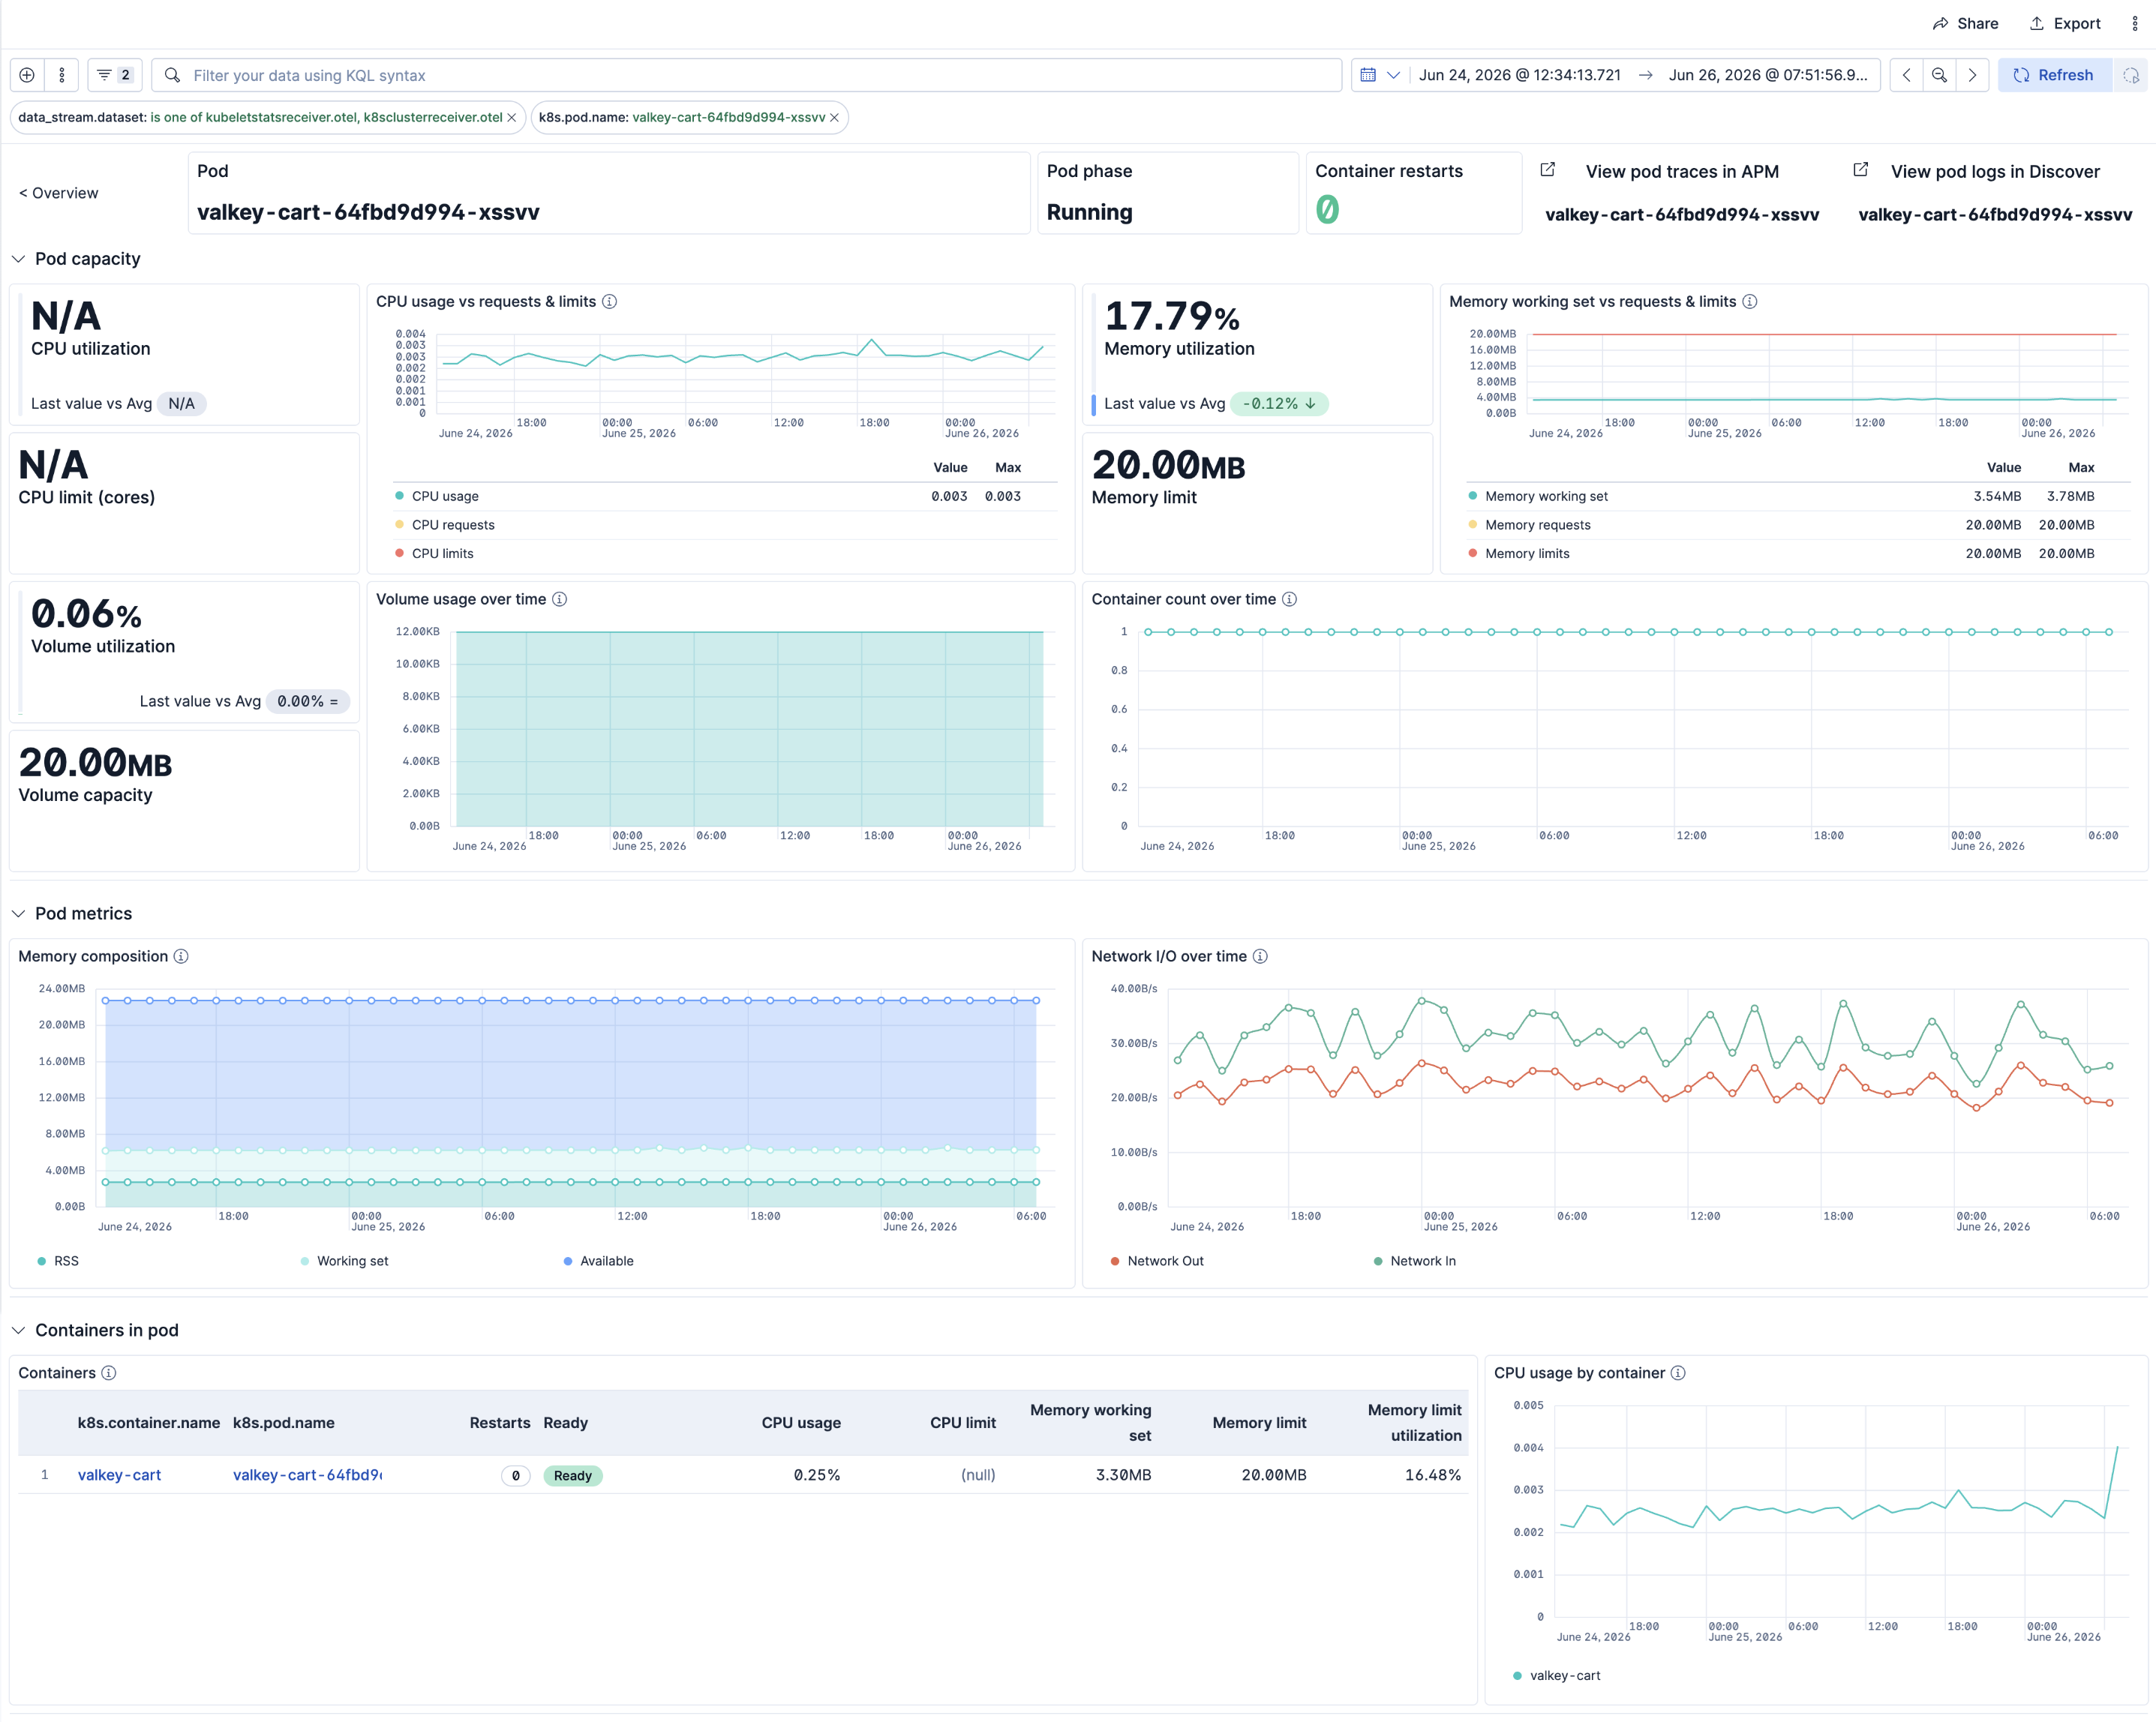
This integration includes one or more Kibana dashboards that visualizes the data collected by the integration. The screenshots below illustrate how the ingested data is displayed.
Changelog
| Version | Details | Minimum Kibana version |
|---|---|---|
| 2.6.1 | Bug fix (View pull request) Fix links panel not rendering in [Kubernetes OTel] Node Detail and [Kubernetes OTel] Namespace Detail dashboards due to unrecognized schema key. |
9.4.0 |
| 2.6.0 | Enhancement (View pull request) Rename the Clusters dashboard to At a glance and drop the brackets from the deprecated Cluster Overview dashboard title |
9.4.0 |
| 2.5.1 | Bug fix (View pull request) Fix k8s.object.name to k8s.pod.name to correct dashboard breakage |
9.4.0 |
| 2.5.0 | Bug fix (View pull request) Replace the deprecated popout icon with external so dashboard navigation cards render correctly. |
9.4.0 |
| 2.4.1 | Bug fix (View pull request) Fix View pod logs in Discover drilldowns to filter on k8s.object.name instead of k8s.pod.name |
9.4.0 |
| 2.4.0 | Enhancement (View pull request) Add tags to Kibana assets |
9.4.0 |
| 2.3.0 | Enhancement (View pull request) Improvements to Kubernetes OTel dashboards. Deprecated the Cluster Overview dashboard. |
9.4.0 |
| 2.2.0-preview3 | Enhancement (View pull request) Improvements to the Node, Node detail and Namespaces dashboards. |
— |
| 2.2.0-preview2 | Enhancement (View pull request) Add ML anomaly detection module for workload memory and Kubernetes Warning events. |
— |
| 2.2.0-preview1 | Enhancement (View pull request) Improvements to the Pod and Pod details dashboards. |
— |
| 2.1.0-preview9 | Enhancement (View pull request) Improvements to the Overview, Workloads, and Deployment details dashboards. |
— |
| 2.1.0-preview8 | Enhancement (View pull request) Improvements to Nodes, Namespaces, Node Detail, and Namespace Detail dashboards |
— |
| 2.1.0-preview7 | Enhancement (View pull request) Updated overview dashboard with OOM events count panel, replacing major page faults panel. Various improvements to the Clusters and Cluster Details dashboards. |
— |
| 2.1.0-preview6 | Enhancement (View pull request) Improvements to the Overview dashboard visualizations |
— |
| 2.1.0-preview5 | Enhancement (View pull request) Improve Nodes, Namespaces, Node Detail, and Namespace Detail dashboard query performance and metric accuracy |
— |
| 2.1.0-preview4 | Enhancement (View pull request) Use standardized asset naming convention |
— |
| 2.1.0-preview3 | Enhancement (View pull request) Improve Namespace detail dashboard |
— |
| 2.1.0-preview2 | Enhancement (View pull request) Use stale-entity filtering on detail dashboard metric panels to preserve visibility of deleted, crashed, and scaled-down resources during drilldown investigation |
— |
| 2.1.0-preview1 | Enhancement (View pull request) Improve overview dashboard |
— |
| 2.0.0-preview9 | Enhancement (View pull request) Fix rule 'groupBy' to use 'row' instead of 'top' for correct grouping in alerting rules |
— |
| 2.0.0-preview8 | Enhancement (View pull request) Add SLO templates |
— |
| 2.0.0-preview7 | Enhancement (View pull request) Add rule templates for k8s health monitoring |
— |
| 2.0.0-preview6 | Enhancement (View pull request) Represent pod phases, node readiness, and container ready states as human-readable strings instead of numeric values in Cluster Details, Deployment Details, and Pod Details dashboards |
— |
| 2.0.0-preview5 | Enhancement (View pull request) Improvements to Cluster, Cluster details, Deployment, Deployment details, Pod, Pod details, Workload details dashboards. |
— |
| 2.0.0-preview4 | Enhancement (View pull request) Improve Node Detail dashboard ESQL queries |
— |
| 2.0.0-preview3 | Enhancement (View pull request) Improve Namespaces dashboard ESQL queries |
— |
| 2.0.0-preview2 | Enhancement (View pull request) Improve Nodes dashboard ESQL queries |
— |
| 2.0.0-preview1 | Enhancement (View pull request) New navigable K8s dashboards |
— |
| 1.4.0 | Enhancement (View pull request) Add dataset filters to dashboard panels |
9.2.0 |
| 1.3.0 | Enhancement (View pull request) Add discovery field to support auto-install |
9.2.0 |
| 1.2.2 | Enhancement (View pull request) Update EDOT quick start url |
9.2.0 8.18.0 |
| 1.2.1 | Enhancement (View pull request) Add opentelemetry category |
9.2.0 8.18.0 |
| 1.2.0 | Enhancement (View pull request) Use k8seventsreceiver data for K8s Events visualisations |
9.2.0 8.18.0 |
| 1.1.1 | Bug fix (View pull request) Update the visualisation filters for ad-hoc fields |
9.0.0 8.18.0 |
| 1.1.0 | Enhancement (View pull request) Add support for Kibana 9.0.0 |
9.0.0 8.18.0 |
| 1.0.0 | Enhancement (View pull request) Making package GA |
8.18.0 |
| 0.0.6 | Enhancement (View pull request) Adding events to overview dashboard |
8.16.0 |
| 0.0.5 | Enhancement (View pull request) Remove events from overview dashboard |
8.16.0 |
| 0.0.4 | Enhancement (View pull request) Update format_spec to target 3.3.0 |
8.16.0 |
| 0.0.3 | Enhancement (View pull request) Add a link to the onboarding flow, fix the package logo |
8.16.0 |
| 0.0.2 | Enhancement (View pull request) Change logo and description of the package, fix overview dashboard |
8.16.0 |
| 0.0.1 | Enhancement (View pull request) Initial draft of the Kubernetes OpenTelemetry Assets package |
8.16.0 |