Fortinet FortiManager Logs Integration for Elastic
Elastic Cloud Serverless projects are autoscaled environments, fully managed by Elastic and available on Elastic Cloud. Availability This functionality is generally available and ready for production usage. Elastic Cloud Serverless projects are autoscaled environments, fully managed by Elastic and available on Elastic Cloud. Availability This functionality is generally available and ready for production usage. The Elastic Stack includes Elastic's core products such as Elasticsearch, Kibana, Logstash, and Beats. Availability This functionality is generally available and ready for production usage. Unless stated otherwise on the page, this functionality is available when your Elastic Stack is deployed on Elastic Cloud Hosted, Elastic Cloud Enterprise, Elastic Cloud on Kubernetes, and self-managed environments. This documentation corresponds to the latest patch available for each minor version. If you're not using the latest patch, check the release notes for changes.
Serverless Observability
Generally available
Serverless Security
Generally available
Stack
9.0+
Generally available since 9.0
| Version | 2.18.1 (View all) |
| Subscription level What's this? |
Basic |
| Developed by What's this? |
Elastic |
| Ingestion method(s) | File, Network Protocol |
| Minimum Kibana version(s) | 9.0.0 8.11.0 |
The Fortinet FortiManager Logs integration for Elastic enables you to collect and analyze logs from Fortinet FortiManager and FortiAnalyzer instances. This integration provides centralized visibility into your network operations and security events, helping you enhance your management and security posture.
This integration facilitates:
- Centralized security monitoring: Aggregate security events and alerts from multiple instances into your Elastic Stack for comprehensive threat detection, incident response, and forensic analysis.
- Compliance and auditing: Collect detailed system, device management, and logging status logs to meet regulatory compliance requirements and perform security audits.
- Operational visibility: Monitor administrative actions, configuration changes, firmware updates, and device management events across the Fortinet Security Fabric to maintain operational awareness and troubleshoot issues.
- Log management and archiving: Centralize logs for long-term storage, enabling historical analysis and ensuring log availability beyond local storage capabilities.
This integration is compatible with Fortinet FortiManager and FortiAnalyzer versions 7.2.2 and expected to work in versions above. It has been specifically tested against version 7.2.2.
As per the log availability, we are only supporting the event subtypes given in above table. For more details, look into Log Reference.
The integration collects logs from your Fortinet devices through several methods. You can configure it to receive syslog data directly over TCP or UDP ports, or use the filestream input to read logs from active files. The integration parses these logs from the syslog format into structured events, covering various subtypes like System Manager (system), Device Manager (devmgr), Object Changes (objcfg), and Firmware Manager (fmwmgr). Once parsed, the Elastic Agent sends the data to your Elastic deployment where you can monitor and analyze it.
The Fortinet FortiManager Logs integration collects log messages pushed using tcp or udp, or read from active log files using the filestream input. The integration parses Syslog-formatted data from the following functional areas:
| FortiManager | FortiAnalyzer |
|---|---|
| System Manager (system) | Log Files (logfile) |
| FortiGuard Service (fgd) | Logging Status (logging) |
| Security Console (scply) | Logging Device (logdev) |
| Firmware Manager (fmwmgr) | Logging Database (logdb) |
| Log Daemon (logd) | FortiAnalyzer System (fazsys) |
| Debug IO Log (iolog) | Reports (report) |
| FortiGate-FortiManager Protocol (fgfm) | |
| Device Manager (devmgr/dvm) | |
| Deployment Manager (dm) | |
| Object Changes (objcfg) | |
| Script Manager (scrmgr) |
Integrating Fortinet FortiManager logs with the Elastic Stack provides you with deep visibility into your network management infrastructure. You can use this integration for the following use cases:
- Audit administrative changes: You'll have a clear record of which administrator changed a configuration object and when, which is essential for troubleshooting and regulatory compliance.
- Monitor deployment health: You can track the success or failure of policy deployments across your entire network, allowing you to catch errors before they affect traffic.
- Troubleshoot device connectivity: By monitoring the
fgfmlogs, you'll quickly identify and resolve issues with managed FortiGate devices losing connection to the FortiManager. - Centralized security logging: You can correlate management events with security events from other parts of your infrastructure within Elastic SIEM to build a complete picture of your security posture.
To get started with the Fortinet FortiManager Logs integration, you'll need the following:
You'll need these Elastic Stack components:
- Elastic Stack version
8.11.0or higher. - An installed and enrolled Elastic Agent on a host machine that's network-accessible from your FortiManager or FortiAnalyzer devices.
- Network connectivity between the Elastic Agent and your Elasticsearch cluster to successfully send collected data.
- Sufficient system resources like CPU, memory, and disk I/O on the host running the Elastic Agent to process and forward the anticipated volume of logs.
You'll need these Fortinet-specific items:
- Administrative access to the FortiManager or FortiAnalyzer device to configure log forwarding settings through both the web-based GUI and the command-line interface (CLI).
- Network connectivity between the FortiManager/FortiAnalyzer device and the Elastic Agent's host. You'll need to allow traffic on the specific syslog port, such as
514or9022(TCP or UDP), in any intervening firewalls. - The Elastic Agent's IP address or fully qualified domain name and the specific TCP or UDP port number it's configured to listen on for incoming syslog messages.
- Elastic Stack version
8.11.0or newer. - An installed and enrolled Elastic Agent running on a host machine that's network-accessible from your FortiManager/FortiAnalyzer devices.
- Network connectivity between the Elastic Agent and your Elasticsearch cluster to successfully send collected data for indexing and analysis.
- Sufficient system resources (CPU, memory, and disk I/O) on the host running the Elastic Agent to process and forward the anticipated volume of logs.
- Appropriate read permissions for the Elastic Agent to access the FortiManager/FortiAnalyzer log files if you use the
filestreaminput method for logs stored locally or on an accessible network-mounted filesystem.
Elastic Agent must be installed on a host that has network access to your Fortinet FortiManager instance or access to its log files. For detailed installation instructions, refer to the Elastic Agent installation guide. You can install only one Elastic Agent per host.
Elastic Agent is required to stream data from the syslog or log file receiver and ship the data to Elastic, where the events will be processed using the integration's ingest pipelines.
This step registers the Elastic Agent as a valid log destination in the FortiManager web interface.
- Log in to the FortiManager web UI using your administrative credentials.
- Navigate to System Settings > Advanced > Syslog Server. In some older versions, this option may be found under System Settings > Syslog Server.
- In the Syslog Server pane, click Create New to add a new syslog server entry.
- Configure the syslog server with the following settings:
- Name: Provide a descriptive name for the server, for example,
elastic-agent-syslog. - IP address (or FQDN): Enter the IP address or fully qualified domain name of the server where the Elastic Agent is running and listening for logs.
- Syslog Server Port: Enter the port number that the Elastic Agent is configured to listen on. The standard default syslog port is
514, but9022is a common alternative. - Reliable Connection:
- To send logs using UDP (the default protocol), leave this option disabled.
- To send logs using TCP, enable this option. This setting must match the protocol you configure in the Elastic Agent integration.
- Optional TLS setup: When you use TCP with Reliable Connection enabled, you can optionally enable Secure Connection to encrypt traffic using TLS/SSL. If you enable this, you'll need to specify a Local Certificate CN and optionally a Peer Certificate CN. This requires corresponding SSL configuration in the Elastic Agent integration's advanced options.
- Name: Provide a descriptive name for the server, for example,
- Click OK to save the configuration.
This step activates the sending of logs to the server you previously configured. This can only be done using the CLI.
- Open the FortiManager CLI console. You can typically access this from the top-right corner of the FortiManager web GUI or using SSH.
- Enter the following commands to configure the local log syslog daemon settings:
Shell config system locallog syslogd setting - Set the syslog server name to the one you created in Part 1 of the GUI steps:
Shell set syslog-name "elastic-agent-syslog" - Set the minimum severity level of logs to be sent. To ensure all relevant logs are forwarded, it's recommended to set this to
information:Shell set severity information - Enable the syslog service to start forwarding logs:
Shell set status enable - Apply the configuration changes:
Shell end - (Optional) You can verify the connection from the FortiManager GUI. Navigate back to System Settings > Advanced > Syslog Server, select your configured server, and click the Test button to send a test message.
For filestream collection, you must configure FortiManager or FortiAnalyzer to store logs locally on the system where the Elastic Agent is running, or on a network-mounted filesystem accessible by the agent. Common log paths can include /var/log/fortinet/fortimanager.log*. Ensure that the Elastic Agent has the necessary file system read permissions to access these log files. For more information, refer to the official Fortinet documentation regarding local log storage and retention.
The following resources provide additional information on configuring FortiManager:
- Syslog Server | FortiManager 7.6.4 | Fortinet Document Library
- Send local logs to syslog server | FortiManager 7.4.5 | Fortinet Document Library
- Technical tip: Configure FortiManager to send logs to a syslog server - Fortinet Community
To set up the integration in Kibana:
- In Kibana, navigate to Management > Integrations.
- Search for "Fortinet FortiManager Logs" and select the integration.
- Click Add Fortinet FortiManager Logs.
- Configure the integration by selecting an input type and providing the necessary settings. This integration supports
TCP,UDP, andFilestream(Log file) inputs.
Choose the setup instructions below that match your configuration.
Use this input if the Elastic Agent has direct access to FortiManager log files.
| Setting | Description |
|---|---|
| Paths | A list of glob-based paths to monitor (for example, /var/log/fortinet/fortimanager.log*). |
| Timezone Offset | Specify an IANA timezone or offset (for example, Europe/Amsterdam or -05:00) for logs with no timezone information. Default is local. |
| Preserve original event | If checked, a raw copy of the original log is stored in the event.original field. |
Under Advanced Options, you can configure the following optional parameters:
- Tags: Custom tags to add to the events (defaults to
forwarded,fortinet_fortimanager-log). - Processors: Add custom processors to enhance or reduce event fields before parsing.
Use this input to collect logs over a TCP socket.
| Setting | Description |
|---|---|
| Listen Address | The bind address for the TCP listener (for example, localhost or 0.0.0.0). |
| Listen Port | The TCP port number to listen on (for example, 9022). |
| Preserve original event | If checked, a raw copy of the original log is stored in the event.original field. |
Under Advanced Options, you can configure the following optional parameters:
- Custom TCP Options: Configure framing, message size, and connections.
- SSL Configuration: Configure SSL options for encrypted communication. See SSL configuration documentation for details. You can configure certificate authorities and other SSL/TLS settings to secure the connection between FortiManager and the Elastic Agent.
- Processors: Add custom processors to enhance or reduce event fields before parsing.
Use this input to collect logs over a UDP socket.
| Setting | Description |
|---|---|
| Listen Address | The bind address for the UDP listener (for example, localhost or 0.0.0.0). |
| Listen Port | The UDP port number to listen on (for example, 9022). |
| Preserve original event | If checked, a raw copy of the original log is stored in the event.original field. |
Under Advanced Options, you can configure the following optional parameters:
- Custom UDP Options: Configure max message size and timeout.
- Processors: Add custom processors to enhance or reduce event fields before parsing.
After configuring the input, assign the integration to an agent policy and click Save and continue.
To verify the integration is working correctly:
- Check the status of the Elastic Agent in Kibana. Navigate to Management > Fleet > Agents and ensure the agent assigned to the FortiManager policy is "Healthy" and "Online".
- Trigger data flow on the FortiManager device by performing one of the following actions:
- Generate a configuration event: Make a minor change in the GUI (for example, adding a comment) and save it.
- Trigger a system event: Run a command like
diagnose sys topin the CLI. - Authentication: Log out and log back in to the web GUI.
- Navigate to Analytics > Discover in Kibana.
- Enter the following KQL filter in the search bar:
data_stream.dataset : "fortinet_fortimanager.log" - Verify that logs appear in the results. Expand an entry and confirm the following fields are populated:
event.dataset(should befortinet_fortimanager.log)source.ip(IP address of the FortiManager device)fortimanager.log.type(for example,eventortraffic)fortimanager.log.subtype(for example,system,objcfg, ordevmgr)message(containing the raw log payload)
- Navigate to Analytics > Dashboards and search for "Fortinet FortiManager" to view the pre-built dashboards.
For help with Elastic ingest tools, check the common problems documentation.
You can resolve most integration issues by checking these common scenarios:
- No logs received by Elastic Agent: Verify that the
IP address (or FQDN)andSyslog Server Portsettings in the FortiManager GUI match theListen AddressandListen Portconfigured in the integration. Check for network firewalls blocking ports like514or9022. Usenetstat -tulnp | grep <port>on the host to confirm the agent is actively listening. - Incorrect protocol configuration: Check the
Reliable Connectionoption in the FortiManager Syslog Server settings. This option must be enabled when using thetcpinput and disabled when using theudpinput. - Log forwarding not enabled or severity too low: Check the CLI configuration using the
config system locallog syslogd settingcommand. Ensure thatset status enableis active andset severity information(or another appropriate level) is set to capture the necessary logs. - Filestream input permission issues: If you use the
filestreaminput, ensure the Elastic Agent process has the required read permissions for the log file paths, such as/var/log/fortinet/fortimanager.log*. - Parsing failures or incomplete events: Check for the presence of
error.messagefields in Kibana. Examine theevent.originalfield for the raw log content to identify formatting issues. If logs appear truncated, increase themax_message_sizein theCustom TCP OptionsorCustom UDP Optionsconfiguration. - Missing or incorrect fields: Verify the
preserve_duplicate_custom_fieldssetting in the integration configuration and ensure the source device is sending all expected log details.
For more information on architectures that you can use for scaling this integration, check the Ingest Architectures documentation.
To ensure you get optimal performance in high-volume environments, consider the following:
- Transport and collection considerations: When you're collecting logs using syslog, choosing between
tcpandudpis crucial.tcpoffers reliable, ordered delivery, which is ideal for critical security logs where data integrity is paramount, though it might introduce slightly more overhead.udpprovides faster, connectionless delivery, making it suitable for high-volume, less critical logs where some occasional packet loss is acceptable. Forfilestream, ensure the Elastic Agent has efficient access to log file paths and proper handling of log rotations so you don't encounter data gaps or performance bottlenecks. - Data volume management: To optimize the performance of both the FortiManager or FortiAnalyzer and the Elastic Stack, configure your source device to filter or limit the types and severity of logs forwarded to the Elastic Agent. Only forward logs essential for your security monitoring, compliance, or operational analysis needs. While setting the minimum severity to
informationensures comprehensive logging, you can adjust it towarningorerrorif data volume becomes unmanageably high. - Elastic Agent scaling: A single Elastic Agent can handle a significant volume of logs, but for high-throughput environments, you'll want to consider deploying multiple Elastic Agents. Each agent can be configured to listen on a dedicated port or monitor specific subsets of log files, which distributes the ingestion load. Ensure your agents are adequately resourced with CPU, memory, and disk I/O, and are placed strategically (for example, on the same network segment) to minimize network latency to the FortiManager or FortiAnalyzer devices.
These inputs can be used with this integration:
filestream
For more details about the Filestream input settings, check the Filebeat documentation.
To collect logs via Filestream, select Collect logs via Filestream and configure the following parameters:
- Filestream paths: The full path to the related log file.
tcp
For more details about the TCP input settings, check the Filebeat documentation.
To collect logs via TCP, select Collect logs via TCP and configure the following parameters:
Required Settings:
- Host
- Port
Common Optional Settings:
- Max Message Size - Maximum size of incoming messages
- Max Connections - Maximum number of concurrent connections
- Timeout - How long to wait for data before closing idle connections
- Line Delimiter - Character(s) that separate log messages
To enable encrypted connections, configure the following SSL settings:
SSL Settings:
- Enable SSL - Toggle to enable SSL/TLS encryption
- Certificate - Path to the SSL certificate file (
.crtor.pem) - Certificate Key - Path to the private key file (
.key) - Certificate Authorities - Path to CA certificate file for client certificate validation (optional)
- Client Authentication - Require client certificates (
none,optional, orrequired) - Supported Protocols - TLS versions to support (e.g.,
TLSv1.2,TLSv1.3)
Example SSL Configuration:
ssl.enabled: true
ssl.certificate: "/path/to/server.crt"
ssl.key: "/path/to/server.key"
ssl.certificate_authorities: ["/path/to/ca.crt"]
ssl.client_authentication: "optional"
udp
For more details about the UDP input settings, check the Filebeat documentation.
To collect logs via UDP, select Collect logs via UDP and configure the following parameters:
Required Settings:
- Host
- Port
Common Optional Settings:
- Max Message Size - Maximum size of UDP packets to accept (default: 10KB, max: 64KB)
- Read Buffer - UDP socket read buffer size for handling bursts of messages
- Read Timeout - How long to wait for incoming packets before checking for shutdown
The log data stream collects various log types from Fortinet FortiManager, including event, content, and system logs. These logs provide information about device management, configuration changes, and administrative activity.
Exported fields
| Field | Description | Type |
|---|---|---|
| @timestamp | Event timestamp. | date |
| container.id | Unique container id. | keyword |
| data_stream.dataset | Data stream dataset. | constant_keyword |
| data_stream.namespace | Data stream namespace. | constant_keyword |
| data_stream.type | Data stream type. | constant_keyword |
| event.dataset | Event dataset. | constant_keyword |
| event.module | Event module. | constant_keyword |
| fortimanager.log.action | Records the action taken. | keyword |
| fortimanager.log.address | IP address of login user. | ip |
| fortimanager.log.admin_prof | Login user admin profile. | keyword |
| fortimanager.log.adom.lock | Name of adom which is locked/unlocked. | keyword |
| fortimanager.log.adom.name | The name of admin ADOM. | keyword |
| fortimanager.log.adom.oid | The OID of target ADOM. | keyword |
| fortimanager.log.app | Application name. | keyword |
| fortimanager.log.appcat | Application category. | keyword |
| fortimanager.log.apprisk | Application risk. | keyword |
| fortimanager.log.attribute_name | Variable name of which value is changed. | keyword |
| fortimanager.log.auth_msg | SSH authentication message. | keyword |
| fortimanager.log.bid | BID. | keyword |
| fortimanager.log.capacity | The percentage of memory capacity is used. | long |
| fortimanager.log.category | Log category. | keyword |
| fortimanager.log.cause | Reason that causes HA status down. | keyword |
| fortimanager.log.cert.name | Name of certificate. | keyword |
| fortimanager.log.cert.type | Type of certificate. | keyword |
| fortimanager.log.changes | Changes done on fortimanager subtype. | match_only_text |
| fortimanager.log.cli_act | CLI command action. | keyword |
| fortimanager.log.cmd_from | CLI command from. | keyword |
| fortimanager.log.comment | The description of this policy package. | keyword |
| fortimanager.log.condition | DVM dev condition. | keyword |
| fortimanager.log.conf_status | Conf sync status. | keyword |
| fortimanager.log.connect_status | Status of connection to the device. | keyword |
| fortimanager.log.const_msg | Constant message. | keyword |
| fortimanager.log.cpu_usage | CPU usage. | long |
| fortimanager.log.crlevel | CR level. | keyword |
| fortimanager.log.crscore | CR score. | long |
| fortimanager.log.date | The year, month, and day when the event occurred in the format: YY-MM-DD. | date |
| fortimanager.log.db.status | DVM device status. | keyword |
| fortimanager.log.db.ver | The service database version. | keyword |
| fortimanager.log.desc | A description of the activity or event recorded by the FortiManager unit. | keyword |
| fortimanager.log.detail | The task details. | keyword |
| fortimanager.log.dev.grps | Device groups. | keyword |
| fortimanager.log.dev.id | An identification number for the device that recorded the event. | keyword |
| fortimanager.log.dev.log | Name of the device. | keyword |
| fortimanager.log.dev.name | The name of the device that recorded the event. | keyword |
| fortimanager.log.dev.oid | The OID of target device. | keyword |
| fortimanager.log.device.id | An identification number for the device that recorded the event. | keyword |
| fortimanager.log.device.name | Name of the device. | keyword |
| fortimanager.log.device_log.id | Device log id. | keyword |
| fortimanager.log.device_log.last_logging | Last logging device. | keyword |
| fortimanager.log.device_log.name | Device log name. | keyword |
| fortimanager.log.device_log.offline_duration | Offline durations of device. | keyword |
| fortimanager.log.direction | Direction. | keyword |
| fortimanager.log.disk.label | Raid disk label. | long |
| fortimanager.log.disk.status.before | RAID disk status before change. | keyword |
| fortimanager.log.disk.status.current | RAID disk status after change. | keyword |
| fortimanager.log.dm_state | Deployment manager states. | keyword |
| fortimanager.log.dstcountry | Destination country. | keyword |
| fortimanager.log.dste.pid | An identification number for the destination endpoint. | keyword |
| fortimanager.log.dste.uid | An identification number for the destination end user. | keyword |
| fortimanager.log.dstip | Destination IP. | ip |
| fortimanager.log.dstname | Destination name. | keyword |
| fortimanager.log.dvid | Device id. | keyword |
| fortimanager.log.dvmdb_obj | Dvm_db object type. | keyword |
| fortimanager.log.end_time | End time of the report. | date |
| fortimanager.log.epid | An identification number for the endpoint. | keyword |
| fortimanager.log.err_code | Error code. | keyword |
| fortimanager.log.error | Error detail. | keyword |
| fortimanager.log.euid | An identification number for the destination end user. | keyword |
| fortimanager.log.event.id | Event id. | keyword |
| fortimanager.log.event.type | The type of event recorded. | keyword |
| fortimanager.log.expiration | Expiration time of the license. | date |
| fortimanager.log.extra_info | SSH authentication extra information. | keyword |
| fortimanager.log.file | Filename of package/log file. | keyword |
| fortimanager.log.fips.err | FIPS test error code. | keyword |
| fortimanager.log.fips.method | FIPS self-test method. | keyword |
| fortimanager.log.function | The name of the function call. | keyword |
| fortimanager.log.id | A ten-digit number that identifies the log type. The first two digits represent the log type, and the following two digits represent the log subtype. The last six digits represent the message id number. | keyword |
| fortimanager.log.importance | dvm_db metafield mtype. | keyword |
| fortimanager.log.inst.adom | The name of ADOM which contains target device. | keyword |
| fortimanager.log.inst.dev | The name of device on which policy is installed. | keyword |
| fortimanager.log.inst.pkg | Name of policy package which is installed. | keyword |
| fortimanager.log.intfname | Interface name. | keyword |
| fortimanager.log.itime | Instruction time. | date |
| fortimanager.log.level | The severity level or priority of the event. | keyword |
| fortimanager.log.license_type | License type. | long |
| fortimanager.log.lickey_type | License key type. | keyword |
| fortimanager.log.lnk_path | The name of the link file being transferred to the server. | keyword |
| fortimanager.log.local_file | Local file include its path. | keyword |
| fortimanager.log.max_mb | License allowed maximum capacity in MB. | long |
| fortimanager.log.mem_usage | Memory usage. | long |
| fortimanager.log.meta_field.leng | Dvm_db metafield value size. | long |
| fortimanager.log.meta_field.name | Dvm_db metafield name. | keyword |
| fortimanager.log.meta_field.stat | Dvm_db metafield status. | keyword |
| fortimanager.log.module | Identifier of the HA sync module. | long |
| fortimanager.log.msg | The activity or event recorded by the FortiManager unit. | keyword |
| fortimanager.log.msg_rate | Message rate. | long |
| fortimanager.log.new.name | New object name being renamed to. | keyword |
| fortimanager.log.new.value | String representation of value after being changed. | keyword |
| fortimanager.log.new.version | New available version of the requested object. | keyword |
| fortimanager.log.obj.attr | CMDB config object attribute. | keyword |
| fortimanager.log.obj.name | Object name. | keyword |
| fortimanager.log.obj.path | CMDB config object path. | keyword |
| fortimanager.log.obj.type | Object type. | keyword |
| fortimanager.log.object | Filename of the requested object. | keyword |
| fortimanager.log.offline_stat | Offline mode enabled or disabled. | keyword |
| fortimanager.log.old_value | String representation of value before being changed. | keyword |
| fortimanager.log.oper_stat | The result of the operation. | keyword |
| fortimanager.log.operation | Operation name. | keyword |
| fortimanager.log.osname | OS name. | keyword |
| fortimanager.log.package.desc | Package description. | keyword |
| fortimanager.log.package.name | Name of package which is installed. | keyword |
| fortimanager.log.package.type | Identifier of package type. | keyword |
| fortimanager.log.path | The original log file. | keyword |
| fortimanager.log.peer | Serial number of HA peer. | keyword |
| fortimanager.log.percent | The percentage of this task being running. | long |
| fortimanager.log.performed_on | Details on which action was performed. | keyword |
| fortimanager.log.pid | Process id. | long |
| fortimanager.log.pkg.adom | Name of ADOM this policy package belongs to. | keyword |
| fortimanager.log.pkg.gname | Name of the global policy package that is assigned. | keyword |
| fortimanager.log.pkg.name | Name of the policy package which is locked/unlocked. | keyword |
| fortimanager.log.pkg.oid | The OID of the package to be installed. | keyword |
| fortimanager.log.pre_version | Previous version of the requested object. | keyword |
| fortimanager.log.pri | The severity level or priority of the event. | keyword |
| fortimanager.log.priority_number | Syslog priority number. | long |
| fortimanager.log.product | Fortinet product name. | keyword |
| fortimanager.log.prof_name | Device profile object name. | keyword |
| fortimanager.log.protocol | Transmission protocol used to backup all settings. | keyword |
| fortimanager.log.pty.err | Pty operation error no. | keyword |
| fortimanager.log.pty.oper | Pty operation type, get or put. | keyword |
| fortimanager.log.pty.sess | Pty session server type. | keyword |
| fortimanager.log.pty.step | Pty operation step. | keyword |
| fortimanager.log.quota | Disk quota ratio in percentage. | long |
| fortimanager.log.raid_state.before | RAID status before change. | keyword |
| fortimanager.log.raid_state.current | RAID status after change. | keyword |
| fortimanager.log.rate | How many requests are handled per minute. | long |
| fortimanager.log.rate_limit | Log rate limit. | long |
| fortimanager.log.rate_peak | Log rate peak. | long |
| fortimanager.log.rate_value | Log rate. | long |
| fortimanager.log.rcvdbyte | Number of bytes received. | long |
| fortimanager.log.reboot_reason | The reason for system reboot. | keyword |
| fortimanager.log.remote.filename | Remote filename on server side. | keyword |
| fortimanager.log.remote.host | Remote host name or host ip in string presentation. | keyword |
| fortimanager.log.remote.ip | Remote peer ip in string presentation. | ip |
| fortimanager.log.remote.path | Remote path on server side. | keyword |
| fortimanager.log.remote.port | Remote peer port number. | long |
| fortimanager.log.result | The result of the operation. | keyword |
| fortimanager.log.revision | The id of the revision that is operated. | long |
| fortimanager.log.rolling.cur_number | Log rolling number that currently reached. | long |
| fortimanager.log.rolling.max_allowed | Log rolling max number that is allowed. | long |
| fortimanager.log.run_from | Reports from where the run happen. | keyword |
| fortimanager.log.rundb_ver | Version of the running database. | keyword |
| fortimanager.log.script | Name of the script. | keyword |
| fortimanager.log.sensor.name | Sensor name. | keyword |
| fortimanager.log.sensor.st | Sensor status. | keyword |
| fortimanager.log.sensor.val | Sensor value. | keyword |
| fortimanager.log.sentbyte | Number of bytes sent. | long |
| fortimanager.log.serial | Serial number of the device. | keyword |
| fortimanager.log.service | Name of the starting service. | keyword |
| fortimanager.log.session_id | The session identification number. | keyword |
| fortimanager.log.setup | Whether it needs to setup or not. | long |
| fortimanager.log.shutdown_reason | The reason for system shutdown. | keyword |
| fortimanager.log.size | The size of log file that is rolling and uploaded. | long |
| fortimanager.log.srcip | Source IP. | ip |
| fortimanager.log.srcname | Source name. | keyword |
| fortimanager.log.srcport | Source port. | long |
| fortimanager.log.start_time | Start time of the report. | date |
| fortimanager.log.state | The state of the task. | keyword |
| fortimanager.log.status | Interface/Operation status. | keyword |
| fortimanager.log.subtype | The subtype of each log message. | keyword |
| fortimanager.log.sw_version | Current firmware software version. | keyword |
| fortimanager.log.time | The hour, minute, and second of when the event occurred. | keyword |
| fortimanager.log.title | The task title. | keyword |
| fortimanager.log.to_build | The build no of the firmware that is upgraded to. | long |
| fortimanager.log.to_release | The release of the firmware that is upgraded to. | keyword |
| fortimanager.log.to_version | The version of the firmware that is upgraded to. | keyword |
| fortimanager.log.type | Log type. | keyword |
| fortimanager.log.tz | Event timezone. | keyword |
| fortimanager.log.uid | UID of a fortiClient installation. | keyword |
| fortimanager.log.unauthuser | Unauthenticated user. | keyword |
| fortimanager.log.upddb_ver | Version of the updating database. | keyword |
| fortimanager.log.upg_act | Operation that is failed. | keyword |
| fortimanager.log.upgrade.adom | The name of ADOM to be upgraded. | keyword |
| fortimanager.log.upgrade.from | The version, mr, build or branchpoint before upgrade. | keyword |
| fortimanager.log.upgrade.to | The version, mr, build or branchpoint after upgrade. | keyword |
| fortimanager.log.uploading.cur_number | The number of uploading process that currently reached. | long |
| fortimanager.log.uploading.max_allowed | Max number of uploading process that is allowed. | long |
| fortimanager.log.uploading.oper | Upload operations. | keyword |
| fortimanager.log.uploading.pid | Process id of the uploading child process. | keyword |
| fortimanager.log.uploading.server_type | The type of server that accepts the uploaded log. | keyword |
| fortimanager.log.url | Web filtering requested URL. | keyword |
| fortimanager.log.use_mb | Used capacity in MB. | long |
| fortimanager.log.user.from | Login session user from. | keyword |
| fortimanager.log.user.id | PTY operation login user id. | keyword |
| fortimanager.log.user.name | User name. | keyword |
| fortimanager.log.user.type | Access restriction of session admin profile. | keyword |
| fortimanager.log.ustr | Extra log information. | keyword |
| fortimanager.log.valid | If ssh user is valid or not. | long |
| fortimanager.log.vdom | Virtual domain of a device. | keyword |
| fortimanager.log.vdoms | List of VDOMs to which revision is installed. | keyword |
| fortimanager.log.version | The new version of updated object. | keyword |
| fortimanager.log.whitelist_size | The size of white list table. | keyword |
| fortimanager.log.zip_path | The name of the gzip file being transferred to the server. | keyword |
| input.type | Type of filebeat input. | keyword |
| log.file.device_id | ID of the device containing the filesystem where the file resides. | keyword |
| log.file.fingerprint | The sha256 fingerprint identity of the file when fingerprinting is enabled. | keyword |
| log.file.idxhi | The high-order part of a unique identifier that is associated with a file. (Windows-only) | keyword |
| log.file.idxlo | The low-order part of a unique identifier that is associated with a file. (Windows-only) | keyword |
| log.file.inode | Inode number of the log file. | keyword |
| log.file.path | Full path to the log file this event came from. | keyword |
| log.file.vol | The serial number of the volume that contains a file. (Windows-only) | keyword |
| log.flags | Flags for the log file. | keyword |
| log.offset | Log offset. | long |
| log.source.address | Source address from which the log event was read / sent from. | keyword |
| tags | User defined tags. | keyword |
Example
{
    "@timestamp": "2023-02-19T22:20:11.000Z",
    "agent": {
        "ephemeral_id": "8937d089-d80c-4225-9177-d6286824defd",
        "id": "1c091add-3dae-4323-a5e8-648158c83b7b",
        "name": "docker-fleet-agent",
        "type": "filebeat",
        "version": "8.10.2"
    },
    "data_stream": {
        "dataset": "fortinet_fortimanager.log",
        "namespace": "ep",
        "type": "logs"
    },
    "device": {
        "id": "FMGVMSTM23000100"
    },
    "ecs": {
        "version": "8.17.0"
    },
    "elastic_agent": {
        "id": "1c091add-3dae-4323-a5e8-648158c83b7b",
        "snapshot": false,
        "version": "8.10.2"
    },
    "event": {
        "action": "roll",
        "agent_id_status": "verified",
        "dataset": "fortinet_fortimanager.log",
        "ingested": "2023-10-03T09:57:15Z",
        "kind": "event",
        "original": "<134>date=2023-02-20 time=03:20:11 tz=\"+0500\" devname=Crest-Elastic-FMG-VM64 device_id=FMGVMSTM23000100 log_id=0031040026 type=event subtype=logfile pri=information desc=\"Rolling disk log file\" user=\"system\" userfrom=\"system\" msg=\"Rolled log file glog.1676746501.log of device SYSLOG-0A32041A [SYSLOG-0A32041A] vdom root.\" operation=\"Roll logfile\" performed_on=\"\" changes=\"Rolled log file.\" action=\"roll\"",
        "timezone": "+0500",
        "type": [
            "info"
        ]
    },
    "fortimanager": {
        "log": {
            "action": "roll",
            "changes": "Rolled log file.",
            "date": "2023-02-19T22:20:11.000Z",
            "desc": "Rolling disk log file",
            "dev": {
                "name": "Crest-Elastic-FMG-VM64"
            },
            "device": {
                "id": "FMGVMSTM23000100"
            },
            "id": "0031040026",
            "msg": "Rolled log file glog.1676746501.log of device SYSLOG-0A32041A [SYSLOG-0A32041A] vdom root.",
            "operation": "Roll logfile",
            "pri": "information",
            "priority_number": 134,
            "product": "fortianalyzer",
            "subtype": "logfile",
            "type": "event",
            "user": {
                "from": "system",
                "name": "system"
            }
        }
    },
    "host": {
        "hostname": "Crest-Elastic-FMG-VM64"
    },
    "input": {
        "type": "tcp"
    },
    "log": {
        "source": {
            "address": "192.168.224.5:58676"
        }
    },
    "message": "Rolled log file glog.1676746501.log of device SYSLOG-0A32041A [SYSLOG-0A32041A] vdom root.",
    "related": {
        "hosts": [
            "Crest-Elastic-FMG-VM64"
        ],
        "user": [
            "system"
        ]
    },
    "tags": [
        "preserve_original_event",
        "preserve_duplicate_custom_fields",
        "forwarded",
        "fortinet_fortimanager-log"
    ],
    "user": {
        "name": "system"
    }
}
You can find more information about FortiManager logs in the following vendor resources:
- FortiManager & FortiAnalyzer Log Reference
- FortiManager 7.6.4 Administration Guide - Syslog Server
- FortiManager 7.4.5 Administration Guide - Send local logs to syslog server
- Fortinet Technical Tip: Configure FortiManager to send logs to a syslog server
- Fortinet FortiManager VM Install Guide
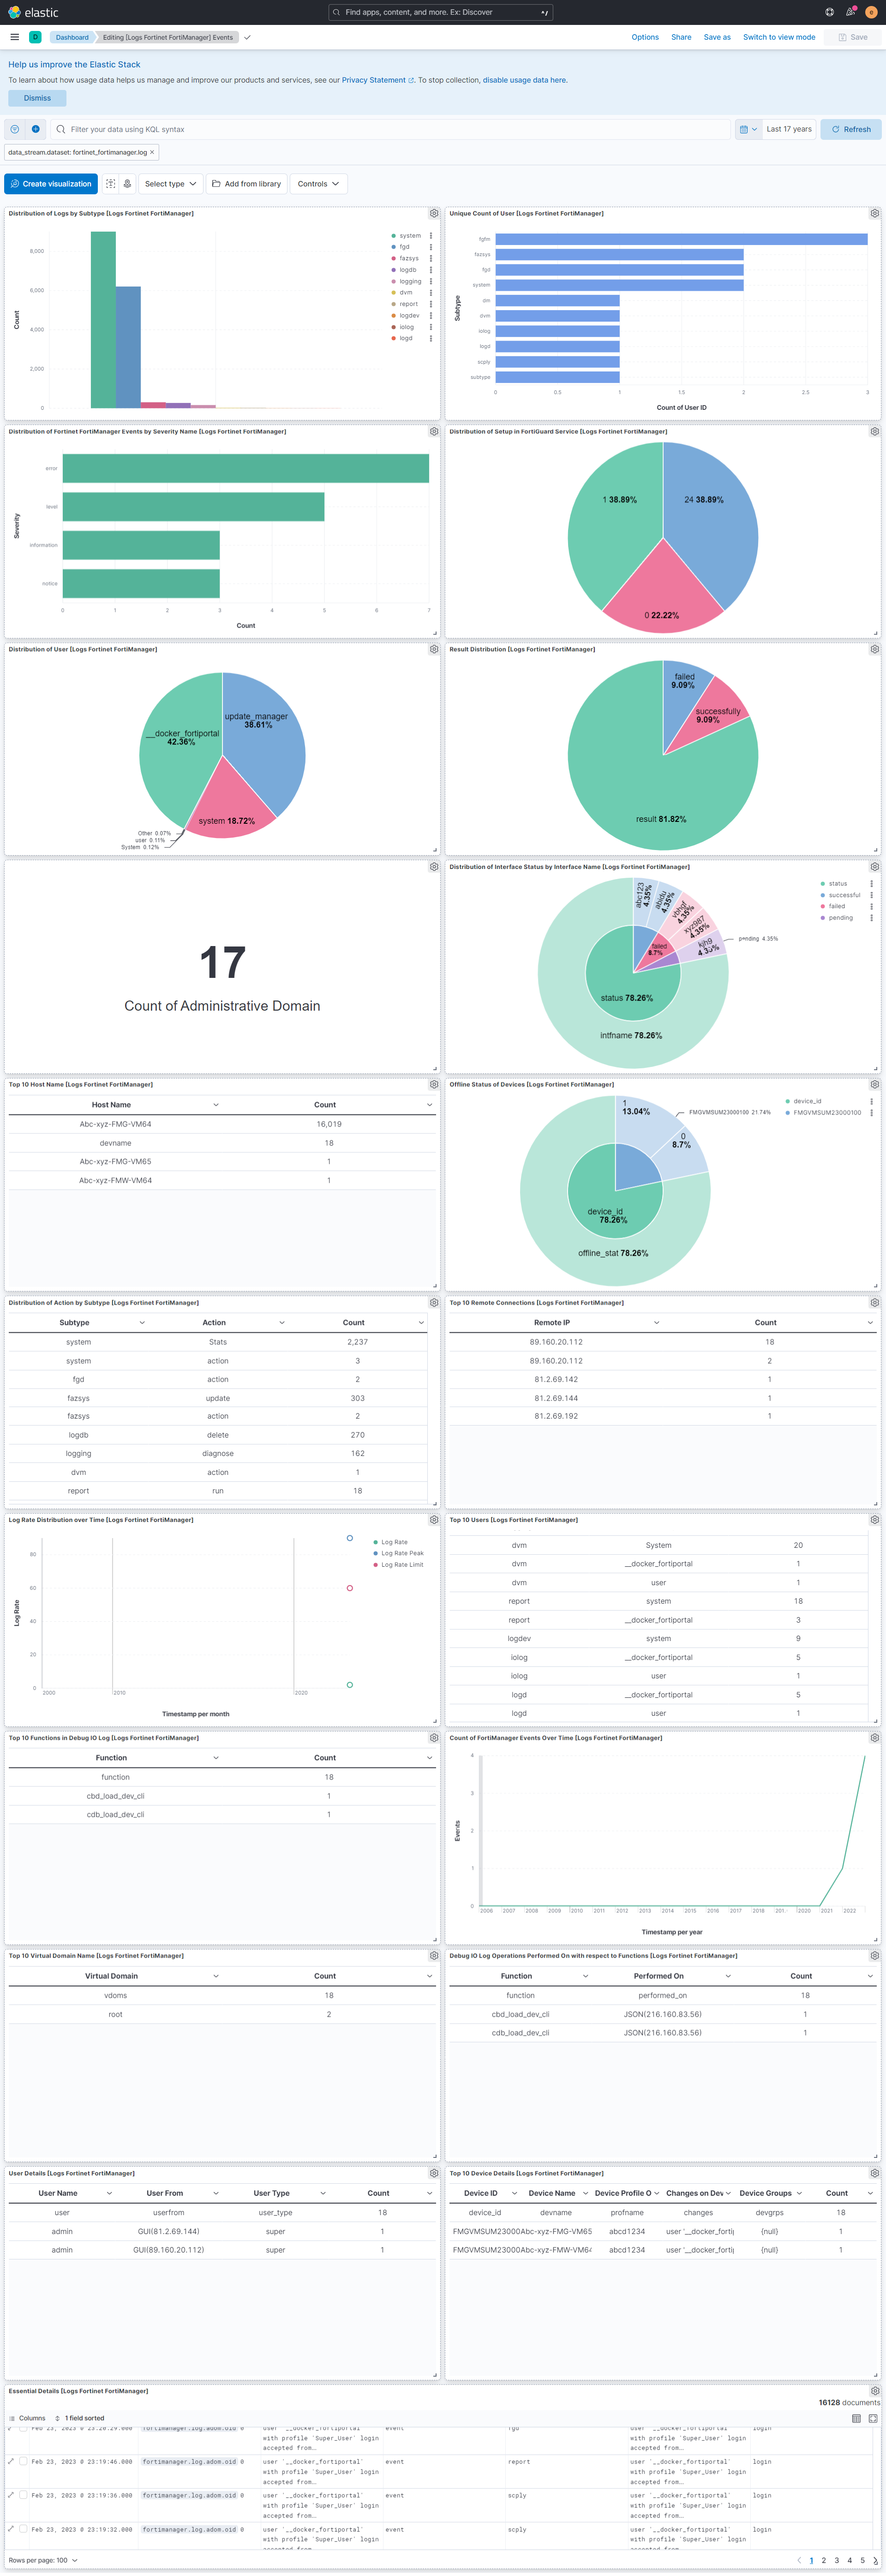
This integration includes one or more Kibana dashboards that visualizes the data collected by the integration. The screenshots below illustrate how the ingested data is displayed.
Changelog
| Version | Details | Minimum Kibana version |
|---|---|---|
| 2.18.1 | Bug fix (View pull request) Remove top level note from docs |
9.0.0 8.11.0 |
| 2.18.0 | Enhancement (View pull request) updated documentation |
9.0.0 8.11.0 |
| 2.17.0 | Enhancement (View pull request) Preserve event.original on pipeline error. |
9.0.0 8.11.0 |
| 2.16.2 | Enhancement (View pull request) Generate processor tags and normalize error handler. |
9.0.0 8.11.0 |
| 2.16.1 | Enhancement (View pull request) Changed owners. |
9.0.0 8.11.0 |
| 2.16.0 | Enhancement (View pull request) Allow @custom pipeline access to event.original without setting preserve_original_event. |
9.0.0 8.11.0 |
| 2.15.0 | Enhancement (View pull request) Support stack version 9.0. |
9.0.0 8.3.0 |
| 2.14.1 | Bug fix (View pull request) Updated SSL description to be uniform and to include links to documentation. |
8.3.0 |
| 2.14.0 | Enhancement (View pull request) ECS version updated to 8.17.0. |
8.3.0 |
| 2.13.0 | Enhancement (View pull request) Add more ECS fields mappings. |
8.3.0 |
| 2.12.0 | Enhancement (View pull request) Switch from KV to Script processors to improve ingest performance. |
8.3.0 |
| 2.11.1 | Bug fix (View pull request) Resolved ignore_malformed issues with fields. |
8.3.0 |
| 2.11.0 | Enhancement (View pull request) Update package spec to 3.0.3. |
8.3.0 |
| 2.10.2 | Enhancement (View pull request) Changed owners |
8.3.0 |
| 2.10.1 | Bug fix (View pull request) Fix exclude_files pattern. |
8.3.0 |
| 2.10.0 | Enhancement (View pull request) ECS version updated to 8.11.0. |
8.3.0 |
| 2.9.0 | Enhancement (View pull request) Improve 'event.original' check to avoid errors if set. |
8.3.0 |
| 2.8.0 | Enhancement (View pull request) Adapt fields for changes in file system info |
8.3.0 |
| 2.7.0 | Enhancement (View pull request) ECS version updated to 8.10.0. |
8.3.0 |
| 2.6.0 | Enhancement (View pull request) The format_version in the package manifest changed from 2.11.0 to 3.0.0. Removed dotted YAML keys from package manifest. Added 'owner.type: elastic' to package manifest. |
8.3.0 |
| 2.5.0 | Enhancement (View pull request) Add tags.yml file so that integration's dashboards and saved searches are tagged with "Security Solution" and displayed in the Security Solution UI. |
8.3.0 |
| 2.4.0 | Enhancement (View pull request) Update package to ECS 8.9.0. |
8.3.0 |
| 2.3.1-next | Bug fix (View pull request) Relax constraints on date values for testing. |
— |
| 2.3.0 | Enhancement (View pull request) Update package to ECS 8.8.0. |
8.3.0 |
| 2.2.0 | Enhancement (View pull request) Update package-spec version to 2.7.0. |
8.3.0 |
| 2.1.0 | Enhancement (View pull request) Update package to ECS 8.7.0. |
8.3.0 |
| 2.0.0 | Enhancement (View pull request) Replace RSA2ELK with Syslog integration. |
8.3.0 |
| 1.3.1 | Enhancement (View pull request) Added categories and/or subcategories. |
8.0.0 7.14.1 |
| 1.3.0 | Enhancement (View pull request) Update package to ECS 8.6.0. |
8.0.0 7.14.1 |
| 1.2.0 | Enhancement (View pull request) Update package to ECS 8.5.0. |
8.0.0 7.14.1 |
| 1.1.3 | Bug fix (View pull request) Remove duplicate fields. |
8.0.0 7.14.1 |
| 1.1.2 | Bug fix (View pull request) Remove duplicate field. |
8.0.0 7.14.1 |
| 1.1.1 | Enhancement (View pull request) Use ECS geo.location definition. |
8.0.0 7.14.1 |
| 1.1.0 | Enhancement (View pull request) Update Ingest Pipeline with observer Fields |
8.0.0 7.14.1 |
| 1.0.0 | Enhancement (View pull request) Initial version of Fortinet FortiManager as separate package |
8.0.0 7.14.1 |