Squid Proxy Integration for Elastic
Elastic Cloud Serverless projects are autoscaled environments, fully managed by Elastic and available on Elastic Cloud. Availability This functionality is generally available and ready for production usage. Elastic Cloud Serverless projects are autoscaled environments, fully managed by Elastic and available on Elastic Cloud. Availability This functionality is generally available and ready for production usage. The Elastic Stack includes Elastic's core products such as Elasticsearch, Kibana, Logstash, and Beats. Availability This functionality is generally available and ready for production usage. Unless stated otherwise on the page, this functionality is available when your Elastic Stack is deployed on Elastic Cloud Hosted, Elastic Cloud Enterprise, Elastic Cloud on Kubernetes, and self-managed environments. This documentation corresponds to the latest patch available for each minor version. If you're not using the latest patch, check the release notes for changes.
Serverless Observability
Generally available
Serverless Security
Generally available
Stack
9.0+
Generally available since 9.0
| Version | 1.6.0 (View all) |
| Subscription level What's this? |
Basic |
| Developed by What's this? |
Elastic |
| Ingestion method(s) | File, Network Protocol |
| Minimum Kibana version(s) | 9.0.0 8.16.2 |
The Squid Proxy integration for Elastic enables you to collect and parse logs from Squid devices using Elastic Agent. This allows you to monitor web traffic, optimize cache performance, and perform security auditing within the Elastic Stack. By ingesting these logs, you'll gain visibility into bandwidth consumption, user behavior, and potential security threats.
This integration is compatible with the following:
- Squid Proxy versions that support the native log format and log modules such as Standard I/O, TCP Receiver, or UDP Receiver.
- Linux distributions including Ubuntu, Debian, CentOS, and RHEL.
- Other Unix-like operating systems capable of running Squid.
The Squid Proxy integration collects logs through several input methods, allowing you to choose the best approach for your architecture. You can configure the integration to receive data over the network using the UDP or TCP inputs, or you can use the filestream input to read logs directly from local files on the host where the agent is running.
Once the data is received, the integration parses the native Squid log format into the Elastic Common Schema (ECS). This standardization allows you to analyze your proxy logs alongside other data sources in your Elastic environment, using pre-built dashboards and search capabilities.
The Squid Proxy integration collects log messages of the following types:
- Access logs: Details about client requests, including the source IP, requested URL, and the HTTP method used.
- Request metadata: Information about the time taken to process requests, HTTP status codes, and the volume of data transferred.
- Cache result codes: Specific information that identifies how the request was satisfied, such as a cache hit or miss.
This integration is designed to parse the native Squid log format and map it to the Elastic Common Schema (ECS). You can ingest data into the log data stream using the following input methods:
UDPinput: Use this for high-speed transmission where low-latency delivery is the priority.TCPinput: Use this for reliable, connection-oriented transmission of your proxy events.filestreaminput: Use this to read logs directly from local files on the host where the Elastic Agent is running.
Integrating Squid Proxy logs with the Elastic Stack helps you enhance your network visibility and security:
- Visualize traffic patterns: You can use Kibana dashboards to analyze web usage and identify bandwidth bottlenecks.
- Detect security incidents: You'll be able to identify access to malicious or unauthorized websites by correlating logs with threat intelligence.
- Troubleshoot proxy performance: You can investigate latency issues and request failures to ensure your proxy is running efficiently.
- Ensure compliance: You can maintain a searchable audit trail of web activity to meet regulatory requirements and support forensic investigations.
You'll need to meet the following Elastic prerequisites:
- Install and enroll an Elastic Agent in Fleet, or configure it as a standalone agent.
- Ensure the Elastic Agent can reach Elasticsearch for data ingestion and Kibana for management.
You'll also need to meet these vendor-specific prerequisites:
- Use
sudoorrootprivileges on the Squid server to modifysquid.confand restart the service. - Maintain a functional Squid installation with support for the native log format and standard log modules.
- Ensure the Squid server can reach the Elastic Agent host on the configured port (default
9537) if you use network-based logging (TCP/UDP). - Locate your access logs (typically at
/var/log/squid/) and understand thesquid.confconfiguration file.
Elastic Agent must be installed. For more details, check the Elastic Agent installation instructions. You can install only one Elastic Agent per host.
Elastic Agent is required to stream data from the syslog or log file receiver and ship the data to Elastic, where the events will then be processed using the integration's ingest pipelines.
You can configure Squid Proxy to send logs to Elastic using local log files, UDP, or TCP. The integration parses both Squid's built-in squid (native) format and an extensive format that exposes additional fields used by the dashboard (client port, HTTP version, header/body sizes, request headers, error details, and TLS SNI on OpenSSL builds). Follow the steps below for your preferred method:
- Open the Squid configuration file using
sudo nano /etc/squid/squid.conf(replace with your actual configuration path). - Locate or add the
access_logdirective to write to a local file. For the native format:access_log stdio:/var/log/squid/access.log squid. For the extensive format:access_log stdio:/var/log/squid/access.log extensive. - Make sure the chosen
logformatis defined insquid.conf. See Supported log formats for the exact format strings. - Save the file and restart the Squid service:
sudo systemctl restart squid. - Check that data is being written to the file:
tail -f /var/log/squid/access.log.
- Open
squid.confand add the network target:access_log udp://<AGENT_IP>:9537 squid(orextensiveinstead ofsquidfor the extensive format). Replace<AGENT_IP>with the IP address of your Elastic Agent host (replace with your actual value). - Restart Squid to begin streaming:
sudo systemctl restart squid. - (Optional) Verify that packets are leaving the host:
sudo tcpdump -i any udp port 9537.
- Open
squid.confand add the network target:access_log tcp://<AGENT_IP>:9537 squid(orextensiveinstead ofsquidfor the extensive format). Replace<AGENT_IP>with the IP address of your Elastic Agent host (replace with your actual value). - Restart the service:
sudo systemctl restart squid. - Check the connection status:
ss -ant | grep 9537.
To set up the integration in Kibana:
- In Kibana, navigate to Management > Integrations.
- Search for Squid Proxy and select the integration.
- Click Add Squid Proxy.
- Configure the integration by selecting the input type that matches your Squid Proxy setup.
Choose the configuration steps below that match your preferred input method:
This input collects logs sent over the network using the UDP protocol.
- UDP host to listen on (
udp_host): The interface the agent should listen on. Default:localhost. - UDP port to listen on (
udp_port): The port to listen for incoming Squid logs. Default:9537. - Preserve original event (
preserve_original_event): Preserves a raw copy of the original event in theevent.originalfield. Default:false. - Tags (
tags): Custom tags to add to the events. Default:['squid-log', 'forwarded']. - Custom UDP options (
udp_options): Specify custom configuration options such asread_buffer,max_message_size, ortimeout. - Processors (
processors): Define processors to reduce fields or enhance events with metadata before parsing.
This input collects logs sent over the network using the TCP protocol.
- TCP host to listen on (
tcp_host): The interface the agent should listen on. Default:localhost. - TCP port to listen on (
tcp_port): The port to listen for incoming Squid logs. Default:9537. - Preserve original event (
preserve_original_event): Preserves a raw copy of the original event in theevent.originalfield. Default:false. - Tags (
tags): Custom tags to add to the events. Default:['squid-log', 'forwarded']. - SSL configuration (
ssl): Configure SSL options includingcertificateandkeypaths for encrypted transport. - Custom TCP options (
tcp_options): Specify custom configuration options such asmax_message_size. - Processors (
processors): Define processors for data enhancement or filtering in the agent.
This input collects logs directly from log files on the host where Elastic Agent is running.
- Paths (
paths): The list of paths to look for Squid log files, such as/var/log/squid/access.log. - Preserve original event (
preserve_original_event): Preserves a raw copy of the original event in theevent.originalfield. Default:false. - Tags (
tags): Custom tags to identify logs from this input. Default:['squid-log', 'forwarded']. - Processors (
processors): Define optional processors for data enhancement or filtering.
After configuring the settings, click Save and continue to deploy the integration to your agent policy.
To verify the integration is working and data is flowing:
Verify the Elastic Agent status:
- Navigate to Management > Fleet > Agents.
- Ensure the agent assigned to the Squid policy is
Healthyand connected.
Trigger data flow on the Squid Proxy:
- Generate web traffic: From a client machine configured to use the Squid proxy, browse to several websites to generate access log entries.
- Test using command line: Use
curlon a client to make a request through the proxy:curl -x http://<SQUID_IP>:<SQUID_PORT> http://www.elastic.co(replace with your actual Squid IP and port). - Authentication event: If proxy authentication is enabled, attempt to log in with both valid and invalid credentials.
Check data in Kibana:
- Navigate to Analytics > Discover.
- Select the
logs-*data view. - Enter the KQL filter:
data_stream.dataset : "squid.log". - Verify that logs appear with the expected fields such as
event.dataset,source.ip,event.outcome, andmessage. - Navigate to Analytics > Dashboards and search for "Squid Proxy" to view pre-built visualizations populated with your data.
For help with Elastic ingest tools, refer to the Common problems documentation.
If you encounter issues with the Squid Proxy integration, check the following scenarios:
- Logs are not parsed correctly: Ensure the
access_logdirective insquid.confends with either thesquidkeyword (native format) orextensive(with the correspondinglogformat extensive ...directive defined). Any other custom format will not parse. - Port is already in use: When using TCP or UDP collection, verify that no other service is using port
9537on the Elastic Agent host. You can check for existing listeners by runningsudo lsof -i :9537. - Permission denied errors: If you're using the filestream input, check that the Elastic Agent user has read permissions for the Squid log files, typically located in
/var/log/squid/. - Logs are not appearing in Kibana: Verify that firewalls on both the Squid server and the Elastic Agent host allow traffic on the configured port. By default, this integration uses port
9537. - Grok parsing failures: Look for
_grokparsefailuretags in Discover. These usually occur if thelogformatin your Squid configuration has been customized — only thesquid(native) andextensiveformats documented here are supported. - Event timestamps are incorrect: Synchronize the system clocks on both the Squid server and the Elastic Agent host using NTP to prevent events from appearing with future timestamps or arriving late.
For more information on architectures that can be used for scaling this integration, check the Ingest Architectures documentation.
To ensure your Squid Proxy integration performs optimally in high-volume environments, consider the following:
The choice of protocol and input type affects both performance and reliability:
- While
UDPis faster for log transmission with lower overhead, you should useTCPin environments where you require delivery guarantees. - For local collection, use the
filestreaminput because it's highly reliable, maintains state, and handles log rotation natively.
Squid Proxy can generate significant log volumes. You can manage this load using the following methods:
- Use Squid ACLs to filter traffic at the source.
- Configure the
access_logdirective to only log specific event types. - Use the
squid(native) orextensivelogformat documented above — the parser depends on this exact structure.
For high-throughput environments, you can scale your deployment using these strategies:
- Deploy an Elastic Agent on each Squid node for local file collection.
- If you're using centralized network-based collection, deploy multiple Elastic Agents behind a network load balancer to distribute the ingest load evenly across multiple CPU cores.
The integration parses two Squid logformat definitions. Reference the chosen one by name in the access_log directive.
squid (native) — ships with Squid, no logformat directive needed:
logformat squid %ts.%03tu %6tr %>a %Ss/%03>Hs %<st %rm %ru %[un %Sh/%<a %mt
extensive — adds client port, HTTP version, header/body sizes, request headers, error details, and TLS SNI (on OpenSSL builds with ssl_bump). Add this directive to squid.conf:
logformat extensive %ts.%03tu %6tr %>a %>p %Ss/%03>Hs %<st %>st %<sh %>sh %<sH %rm %ru %rv %[un %Sh/%<a %<p %mt %err_code %err_detail "%{Referer}>h" "%{User-Agent}>h" "%{Host}>h" "%{X-Forwarded-For}>h" "%ssl::>sni" %note
Drop the "%ssl::>sni" token on builds without OpenSSL — the integration handles both variants.
For more details on Squid logging and configuration, refer to the official documentation:
- Squid Log Modules - Official Wiki
- Squid Access Log FAQ - Official Wiki
- Squid Native Log Format Details
These inputs can be used with this integration:
filestream
For more details about the Filestream input settings, check the Filebeat documentation.
To collect logs via Filestream, select Collect logs via Filestream and configure the following parameters:
- Filestream paths: The full path to the related log file.
tcp
For more details about the TCP input settings, check the Filebeat documentation.
To collect logs via TCP, select Collect logs via TCP and configure the following parameters:
Required Settings:
- Host
- Port
Common Optional Settings:
- Max Message Size - Maximum size of incoming messages
- Max Connections - Maximum number of concurrent connections
- Timeout - How long to wait for data before closing idle connections
- Line Delimiter - Character(s) that separate log messages
To enable encrypted connections, configure the following SSL settings:
SSL Settings:
- Enable SSL - Toggle to enable SSL/TLS encryption
- Certificate - Path to the SSL certificate file (
.crtor.pem) - Certificate Key - Path to the private key file (
.key) - Certificate Authorities - Path to CA certificate file for client certificate validation (optional)
- Client Authentication - Require client certificates (
none,optional, orrequired) - Supported Protocols - TLS versions to support (e.g.,
TLSv1.2,TLSv1.3)
Example SSL Configuration:
ssl.enabled: true
ssl.certificate: "/path/to/server.crt"
ssl.key: "/path/to/server.key"
ssl.certificate_authorities: ["/path/to/ca.crt"]
ssl.client_authentication: "optional"
udp
For more details about the UDP input settings, check the Filebeat documentation.
To collect logs via UDP, select Collect logs via UDP and configure the following parameters:
Required Settings:
- Host
- Port
Common Optional Settings:
- Max Message Size - Maximum size of UDP packets to accept (default: 10KB, max: 64KB)
- Read Buffer - UDP socket read buffer size for handling bursts of messages
- Read Timeout - How long to wait for incoming packets before checking for shutdown
The log data stream provides events from Squid Proxy access logs in either the native (squid) or extensive logformat.
Exported fields
| Field | Description | Type |
|---|---|---|
| @timestamp | Event timestamp. | date |
| container.id | Unique container id. | keyword |
| data_stream.dataset | Data stream dataset. | constant_keyword |
| data_stream.namespace | Data stream namespace. | constant_keyword |
| data_stream.type | Data stream type. | constant_keyword |
| event.dataset | Event dataset | constant_keyword |
| event.module | Event module | constant_keyword |
| input.type | Type of Filebeat input. | keyword |
| log.file.device_id | ID of the device containing the filesystem where the file resides. | keyword |
| log.file.fingerprint | The sha256 fingerprint identity of the file when fingerprinting is enabled. | keyword |
| log.file.idxhi | The high-order part of a unique identifier that is associated with a file. (Windows-only) | keyword |
| log.file.idxlo | The low-order part of a unique identifier that is associated with a file. (Windows-only) | keyword |
| log.file.inode | Inode number of the log file. | keyword |
| log.file.path | Full path to the log file this event came from. | keyword |
| log.file.vol | The serial number of the volume that contains a file. (Windows-only) | keyword |
| log.flags | Flags for the log file. | keyword |
| log.offset | Offset of the entry in the log file. | long |
| log.source.address | Source address from which the log event was read / sent from. | keyword |
| squid.content_type | The content type as seen in the HTTP reply header. | keyword |
| squid.error_detail | Squid error detail or sub-error code. | keyword |
| squid.host_header | The Host header value from the client request. | keyword |
| squid.note | Squid annotations and notes attached to the transaction. | keyword |
| squid.peer_status | A code explaining how the request was handled, by forwarding it to a peer or going straight to the source. | keyword |
| squid.reply_header_size | Size of the HTTP reply headers in bytes. | long |
| squid.request_header_size | Size of the HTTP request headers in bytes. | long |
| squid.result_code | The outcome of the request. | keyword |
| squid.status_code | The status of the result. | long |
Example
{
    "@timestamp": "2006-09-08T04:21:52.049Z",
    "agent": {
        "ephemeral_id": "3ef4eb0b-1558-4348-9418-3832e42ec4c4",
        "id": "1e9b5f16-68f7-442a-a2aa-90d1dc90fff2",
        "name": "elastic-agent-30924",
        "type": "filebeat",
        "version": "9.4.1"
    },
    "data_stream": {
        "dataset": "squid.log",
        "namespace": "82994",
        "type": "logs"
    },
    "destination": {
        "address": "175.16.199.115",
        "bytes": 19763,
        "geo": {
            "city_name": "Changchun",
            "continent_name": "Asia",
            "country_iso_code": "CN",
            "country_name": "China",
            "location": {
                "lat": 43.879999998025596,
                "lon": 125.32279992476106
            },
            "region_iso_code": "CN-22",
            "region_name": "Jilin Sheng"
        },
        "ip": "175.16.199.115"
    },
    "ecs": {
        "version": "8.17.0"
    },
    "elastic_agent": {
        "id": "1e9b5f16-68f7-442a-a2aa-90d1dc90fff2",
        "snapshot": false,
        "version": "9.4.1"
    },
    "event": {
        "agent_id_status": "verified",
        "category": [
            "web"
        ],
        "dataset": "squid.log",
        "duration": 5006000000,
        "ingested": "2026-06-11T07:45:14Z",
        "kind": "event",
        "module": "squid",
        "original": "1157689312.049   5006 10.105.21.199 TCP_MISS/200 19763 CONNECT login.yahoo.com:443 badeyek DIRECT/175.16.199.115 -",
        "outcome": "success",
        "type": [
            "access"
        ]
    },
    "http": {
        "request": {
            "method": "CONNECT"
        }
    },
    "input": {
        "type": "filestream"
    },
    "log": {
        "file": {
            "device_id": "36",
            "fingerprint": "18b587600d9fe8568a927d842f2990d77549c1e2612b94d036909ed2c03a4845",
            "inode": "218",
            "path": "/tmp/service_logs/squid-log-access.log"
        },
        "offset": 0
    },
    "observer": {
        "product": "Squid",
        "type": "proxy",
        "vendor": "Squid"
    },
    "related": {
        "ip": [
            "10.105.21.199",
            "175.16.199.115"
        ],
        "user": [
            "badeyek"
        ]
    },
    "source": {
        "address": "10.105.21.199",
        "ip": "10.105.21.199",
        "user": {
            "name": "badeyek"
        }
    },
    "squid": {
        "peer_status": "DIRECT",
        "result_code": "TCP_MISS",
        "status_code": 200
    },
    "tags": [
        "preserve_original_event",
        "squid-log",
        "forwarded"
    ],
    "url": {
        "original": "login.yahoo.com:443"
    }
}
This integration includes one or more Kibana dashboards that visualizes the data collected by the integration. The screenshots below illustrate how the ingested data is displayed.
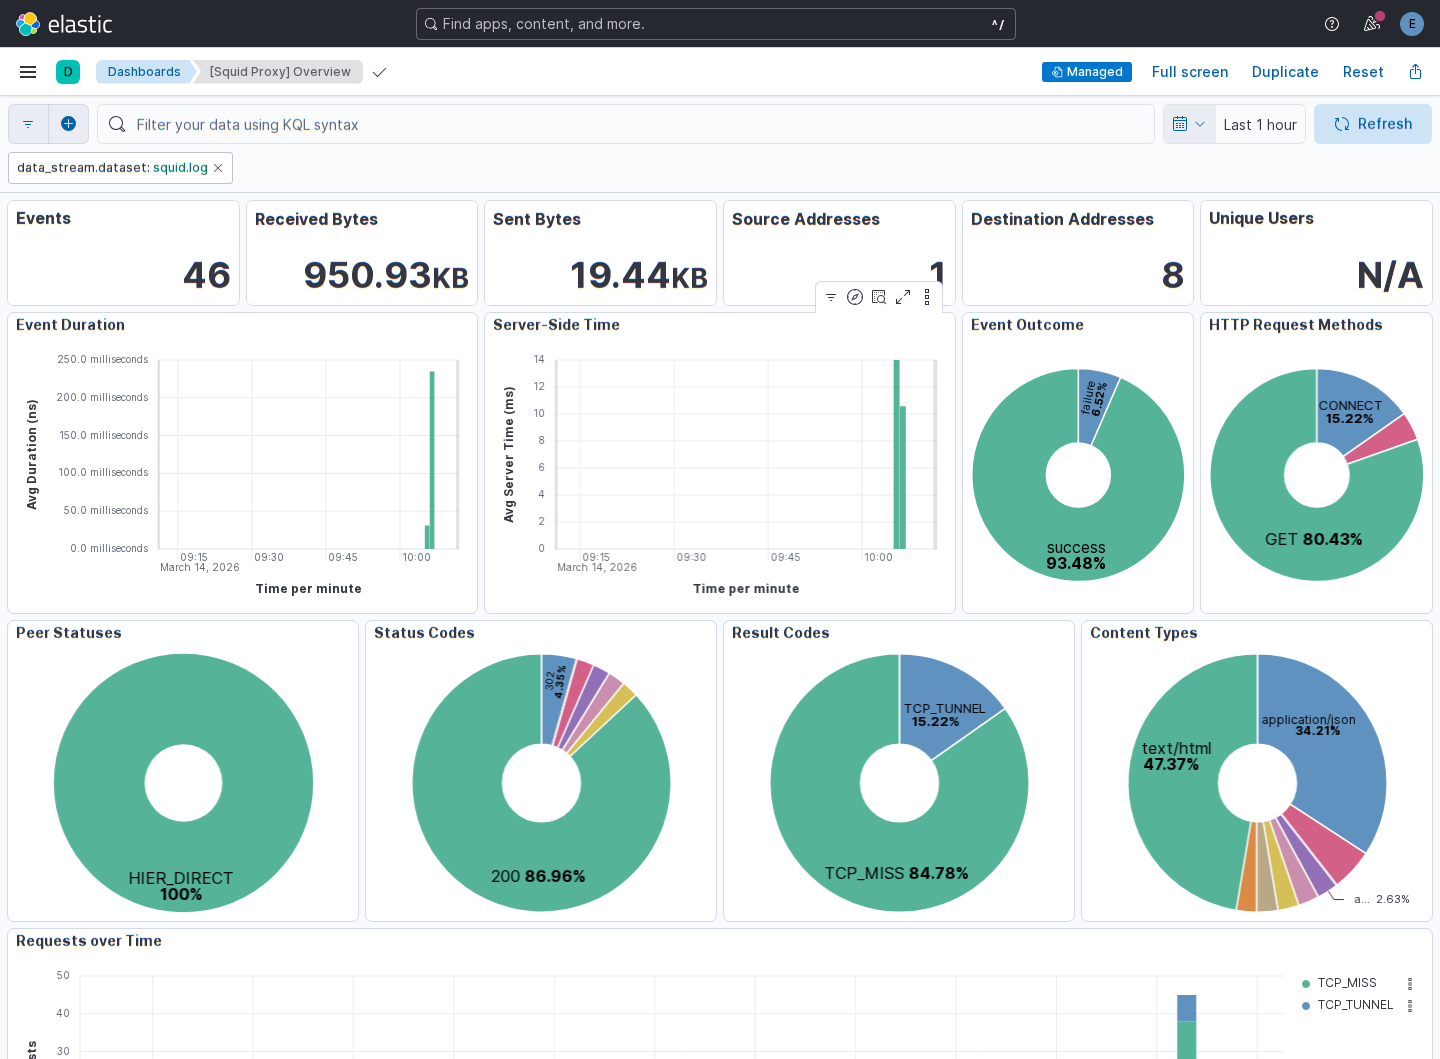
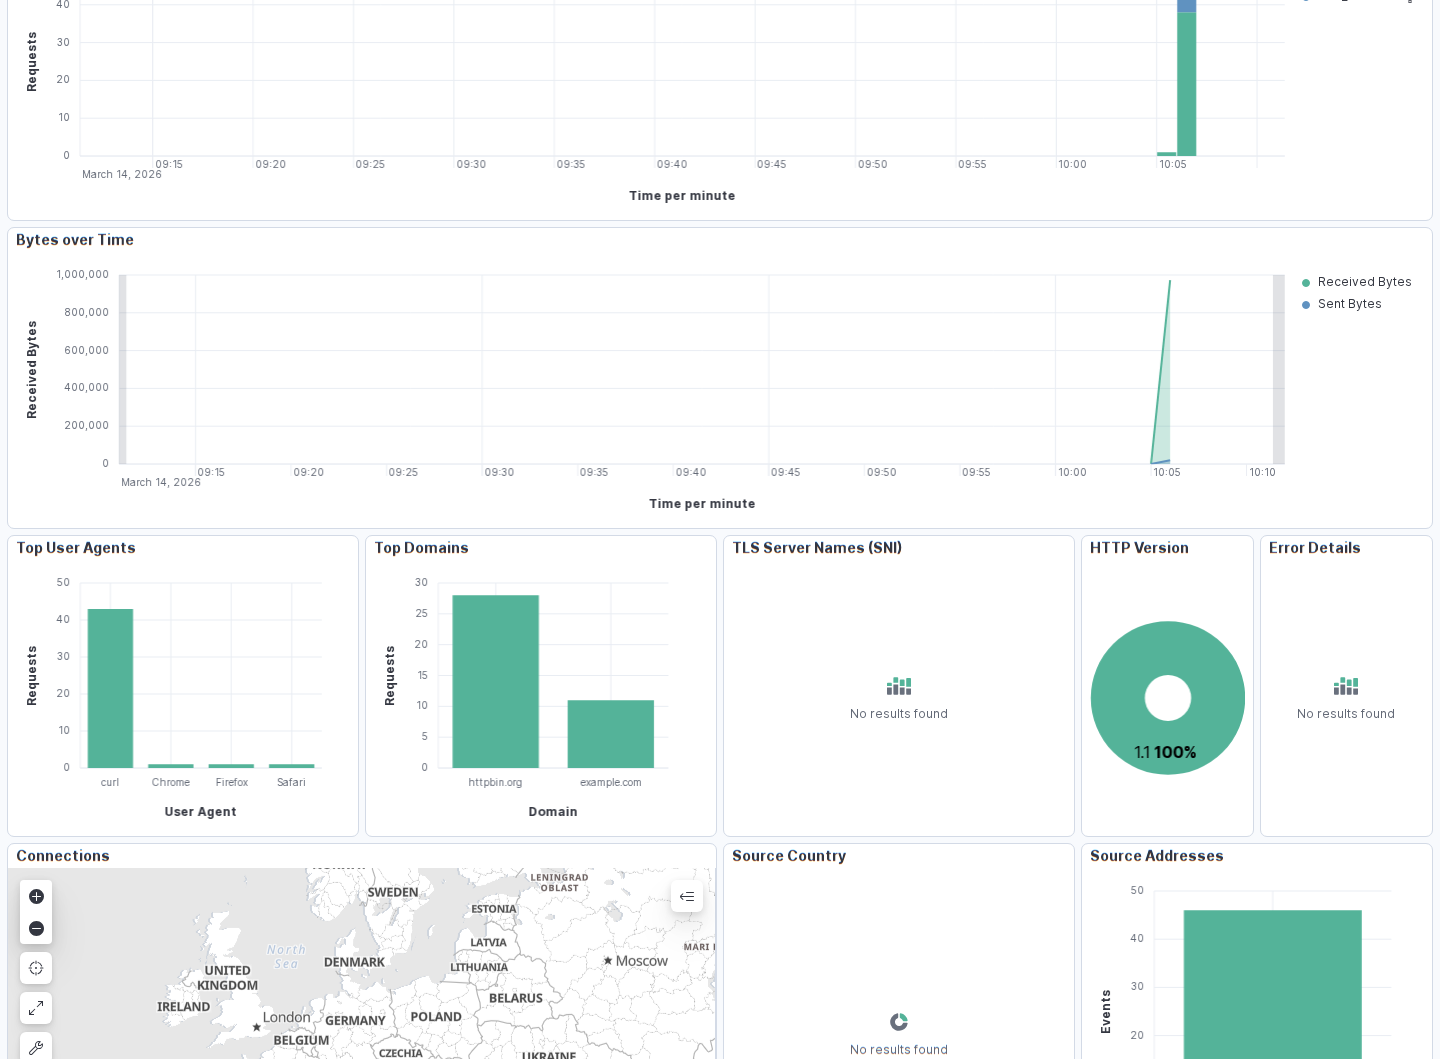
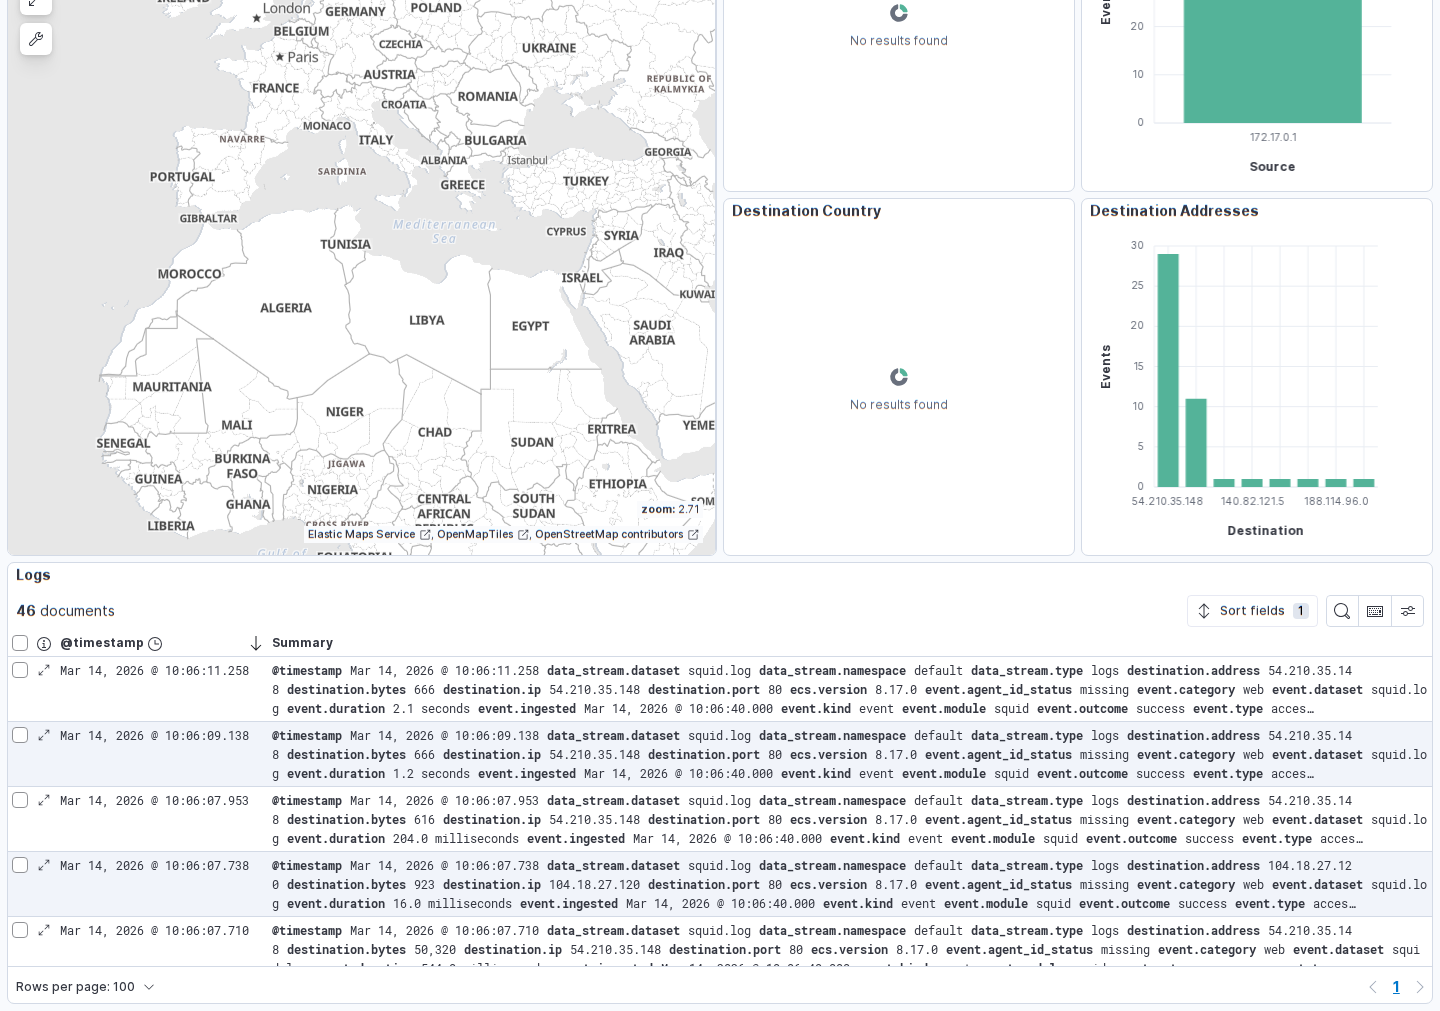
Changelog
| Version | Details | Minimum Kibana version |
|---|---|---|
| 1.6.0 | Enhancement (View pull request) Add support for Squid extensive log format with additional fields and expand dashboard with panels for TLS SNI, user agents, top domains, HTTP version, error details, and content types. Fix Status Codes panel dataType. Regenerate screenshots at 1440px. |
9.0.0 8.16.2 |
| 1.5.1 | Bug fix (View pull request) Remove top level note from docs |
9.0.0 8.14.1 |
| 1.5.0 | Enhancement (View pull request) Improved documentation with detailed setup instructions, troubleshooting guidance, and knowledge base service info. |
9.0.0 8.14.1 |
| 1.4.0 | Enhancement (View pull request) Preserve event.original on pipeline error. |
9.0.0 8.14.1 |
| 1.3.2 | Enhancement (View pull request) Generate processor tags and normalize error handler. |
9.0.0 8.14.1 |
| 1.3.1 | Enhancement (View pull request) Changed owners. |
9.0.0 8.14.1 |
| 1.3.0 | Enhancement (View pull request) Remove duplicated installation instructions from the documentation. |
9.0.0 8.14.1 |
| 1.2.0 | Enhancement (View pull request) Support stack version 9.0. |
9.0.0 8.14.1 |
| 1.1.1 | Bug fix (View pull request) Updated SSL description to be uniform and to include links to documentation. |
8.14.1 |
| 1.1.0 | Enhancement (View pull request) ECS version updated to 8.17.0. |
8.14.1 |
| 1.0.3 | Bug fix (View pull request) Fix broken link and various formatting issues for the Squid Proxy integration. |
8.14.1 |
| 1.0.2 | Bug fix (View pull request) Tolerate errors with uri_parts, ensure _tmp fields are removed in case of errors. |
8.14.1 |
| 1.0.1 | Enhancement (View pull request) Add documentation on supported formats. |
8.14.1 |
| 1.0.0 | Enhancement (View pull request) Add dashboard and improve documentation. Release integration as GA. |
8.14.1 |
| 0.21.0 | Bug fix (View pull request) Enhance mappings and add geoip enrichments. |
8.14.1 |
| 0.20.0 | Enhancement (View pull request) Rewrite integration with standard ingest pipelines. |
8.14.1 |
| 0.19.3 | Bug fix (View pull request) Add http.request.body.bytes to ECS mappings. |
8.0.0 7.14.1 |
| 0.19.2 | Enhancement (View pull request) Changed owners |
8.0.0 7.14.1 |
| 0.19.1 | Bug fix (View pull request) Fix exclude_files pattern. |
8.0.0 7.14.1 |
| 0.19.0 | Enhancement (View pull request) ECS version updated to 8.11.0. |
8.0.0 7.14.1 |
| 0.18.0 | Enhancement (View pull request) ECS version updated to 8.10.0. |
8.0.0 7.14.1 |
| 0.17.0 | Enhancement (View pull request) Update package to ECS 8.9.0. |
8.0.0 7.14.1 |
| 0.16.0 | Enhancement (View pull request) Ensure event.kind is correctly set for pipeline errors. |
8.0.0 7.14.1 |
| 0.15.0 | Enhancement (View pull request) Update package to ECS 8.8.0. |
8.0.0 7.14.1 |
| 0.14.0 | Enhancement (View pull request) Update package-spec version to 2.7.0. |
8.0.0 7.14.1 |
| 0.13.0 | Enhancement (View pull request) Update package to ECS 8.7.0. |
— |
| 0.12.1 | Enhancement (View pull request) Added categories and/or subcategories. |
— |
| 0.12.0 | Enhancement (View pull request) Update package to ECS 8.6.0. |
— |
| 0.11.2 | Bug fix (View pull request) Update docs to match field definitions. |
— |
| 0.11.1 | Bug fix (View pull request) Remove duplicate fields. |
— |
| 0.11.0 | Enhancement (View pull request) Update package to ECS 8.5.0. |
— |
| 0.10.1 | Enhancement (View pull request) Use ECS geo.location definition. |
— |
| 0.10.0 | Enhancement (View pull request) Update package to ECS 8.4.0 |
— |
| 0.9.0 | Enhancement (View pull request) Update package to ECS 8.3.0. |
— |
| 0.8.0 | Enhancement (View pull request) Update to ECS 8.2.0 |
— |
| 0.7.0 | Enhancement (View pull request) Update to ECS 8.0.0 |
— |
| 0.6.1 | Bug fix (View pull request) Regenerate test files using the new GeoIP database |
— |
| 0.6.0 | Enhancement (View pull request) Add 8.0.0 version constraint |
— |
| 0.5.4 | Enhancement (View pull request) Uniform with guidelines |
— |
| 0.5.3 | Enhancement (View pull request) Update Title and Description. |
— |
| 0.5.2 | Bug fix (View pull request) Fixed a bug that prevents the package from working in 7.16. |
— |
| 0.5.1 | Bug fix (View pull request) Fix logic that checks for the 'forwarded' tag |
— |
| 0.5.0 | Enhancement (View pull request) Update to ECS 1.12.0 |
— |
| 0.4.3 | Bug fix (View pull request) Requires version 7.14.1 of the stack |
— |
| 0.4.2 | Enhancement (View pull request) Convert to generated ECS fields |
— |
| 0.4.1 | Enhancement (View pull request) update to ECS 1.11.0 |
— |
| 0.4.0 | Enhancement (View pull request) Update integration description |
— |
| 0.3.0 | Enhancement (View pull request) Set "event.module" and "event.dataset" |
— |
| 0.2.0 | Enhancement (View pull request) update to ECS 1.10.0 and adding event.original options |
— |
| 0.1.4 | Enhancement (View pull request) update to ECS 1.9.0 |
— |
| 0.1.0 | Enhancement (View pull request) initial release |
— |