MySQL Integration
Elastic Cloud Serverless projects are autoscaled environments, fully managed by Elastic and available on Elastic Cloud. Availability This functionality is generally available and ready for production usage. Elastic Cloud Serverless projects are autoscaled environments, fully managed by Elastic and available on Elastic Cloud. Availability This functionality is generally available and ready for production usage. The Elastic Stack includes Elastic's core products such as Elasticsearch, Kibana, Logstash, and Beats. Availability This functionality is generally available and ready for production usage. Unless stated otherwise on the page, this functionality is available when your Elastic Stack is deployed on Elastic Cloud Hosted, Elastic Cloud Enterprise, Elastic Cloud on Kubernetes, and self-managed environments. This documentation corresponds to the latest patch available for each minor version. If you're not using the latest patch, check the release notes for changes.
Serverless Observability
Generally available
Serverless Security
Generally available
Stack
9.2+
Generally available since 9.2
| Version | 1.31.1 (View all) |
| Subscription level What's this? |
Basic |
| Developed by What's this? |
Elastic |
| Ingestion method(s) | Database, File |
| Minimum Kibana version(s) | 9.2.1 8.19.0 |
MySQL is an open-source Relational Database Management System (RDBMS) that enables users to store, manage, and retrieve structured data efficiently.
Database version compatibility across data streams.
| Data Stream | MySQL Version | MariaDB Version | Percona Version |
|---|---|---|---|
| error and slowlog | 5.5,5.7,8.0 |
10.1,10.2,10.3 |
5.7,5.8 |
| galera_status and status | 5.7,8.0 |
10.2,10.3,10.4 |
5.7,8.0 |
| replica_status | 5.7,8.0.22 |
10.4,10.5.1 |
5.7,8.0.22 |
MySQL and Percona from version 8.0.22 onwards and MariaDB from version 10.5.1 onwards support the SHOW REPLICA STATUS; query. Versions prior to these use the SHOW SLAVE STATUS; query.
The replica_status data stream supports master-slave or master-replica replication configurations as specified in the MySQL Replication Configuration documentation.
Use the MySQL integration to:
- Collect error and slow query logs, as well as status, galera status, and replication status metrics, to provide insights into database operations, query performance and replication health.
- Create informative visualizations to track usage trends, measure key metrics, and derive actionable business insights.
- Set up alerts to minimize Mean Time to Detect (MTTD) and Mean Time to Resolve (MTTR) by quickly referencing relevant logs during troubleshooting.
The MySQL integration collects logs and metrics data, providing comprehensive insights into database operations and performance.
Logs provide insights into the operations and events within the MySQL environment. The MySQL integration collects error logs helping users to track errors and warnings, understand their causes, and address database-related issues efficiently. This includes monitoring for slow-performing queries through the slowlog data stream, which is critical for identifying and resolving queries that negatively affect database performance.
Metrics offer statistics that reflect the performance and health of MySQL. The status data stream, for instance, gathers a variety of performance metrics, including connection errors, cache efficiency, and InnoDB storage engine details. The galera_status data stream offers a view into the health and performance of Galera Clusters, which is vital for the maintenance of distributed database systems. For replication health, the replica_status data stream provides metrics that shed light on the state of replication between the source and replica servers, ensuring the replication process is functioning correctly.
Data streams:
error: Collects error logs from the MySQL server, helping to detect and troubleshoot issues that may affect database functionality. This data stream includes information such as error messages, severities, and error codes.slowlog: Collects slow-performing queries that exceed a defined time threshold. This data stream includes details such as query execution time, lock time, rows affected, and the actual query text, which are crucial for pinpointing and optimizing slow queries.status: Collects various status and performance indicators, including connection errors, cache performance, binary log usage, network I/O, thread activity, and detailed InnoDB metrics, allowing for a thorough analysis of the MySQL server's health and efficiency.galera_status: Collects various status and performance metrics, which provide insights into cluster performance, including replication health and node status, to maintain the robustness and fault tolerance of the distributed database system.replica_status: Collects metrics related to status and performance of the replication process, including details from source and replica servers.performance: Monitors MySQL database performance by collecting metrics that help identify slow queries and track how database indexes are being used. This helps database administrators optimize their databases and troubleshoot performance issues.
You can monitor MySQL logs by using the logs-* index pattern in the Discover feature, while metrics can be viewed using the metrics-* index pattern.
You need Elasticsearch for storing and searching your data and Kibana for visualizing and managing it. You can use our hosted Elasticsearch Service on Elastic Cloud, which is recommended, or self-manage the Elastic Stack on your own hardware.
To ingest data from MySQL, you have to:
- Specify the hostname, username, and password to connect to the MySQL database. Additionally, the
replica_statusdata stream has a query parameter (the default query isSHOW REPLICA STATUS;, which you can change toSHOW SLAVE STATUS;). - For replica status metrics, set the MySQL DSN without credentials (for example
tcp(127.0.0.1:3306)/) and enter the username and password in the Username and Password fields. Do not put the password in the DSN. Passwords in the DSN are stored as plain text in the integration policy. Existing DSNs that still includeusername:password@continue to work if you leave Username and Password empty. Special characters in the Password field are supported. Do not percent-encode the username or password; the MySQL driver treats%xxas literal characters. Do not use a colon or single quote in the username. - Specify the paths of MySQL error logs and slow logs. (default paths are:- Error logs:
/var/log/mysql/error.log*and/var/log/mysqld.log*, Slow logs:/var/log/mysql/*-slow.log*and/var/lib/mysql/*-slow.log*)
Before you can start sending data to Elastic, make sure you have the necessary MySQL user permissions configured appropriately. Prefer the Username and Password fields instead of embedding credentials in a DSN.
To create a MySQL user with the correct permissions and configure this user account within the Elastic Agent integration for metric collection follow these steps:
Create a dedicated user for Elastic monitoring.
Connect to your MySQL server using a MySQL client with administrative privileges.
CREATE USER 'elastic_monitor'@'localhost' IDENTIFIED BY 'YourPasswordHere';NOTE: Prefer the Username and Password fields in the integration policy. If you embed credentials in a DSN string, characters such as
:,#, or'can break YAML or DSN parsing. Do not percent-encode MySQL passwords; the driver treats%xxas literal characters. Do not use a colon or single quote in the username.Grant the necessary permissions.
The
elastic_monitoruser needs specific permissions to retrieve metrics. Run the following commands to grant these permissions:GRANT PROCESS, SHOW DATABASES, REPLICATION CLIENT ON *.* TO'elastic_monitor'@'localhost';GRANT SELECT ONmysql.* TO 'elastic_monitor'@'localhost';GRANT SELECT ONsys.* TO 'elastic_monitor'@'localhost';GRANT SELECT ONperformance_schema.* TO 'elastic_monitor'@'localhost';For any specific databases you want to monitor, grant SELECT permission for each:
GRANT SELECT ONexample_db.* TO 'elastic_monitor'@'localhost';Replace
example_dbwith the actual name of the database you intend to monitor.Apply the permissions, run this command:
FLUSH PRIVILEGES;
For step-by-step instructions on how to set up an integration, check the Getting started guide.
After the integration is successfully configured, click the Assets tab of the MySQL Integration to display a list of the available dashboards. The dashboard should be populated with your configured data stream.
For MySQL, MariaDB and Percona, the query used to check replica status changes depending on the version of the database. You can adjust the query in the integration configuration accordingly.
The error dataset collects the MySQL error logs.
Example
{
    "@timestamp": "2024-12-09T06:18:16.552Z",
    "agent": {
        "ephemeral_id": "c74f8326-f9c7-4c1f-9dd6-5cd5efe550eb",
        "id": "4c979ea6-18d4-4c0b-92ed-d363d23d90b1",
        "name": "elastic-agent-73203",
        "type": "filebeat",
        "version": "8.17.0"
    },
    "data_stream": {
        "dataset": "mysql.error",
        "namespace": "79664",
        "type": "logs"
    },
    "ecs": {
        "version": "8.11.0"
    },
    "elastic_agent": {
        "id": "4c979ea6-18d4-4c0b-92ed-d363d23d90b1",
        "snapshot": true,
        "version": "8.17.0"
    },
    "event": {
        "agent_id_status": "verified",
        "category": [
            "database"
        ],
        "code": "MY-011068",
        "created": "2024-12-09T06:18:37.565Z",
        "dataset": "mysql.error",
        "ingested": "2024-12-09T06:18:40Z",
        "kind": "event",
        "provider": "Server",
        "timezone": "+00:00",
        "type": [
            "info"
        ]
    },
    "host": {
        "architecture": "x86_64",
        "containerized": true,
        "hostname": "elastic-agent-73203",
        "ip": [
            "192.168.255.2",
            "192.168.247.4"
        ],
        "mac": [
            "02-42-C0-A8-F7-04",
            "02-42-C0-A8-FF-02"
        ],
        "name": "elastic-agent-73203",
        "os": {
            "family": "",
            "kernel": "3.10.0-1160.92.1.el7.x86_64",
            "name": "Wolfi",
            "platform": "wolfi",
            "type": "linux",
            "version": "20230201"
        }
    },
    "input": {
        "type": "log"
    },
    "log": {
        "file": {
            "path": "/tmp/service_logs/mysql/05cec82c0c63-error.log"
        },
        "level": "Warning",
        "offset": 0
    },
    "message": "[MY-011068] [Server] The syntax '--skip-host-cache' is deprecated and will be removed in a future release. Please use SET GLOBAL host_cache_size=0 instead.",
    "mysql": {
        "thread_id": 0
    },
    "tags": [
        "mysql-error"
    ]
}
ECS Field Reference
Refer to the following document for detailed information on ECS fields.
Exported fields
| Field | Description | Type |
|---|---|---|
| @timestamp | Event timestamp. | date |
| cloud.image.id | Image ID for the cloud instance. | keyword |
| data_stream.dataset | Data stream dataset. | constant_keyword |
| data_stream.namespace | Data stream namespace. | constant_keyword |
| data_stream.type | Data stream type. | constant_keyword |
| event.dataset | Event dataset | constant_keyword |
| event.module | Event module | constant_keyword |
| host.containerized | If the host is a container. | boolean |
| host.os.build | OS build information. | keyword |
| host.os.codename | OS codename, if any. | keyword |
| input.type | Type of Filebeat input. | keyword |
| log.flags | Log flags. | keyword |
| log.offset | Offset of the entry in the log file. | long |
| mysql.thread_id | The connection or thread ID for the query. | long |
The slowlog dataset collects the MySQL slow logs.
Example
{
    "@timestamp": "2024-12-10T05:35:20.000Z",
    "agent": {
        "ephemeral_id": "b970821e-9579-4a3b-96db-0a751cb724de",
        "id": "15b0faf9-c42a-4f8b-81f3-827a45988d1c",
        "name": "elastic-agent-31305",
        "type": "filebeat",
        "version": "8.15.0"
    },
    "data_stream": {
        "dataset": "mysql.slowlog",
        "namespace": "17576",
        "type": "logs"
    },
    "ecs": {
        "version": "8.5.1"
    },
    "elastic_agent": {
        "id": "15b0faf9-c42a-4f8b-81f3-827a45988d1c",
        "snapshot": false,
        "version": "8.15.0"
    },
    "event": {
        "agent_id_status": "verified",
        "category": [
            "database"
        ],
        "dataset": "mysql.slowlog",
        "duration": 232000,
        "ingested": "2024-12-10T05:35:37Z",
        "kind": "event",
        "timezone": "+00:00",
        "type": [
            "info"
        ]
    },
    "host": {
        "architecture": "x86_64",
        "containerized": true,
        "hostname": "elastic-agent-31305",
        "id": "5c3f9f83eeec4f92817d995fce90f92f",
        "ip": [
            "192.168.242.2",
            "192.168.255.6"
        ],
        "mac": [
            "02-42-C0-A8-F2-02",
            "02-42-C0-A8-FF-06"
        ],
        "name": "elastic-agent-31305",
        "os": {
            "codename": "focal",
            "family": "debian",
            "kernel": "3.10.0-1160.92.1.el7.x86_64",
            "name": "Ubuntu",
            "platform": "ubuntu",
            "type": "linux",
            "version": "20.04.6 LTS (Focal Fossa)"
        }
    },
    "input": {
        "type": "log"
    },
    "log": {
        "file": {
            "path": "/tmp/service_logs/mysql/51910f9b766e-slow.log"
        },
        "flags": [
            "multiline"
        ],
        "offset": 510
    },
    "mysql": {
        "slowlog": {
            "bytes_sent": 115,
            "current_user": "root",
            "killed": "0",
            "last_errno": "0",
            "lock_time": {
                "sec": 0
            },
            "query": "select @@version_comment limit 1;",
            "rows_affected": 0,
            "rows_examined": 1,
            "rows_sent": 1
        },
        "thread_id": 8
    },
    "source": {
        "domain": "localhost"
    },
    "tags": [
        "mysql-slowlog"
    ],
    "user": {
        "name": "root"
    }
}
ECS Field Reference
Refer to the following document for detailed information on ECS fields.
Exported fields
| Field | Description | Type |
|---|---|---|
| @timestamp | Event timestamp. | date |
| cloud.image.id | Image ID for the cloud instance. | keyword |
| data_stream.dataset | Data stream dataset. | constant_keyword |
| data_stream.namespace | Data stream namespace. | constant_keyword |
| data_stream.type | Data stream type. | constant_keyword |
| event.dataset | Event dataset | constant_keyword |
| event.module | Event module | constant_keyword |
| host.containerized | If the host is a container. | boolean |
| host.os.build | OS build information. | keyword |
| host.os.codename | OS codename, if any. | keyword |
| input.type | Type of Filebeat input. | keyword |
| log.flags | Log flags. | keyword |
| log.offset | Offset of the entry in the log file. | long |
| mysql.slowlog.bytes_received | The number of bytes received from client. | long |
| mysql.slowlog.bytes_sent | The number of bytes sent to client. | long |
| mysql.slowlog.current_user | Current authenticated user, used to determine access privileges. Can differ from the value for user. | keyword |
| mysql.slowlog.filesort | Whether filesort optimization was used. | boolean |
| mysql.slowlog.filesort_on_disk | Whether filesort optimization was used and it needed temporary tables on disk. | boolean |
| mysql.slowlog.full_join | Whether a full join was needed for the slow query (no indexes were used for joins). | boolean |
| mysql.slowlog.full_scan | Whether a full table scan was needed for the slow query. | boolean |
| mysql.slowlog.innodb.io_r_bytes | Bytes read during page read operations. | long |
| mysql.slowlog.innodb.io_r_ops | Number of page read operations. | long |
| mysql.slowlog.innodb.io_r_wait.sec | How long it took to read all needed data from storage. | long |
| mysql.slowlog.innodb.pages_distinct | Approximated count of pages accessed to execute the query. | long |
| mysql.slowlog.innodb.queue_wait.sec | How long the query waited to enter the InnoDB queue and to be executed once in the queue. | long |
| mysql.slowlog.innodb.rec_lock_wait.sec | How long the query waited for locks. | long |
| mysql.slowlog.innodb.trx_id | Transaction ID | keyword |
| mysql.slowlog.killed | Code of the reason if the query was killed. | keyword |
| mysql.slowlog.last_errno | Last SQL error seen. | keyword |
| mysql.slowlog.lock_time.sec | The amount of time the query waited for the lock to be available. The value is in seconds, as a floating point number. | float |
| mysql.slowlog.log_slow_rate_limit | Slow log rate limit, a value of 100 means that one in a hundred queries or sessions are being logged. | long |
| mysql.slowlog.log_slow_rate_type | Type of slow log rate limit, it can be session if the rate limit is applied per session, or query if it applies per query. |
keyword |
| mysql.slowlog.merge_passes | Number of merge passes executed for the query. | long |
| mysql.slowlog.priority_queue | Whether a priority queue was used for filesort. | boolean |
| mysql.slowlog.query | The slow query. | keyword |
| mysql.slowlog.query_cache_hit | Whether the query cache was hit. | boolean |
| mysql.slowlog.read_first | The number of times the first entry in an index was read. | long |
| mysql.slowlog.read_key | The number of requests to read a row based on a key. | long |
| mysql.slowlog.read_last | The number of times the last key in an index was read. | long |
| mysql.slowlog.read_next | The number of requests to read the next row in key order. | long |
| mysql.slowlog.read_prev | The number of requests to read the previous row in key order. | long |
| mysql.slowlog.read_rnd | The number of requests to read a row based on a fixed position. | long |
| mysql.slowlog.read_rnd_next | The number of requests to read the next row in the data file. | long |
| mysql.slowlog.rows_affected | The number of rows modified by the query. | long |
| mysql.slowlog.rows_examined | The number of rows scanned by the query. | long |
| mysql.slowlog.rows_sent | The number of rows returned by the query. | long |
| mysql.slowlog.schema | The schema where the slow query was executed. | keyword |
| mysql.slowlog.sort_merge_passes | Number of merge passes that the sort algorithm has had to do. | long |
| mysql.slowlog.sort_range_count | Number of sorts that were done using ranges. | long |
| mysql.slowlog.sort_rows | Number of sorted rows. | long |
| mysql.slowlog.sort_scan_count | Number of sorts that were done by scanning the table. | long |
| mysql.slowlog.tmp_disk_tables | Number of temporary tables created on disk for this query. | long |
| mysql.slowlog.tmp_table | Whether a temporary table was used to resolve the query. | boolean |
| mysql.slowlog.tmp_table_on_disk | Whether the query needed temporary tables on disk. | boolean |
| mysql.slowlog.tmp_table_sizes | Size of temporary tables created for this query. | long |
| mysql.slowlog.tmp_tables | Number of temporary tables created for this query | long |
| mysql.thread_id | The connection or thread ID for the query. | long |
The galera_status dataset periodically fetches metrics from Galera-MySQL cluster servers.
Example
{
    "@timestamp": "2023-03-20T11:04:23.272Z",
    "agent": {
        "ephemeral_id": "c1cb5a26-c138-4c91-b980-e920faa46892",
        "id": "a6bbda96-646d-4211-bac8-b40bdd093a0c",
        "name": "docker-fleet-agent",
        "type": "metricbeat",
        "version": "8.6.0"
    },
    "data_stream": {
        "dataset": "mysql.galera_status",
        "namespace": "default",
        "type": "metrics"
    },
    "ecs": {
        "version": "8.11.0"
    },
    "elastic_agent": {
        "id": "a6bbda96-646d-4211-bac8-b40bdd093a0c",
        "snapshot": false,
        "version": "8.6.0"
    },
    "event": {
        "agent_id_status": "verified",
        "dataset": "mysql.galera_status",
        "duration": 17113542,
        "ingested": "2023-02-06T15:07:41Z",
        "module": "mysql"
    },
    "host": {
        "architecture": "x86_64",
        "containerized": false,
        "hostname": "docker-fleet-agent",
        "id": "589e678e8f3f457d81e3a530d3ae6011",
        "ip": [
            "172.28.0.7"
        ],
        "mac": [
            "02-42-AC-1C-00-07"
        ],
        "name": "docker-fleet-agent",
        "os": {
            "codename": "focal",
            "family": "debian",
            "kernel": "5.10.104-linuxkit",
            "name": "Ubuntu",
            "platform": "ubuntu",
            "type": "linux",
            "version": "20.04.5 LTS (Focal Fossa)"
        }
    },
    "metricset": {
        "name": "galera_status",
        "period": 10000
    },
    "mysql": {
        "galera_status": {
            "apply": {
                "oooe": 0,
                "oool": 0,
                "window": 0
            },
            "cert": {
                "deps_distance": 0,
                "index_size": 0,
                "interval": 0
            },
            "cluster": {
                "conf_id": 1,
                "size": 1,
                "status": "Primary"
            },
            "commit": {
                "oooe": 0,
                "window": 0
            },
            "connected": "ON",
            "evs": {
                "evict": "",
                "state": "OPERATIONAL"
            },
            "flow_ctl": {
                "paused": 0,
                "paused_ns": 0,
                "recv": 0,
                "sent": 0
            },
            "last_committed": 0,
            "local": {
                "bf_aborts": 0,
                "cert_failures": 0,
                "commits": 0,
                "recv": {
                    "queue": 0,
                    "queue_avg": 0,
                    "queue_max": 1,
                    "queue_min": 0
                },
                "replays": 0,
                "send": {
                    "queue": 0,
                    "queue_avg": 0.5,
                    "queue_max": 2,
                    "queue_min": 0
                },
                "state": "Synced"
            },
            "ready": "ON",
            "received": {
                "bytes": 147,
                "count": 2
            },
            "repl": {
                "bytes": 0,
                "count": 0,
                "data_bytes": 0,
                "keys": 0,
                "keys_bytes": 0,
                "other_bytes": 0
            }
        }
    },
    "service": {
        "address": "tcp(host.docker.internal:3306)/?readTimeout=10s&timeout=10s&writeTimeout=10s",
        "type": "mysql"
    }
}
ECS Field Reference
Refer to the following document for detailed information on ECS fields.
Exported fields
| Field | Description | Type | Metric Type |
|---|---|---|---|
| @timestamp | Event timestamp. | date | |
| agent.id | keyword | ||
| cloud.account.id | The cloud account or organization id used to identify different entities in a multi-tenant environment. Examples: AWS account id, Google Cloud ORG Id, or other unique identifier. | keyword | |
| cloud.availability_zone | Availability zone in which this host is running. | keyword | |
| cloud.image.id | Image ID for the cloud instance. | keyword | |
| cloud.instance.id | Instance ID of the host machine. | keyword | |
| cloud.provider | Name of the cloud provider. Example values are aws, azure, gcp, or digitalocean. | keyword | |
| cloud.region | Region in which this host is running. | keyword | |
| container.id | Unique container id. | keyword | |
| data_stream.dataset | Data stream dataset. | constant_keyword | |
| data_stream.namespace | Data stream namespace. | constant_keyword | |
| data_stream.type | Data stream type. | constant_keyword | |
| event.dataset | Event dataset | constant_keyword | |
| event.module | Event module | constant_keyword | |
| host.containerized | If the host is a container. | boolean | |
| host.name | Name of the host. It can contain what hostname returns on Unix systems, the fully qualified domain name, or a name specified by the user. The sender decides which value to use. |
keyword | |
| host.os.build | OS build information. | keyword | |
| host.os.codename | OS codename, if any. | keyword | |
| mysql.galera_status.apply.oooe | How often applier started write-set applying out-of-order (parallelization efficiency). | double | gauge |
| mysql.galera_status.apply.oool | How often write-set was so slow to apply that write-set with higher seqno's were applied earlier. Values closer to 0 refer to a greater gap between slow and fast write-sets. | double | gauge |
| mysql.galera_status.apply.window | Average distance between highest and lowest concurrently applied seqno. | double | gauge |
| mysql.galera_status.cert.deps_distance | Average distance between highest and lowest seqno value that can be possibly applied in parallel (potential degree of parallelization). | double | gauge |
| mysql.galera_status.cert.index_size | The number of entries in the certification index. | long | gauge |
| mysql.galera_status.cert.interval | Average number of transactions received while a transaction replicates. | double | gauge |
| mysql.galera_status.cluster.conf_id | Total number of cluster membership changes happened. | long | gauge |
| mysql.galera_status.cluster.size | Current number of members in the cluster. | long | gauge |
| mysql.galera_status.cluster.status | Status of this cluster component. That is, whether the node is part of a PRIMARY or NON_PRIMARY component. | keyword | |
| mysql.galera_status.commit.oooe | How often a transaction was committed out of order. | double | gauge |
| mysql.galera_status.commit.window | Average distance between highest and lowest concurrently committed seqno. | long | gauge |
| mysql.galera_status.connected | If the value is OFF, the node has not yet connected to any of the cluster components. This may be due to misconfiguration. Check the error log for proper diagnostics. | keyword | |
| mysql.galera_status.evs.evict | Lists the UUID's of all nodes evicted from the cluster. Evicted nodes cannot rejoin the cluster until you restart their mysqld processes. | keyword | |
| mysql.galera_status.evs.state | Shows the internal state of the EVS Protocol. | keyword | |
| mysql.galera_status.flow_ctl.paused | The fraction of time since the last FLUSH STATUS command that replication was paused due to flow control. In other words, how much the slave lag is slowing down the cluster. | double | gauge |
| mysql.galera_status.flow_ctl.paused_ns | The total time spent in a paused state measured in nanoseconds. | long | counter |
| mysql.galera_status.flow_ctl.recv | Returns the number of FC_PAUSE events the node has received, including those the node has sent. Unlike most status variables, the counter for this one does not reset every time you run the query. | long | counter |
| mysql.galera_status.flow_ctl.sent | Returns the number of FC_PAUSE events the node has sent. Unlike most status variables, the counter for this one does not reset every time you run the query. | long | counter |
| mysql.galera_status.last_committed | The sequence number, or seqno, of the last committed transaction. | long | counter |
| mysql.galera_status.local.bf_aborts | Total number of local transactions that were aborted by slave transactions while in execution. | long | counter |
| mysql.galera_status.local.cert_failures | Total number of local transactions that failed certification test. | long | counter |
| mysql.galera_status.local.commits | Total number of local transactions committed. | long | counter |
| mysql.galera_status.local.recv.queue | Current (instantaneous) length of the recv queue. | long | gauge |
| mysql.galera_status.local.recv.queue_avg | Recv queue length averaged over interval since the last FLUSH STATUS command. Values considerably larger than 0.0 mean that the node cannot apply write-sets as fast as they are received and will generate a lot of replication throttling. | double | gauge |
| mysql.galera_status.local.recv.queue_max | The maximum length of the recv queue since the last FLUSH STATUS command. | long | gauge |
| mysql.galera_status.local.recv.queue_min | The minimum length of the recv queue since the last FLUSH STATUS command. | long | gauge |
| mysql.galera_status.local.replays | Total number of transaction replays due to asymmetric lock granularity. | long | gauge |
| mysql.galera_status.local.send.queue | Current (instantaneous) length of the send queue. | long | gauge |
| mysql.galera_status.local.send.queue_avg | Send queue length averaged over time since the last FLUSH STATUS command. Values considerably larger than 0.0 indicate replication throttling or network throughput issue. | double | gauge |
| mysql.galera_status.local.send.queue_max | The maximum length of the send queue since the last FLUSH STATUS command. | long | gauge |
| mysql.galera_status.local.send.queue_min | The minimum length of the send queue since the last FLUSH STATUS command. | long | gauge |
| mysql.galera_status.local.state | Internal Galera Cluster FSM state number. | keyword | |
| mysql.galera_status.ready | Whether the server is ready to accept queries. | keyword | |
| mysql.galera_status.received.bytes | Total size of write-sets received from other nodes. | long | counter |
| mysql.galera_status.received.count | Total number of write-sets received from other nodes. | long | counter |
| mysql.galera_status.repl.bytes | Total size of write-sets replicated. | long | counter |
| mysql.galera_status.repl.count | Total number of write-sets replicated (sent to other nodes). | long | counter |
| mysql.galera_status.repl.data_bytes | Total size of data replicated. | long | counter |
| mysql.galera_status.repl.keys | Total number of keys replicated. | long | counter |
| mysql.galera_status.repl.keys_bytes | Total size of keys replicated. | long | counter |
| mysql.galera_status.repl.other_bytes | Total size of other bits replicated. | long | counter |
| service.address | Address where data about this service was collected from. This should be a URI, network address (ipv4:port or [ipv6]:port) or a resource path (sockets). | keyword |
The replica_status dataset collects data from MySQL by running a SHOW REPLICA STATUS; or SHOW SLAVE STATUS; query. This data stream provides information about the configuration and status of the connection between the replica server and the source server.
Example
{
    "@timestamp": "2024-07-17T12:14:12.628Z",
    "agent": {
        "ephemeral_id": "0958600a-590f-4be0-a91f-82235a00120f",
        "id": "090a47b3-6a4e-48ef-9fd8-d8ccb4246e98",
        "name": "docker-fleet-agent",
        "type": "metricbeat",
        "version": "8.12.0"
    },
    "data_stream": {
        "dataset": "mysql.replica_status",
        "namespace": "11434",
        "type": "metrics"
    },
    "ecs": {
        "version": "8.11.0"
    },
    "elastic_agent": {
        "id": "090a47b3-6a4e-48ef-9fd8-d8ccb4246e98",
        "snapshot": false,
        "version": "8.12.0"
    },
    "event": {
        "agent_id_status": "verified",
        "category": [
            "database"
        ],
        "dataset": "mysql.replica_status",
        "duration": 1456400,
        "ingested": "2024-07-17T12:14:24Z",
        "kind": "event",
        "module": "mysql",
        "type": [
            "info"
        ]
    },
    "host": {
        "architecture": "x86_64",
        "containerized": true,
        "hostname": "docker-fleet-agent",
        "id": "829324aac17946dcace17006fa82a2d2",
        "ip": [
            "192.168.241.7"
        ],
        "mac": [
            "02-42-C0-A8-F1-07"
        ],
        "name": "docker-fleet-agent",
        "os": {
            "codename": "focal",
            "family": "debian",
            "kernel": "3.10.0-1160.92.1.el7.x86_64",
            "name": "Ubuntu",
            "platform": "ubuntu",
            "type": "linux",
            "version": "20.04.6 LTS (Focal Fossa)"
        }
    },
    "metricset": {
        "name": "query",
        "period": 600000
    },
    "mysql": {
        "replica_status": {
            "connection": {
                "retry": {
                    "sec": 60
                }
            },
            "event_skip": {
                "count": 0
            },
            "gtid": {
                "executed": {
                    "set": "06d1322f-4436-11ef-b5bf-0242c0a8fb05:1-10"
                }
            },
            "is_auto_position": false,
            "is_io_thread_running": "Yes",
            "is_sql_thread_running": "Yes",
            "last_error": {
                "io": {
                    "number": 0
                },
                "number": 0,
                "sql": {
                    "number": 0
                }
            },
            "relay": {
                "log_file": "21764f9e14b8-relay-bin.000002",
                "log_position": 326,
                "log_space": 543
            },
            "replica": {
                "io": {
                    "state": "Waiting for source to send event"
                },
                "sql": {
                    "running_state": "Replica has read all relay log; waiting for more updates"
                }
            },
            "seconds_behind_source": 0,
            "source": {
                "binary_log_file": "mysql-bin.000003",
                "file_info": "mysql.slave_master_info",
                "host": {
                    "name": "mysql_master"
                },
                "is_get_public_key": false,
                "log_file": {
                    "relay": "mysql-bin.000003"
                },
                "log_position": {
                    "exec": 893,
                    "read": 893
                },
                "retry_count": 86400,
                "server": {
                    "id": 1,
                    "uuid": "06a246d4-4436-11ef-b5ed-0242c0a8fb02"
                },
                "ssl": {
                    "allowed": "No",
                    "is_verify_server_cert": false
                }
            },
            "thread": {
                "sql": {
                    "delay": {
                        "sec": 0
                    }
                }
            },
            "until": {
                "condition": "None",
                "log_position": 0
            }
        }
    },
    "service": {
        "address": "svc-mysql_replica:3306",
        "type": "mysql"
    },
    "source": {
        "port": 3306
    },
    "tags": [
        "mysql-replica_status"
    ],
    "user": {
        "name": "mydb_replica_user"
    }
}
ECS Field Reference
Refer to the following document for detailed information on ECS fields.
Exported fields
| Field | Description | Type | Metric Type |
|---|---|---|---|
| @timestamp | Event timestamp. | date | |
| data_stream.dataset | Data stream dataset. | constant_keyword | |
| data_stream.namespace | Data stream namespace. | constant_keyword | |
| data_stream.type | Data stream type. | constant_keyword | |
| host.name | Name of the host. It can contain what hostname returns on Unix systems, the fully qualified domain name (FQDN), or a name specified by the user. The recommended value is the lowercase FQDN of the host. | keyword | |
| mysql.replica_status.channel.name | The replication channel which is being displayed. There is always a default replication channel, and more replication channels can be added. | keyword | |
| mysql.replica_status.connection.retry.sec | The number of seconds between connect retries. | long | gauge |
| mysql.replica_status.event_skip.count | Number of events that a replica skips from the master, as recorded in the sql_slave_skip_counter system variable. | long | counter |
| mysql.replica_status.gtid.executed.set | The set of global transaction IDs written in the binary log. This is same as the value for the global gtid_executed system variable on this server, as well as the value for Executed_Gtid_Set in the output of SHOW MASTER STATUS on this server. | keyword | |
| mysql.replica_status.gtid.retrieved.set | The set of global transaction IDs corresponding to all transactions received by this replica. Empty if GTIDs are not in use. | keyword | |
| mysql.replica_status.gtid_io_position | Current global transaction ID value. | long | counter |
| mysql.replica_status.is_auto_position | True if GTID auto-positioning is in use for the channel, otherwise false. | boolean | |
| mysql.replica_status.is_gtid_using | Whether or not global transaction ID's are being used for replication (can be No, Slave_Pos, or Current_Pos). | keyword | |
| mysql.replica_status.is_io_thread_running | Whether the replication I/O (receiver) thread is started and has connected successfully to the source. | keyword | |
| mysql.replica_status.is_sql_thread_running | Whether the replication SQL (applier) thread is started. | keyword | |
| mysql.replica_status.last_error.io.message | The error message of the most recent error that caused the replication I/O (receiver) thread to stop. | keyword | |
| mysql.replica_status.last_error.io.number | The error number of the most recent error that caused the replication I/O (receiver) thread to stop. | long | gauge |
| mysql.replica_status.last_error.io.timestamp | A timestamp in YYMMDD hh:mm:ss format that shows when the most recent I/O error took place. | date | |
| mysql.replica_status.last_error.message | It is an alias of Last_SQL_Error. | keyword | |
| mysql.replica_status.last_error.number | It is an alias of Last_SQL_Errno. | long | gauge |
| mysql.replica_status.last_error.sql.message | The error message of the most recent error that caused the SQL thread to stop. | keyword | |
| mysql.replica_status.last_error.sql.number | The error number of the most recent error that caused the SQL thread to stop. | long | gauge |
| mysql.replica_status.last_error.sql.timestamp | A timestamp in YYMMDD hh:mm:ss format that shows when the most recent SQL error occurred. | date | |
| mysql.replica_status.parallel_mode | Controls what transactions are applied in parallel when using parallel replication. | keyword | |
| mysql.replica_status.relay.log_file | The name of the relay log file from which the SQL (applier) thread is currently reading and executing. | keyword | |
| mysql.replica_status.relay.log_position | The position in the current relay log file up to which the SQL (applier) thread has read and executed. | long | counter |
| mysql.replica_status.relay.log_space | The total combined size of all existing relay log files. | long | counter |
| mysql.replica_status.replica.ddl_groups | This status variable counts the occurrence of DDL statements. This is a replica-side counter for optimistic parallel replication. | long | counter |
| mysql.replica_status.replica.io.state | The current status of the replica. | keyword | |
| mysql.replica_status.replica.non_transactional_groups | This status variable counts the occurrence of non-transactional event groups. This is a replica-side counter for optimistic parallel replication. | long | counter |
| mysql.replica_status.replica.sql.running_state | The state of the SQL thread (analogous to Replica_IO_State). | keyword | |
| mysql.replica_status.replica.transactional_groups | This status variable counts the occurrence of transactional event groups. This is a replica-side counter for optimistic parallel replication. | long | counter |
| mysql.replica_status.replicate.do_db | The names of any databases that were specified with the --replicate-do-db option, or the CHANGE REPLICATION FILTER statement. | keyword | |
| mysql.replica_status.replicate.do_table | Tables specified with the replicate_do_table option. | keyword | |
| mysql.replica_status.replicate.ignore.do_db | The names of any databases that were specified with the --replicate-ignore-db option, or the CHANGE REPLICATION FILTER statement. | keyword | |
| mysql.replica_status.replicate.ignore.server_id | The server IDs that are currently being ignored for replication. | keyword | |
| mysql.replica_status.replicate.ignore.table | Tables specified for ignoring with the replicate_ignore_table option. | keyword | |
| mysql.replica_status.replicate.ignore.wild_table | Tables specified with replicate-wild-ignore-table option. | keyword | |
| mysql.replica_status.replicate.rewrite_db | This field displays any replication filtering rules that were specified. | keyword | |
| mysql.replica_status.replicate.wild_do_table | Tables specified for replicating with the replicate_wild_do_table option. | keyword | |
| mysql.replica_status.replicate_do_domain_ids | The do_domain_id option value for change master.(The DO_DOMAIN_IDS option for CHANGE MASTER can be used to configure a replica to only apply binary log events if the transaction's GTID is in a specific gtid_domain_id value.) | keyword | |
| mysql.replica_status.replicate_ignore_domain_ids | The ignore_domain_id option value for change master.(The IGNORE_DOMAIN_IDS option for CHANGE MASTER can be used to configure a replica to ignore binary log events if the transaction's GTID is in a specific gtid_domain_id value.) | keyword | |
| mysql.replica_status.seconds_behind_source | This field is an indication of how 'late' the replica is: : When the replica is actively processing updates, this field shows the difference between the current timestamp on the replica and the original timestamp logged on the source for the event currently being processed on the replica and when no event is currently being processed on the replica, this value is 0. | long | gauge |
| mysql.replica_status.source.binary_log_file | The name of the source binary log file from which the I/O (receiver) thread is currently reading. | keyword | |
| mysql.replica_status.source.bind.interface.name | The network interface that the replica is bound to, if any. | keyword | |
| mysql.replica_status.source.file_info | The location of the master.info file. | keyword | |
| mysql.replica_status.source.host.name | The source host that the replica is connected to. | keyword | |
| mysql.replica_status.source.is_get_public_key | Whether to request from the source the public key required for RSA key pair-based password exchange. | boolean | |
| mysql.replica_status.source.log_file.relay | The name of the source binary log file containing the most recent event executed by the SQL (applier) thread. | keyword | |
| mysql.replica_status.source.log_position.exec | The position in the current source binary log file to which the replication SQL thread has read and executed. | long | counter |
| mysql.replica_status.source.log_position.read | The position in the current source binary log file up to which the I/O (receiver) thread has read. | long | counter |
| mysql.replica_status.source.public_key_path | The path name to a file containing a replica-side copy of the public key required by the source. | keyword | |
| mysql.replica_status.source.retry_count | The number of times the replica can attempt to reconnect to the source in the event of a lost connection. | long | gauge |
| mysql.replica_status.source.server.id | Value of the server_id system variable from the source. | long | |
| mysql.replica_status.source.server.uuid | Value of the server_uuid system variable from the source. | keyword | |
| mysql.replica_status.source.ssl.allowed | Whether the replica supports SSL connections. | keyword | |
| mysql.replica_status.source.ssl.ca_file | The file used for the Certificate Authority (CA) certificate. | keyword | |
| mysql.replica_status.source.ssl.ca_path | The path to the Certificate Authority (CA) certificate. | keyword | |
| mysql.replica_status.source.ssl.cert | The name of the SSL certificate file. | keyword | |
| mysql.replica_status.source.ssl.cipher | The list of possible ciphers used in the handshake for the SSL connection. | keyword | |
| mysql.replica_status.source.ssl.crl | The SOURCE_SSL_CRL option of the CHANGE REPLICATION SOURCE TO Statement. | keyword | |
| mysql.replica_status.source.ssl.crl_path | The SOURCE_SSL_CRLPATH option of the CHANGE REPLICATION SOURCE TO Statement. | keyword | |
| mysql.replica_status.source.ssl.is_verify_server_cert | Whether to verify the server certificate. | boolean | |
| mysql.replica_status.source.ssl.key | The name of the SSL key file. | keyword | |
| mysql.replica_status.source.tls_version | The TLS version used on the source. | keyword | |
| mysql.replica_status.thread.sql.delay.sec | The number of seconds that the replica must lag the source. | long | gauge |
| mysql.replica_status.thread.sql.delay_remaining.sec | When Replica_SQL_Running_State is waiting until MASTER_DELAY seconds after source executed event, this field contains the number of delay seconds remaining. At other times, this field is NULL. | long | gauge |
| mysql.replica_status.until.condition | The values specified in the UNTIL clause of the START SLAVE statement. | keyword | |
| mysql.replica_status.until.log_file | Indicates the log file name that defines the coordinates at which the replication SQL thread stops executing. | keyword | |
| mysql.replica_status.until.log_position | Indicates the log file position that defines the coordinates at which the replication SQL thread stops executing. | long | counter |
| source.port | Port of the source. | long | |
| user.name | Short name or login of the user. | keyword | |
| user.name.text | Multi-field of user.name. |
match_only_text |
The MySQL status dataset collects data from MySQL by running a SHOW GLOBAL STATUS; SQL query. This query returns a large number of metrics.
Example
{
    "@timestamp": "2020-04-20T12:32:54.614Z",
    "agent": {
        "ephemeral_id": "4c773a2e-16d5-4d86-be49-cfb3573f4f4f",
        "hostname": "MacBook-Elastic.local",
        "id": "ede0be38-46a9-4ffc-8f1e-2ff9195193b6",
        "type": "metricbeat",
        "version": "8.0.0"
    },
    "ecs": {
        "version": "8.11.0"
    },
    "event": {
        "dataset": "mysql.status",
        "duration": 4708776,
        "module": "mysql"
    },
    "metricset": {
        "name": "status",
        "period": 10000
    },
    "mysql": {
        "status": {
            "aborted": {
                "clients": 0,
                "connects": 0
            },
            "binlog": {
                "cache": {
                    "disk_use": 0,
                    "use": 0
                }
            },
            "bytes": {
                "received": 38468,
                "sent": 1622162
            },
            "command": {
                "delete": 0,
                "insert": 0,
                "select": 155,
                "update": 0
            },
            "connections": 159,
            "created": {
                "tmp": {
                    "disk_tables": 0,
                    "files": 6,
                    "tables": 0
                }
            },
            "delayed": {
                "errors": 0,
                "insert_threads": 0,
                "writes": 0
            },
            "flush_commands": 1,
            "handler": {
                "commit": 5,
                "delete": 0,
                "external_lock": 552,
                "mrr_init": 0,
                "prepare": 0,
                "read": {
                    "first": 8,
                    "key": 6,
                    "last": 0,
                    "next": 1,
                    "prev": 0,
                    "rnd": 0,
                    "rnd_next": 59604
                },
                "rollback": 0,
                "savepoint": 0,
                "savepoint_rollback": 0,
                "update": 0,
                "write": 0
            },
            "innodb": {
                "buffer_pool": {
                    "bytes": {
                        "data": 7176192,
                        "dirty": 0
                    },
                    "pages": {
                        "data": 438,
                        "dirty": 0,
                        "flushed": 36,
                        "free": 7753,
                        "misc": 0,
                        "total": 8191
                    },
                    "pool": {
                        "reads": 405,
                        "wait_free": 0
                    },
                    "read": {
                        "ahead": 0,
                        "ahead_evicted": 0,
                        "ahead_rnd": 0,
                        "requests": 1488
                    },
                    "write_requests": 325
                }
            },
            "max_used_connections": 3,
            "open": {
                "files": 14,
                "streams": 0,
                "tables": 115
            },
            "opened_tables": 122,
            "queries": 479,
            "questions": 479,
            "threads": {
                "cached": 1,
                "connected": 2,
                "created": 3,
                "running": 2
            }
        }
    },
    "service": {
        "address": "127.0.0.1:3306",
        "type": "mysql"
    }
}
ECS Field Reference
Refer to the following document for detailed information on ECS fields.
Exported fields
| Field | Description | Type | Metric Type |
|---|---|---|---|
| @timestamp | Event timestamp. | date | |
| agent.id | keyword | ||
| cloud.account.id | The cloud account or organization id used to identify different entities in a multi-tenant environment. Examples: AWS account id, Google Cloud ORG Id, or other unique identifier. | keyword | |
| cloud.availability_zone | Availability zone in which this host is running. | keyword | |
| cloud.image.id | Image ID for the cloud instance. | keyword | |
| cloud.instance.id | Instance ID of the host machine. | keyword | |
| cloud.provider | Name of the cloud provider. Example values are aws, azure, gcp, or digitalocean. | keyword | |
| cloud.region | Region in which this host is running. | keyword | |
| container.id | Unique container id. | keyword | |
| data_stream.dataset | Data stream dataset. | constant_keyword | |
| data_stream.namespace | Data stream namespace. | constant_keyword | |
| data_stream.type | Data stream type. | constant_keyword | |
| event.dataset | Event dataset | constant_keyword | |
| event.module | Event module | constant_keyword | |
| host.containerized | If the host is a container. | boolean | |
| host.name | Name of the host. It can contain what hostname returns on Unix systems, the fully qualified domain name, or a name specified by the user. The sender decides which value to use. |
keyword | |
| host.os.build | OS build information. | keyword | |
| host.os.codename | OS codename, if any. | keyword | |
| mysql.status.aborted.clients | The number of connections that were aborted because the client died without closing the connection properly. | long | counter |
| mysql.status.aborted.connects | The number of failed attempts to connect to the MySQL server. | long | counter |
| mysql.status.binlog.cache.disk_use | long | counter | |
| mysql.status.binlog.cache.use | long | counter | |
| mysql.status.bytes.received | The number of bytes received from all clients. | long | counter |
| mysql.status.bytes.sent | The number of bytes sent to all clients. | long | counter |
| mysql.status.cache.ssl.hits | The number of SSL session cache hits. | long | counter |
| mysql.status.cache.ssl.misses | The number of SSL session cache misses. | long | counter |
| mysql.status.cache.ssl.size | The SSL session cache size. | long | counter |
| mysql.status.cache.table.open_cache.hits | The number of hits for open tables cache lookups. | long | counter |
| mysql.status.cache.table.open_cache.misses | The number of misses for open tables cache lookups. | long | counter |
| mysql.status.cache.table.open_cache.overflows | Number of times, after a table is opened or closed, a cache instance has an unused entry and the size of the instance is larger than table_open_cache / table_open_cache_instances | long | counter |
| mysql.status.command.delete | The number of DELETE queries since startup. | long | counter |
| mysql.status.command.insert | The number of INSERT queries since startup. | long | counter |
| mysql.status.command.select | The number of SELECT queries since startup. | long | counter |
| mysql.status.command.update | The number of UPDATE queries since startup. | long | counter |
| mysql.status.connection.errors.accept | The number of errors that occurred during calls to accept() on the listening port. | long | counter |
| mysql.status.connection.errors.internal | The number of connections refused due to internal errors in the server, such as failure to start a new thread or an out-of-memory condition. | long | counter |
| mysql.status.connection.errors.max | The number of connections refused because the server max_connections limit was reached. thread or an out-of-memory condition. | long | counter |
| mysql.status.connection.errors.peer_address | The number of errors that occurred while searching for connecting client IP addresses. | long | counter |
| mysql.status.connection.errors.select | The number of errors that occurred during calls to select() or poll() on the listening port. (Failure of this operation does not necessarily means a client connection was rejected.) | long | counter |
| mysql.status.connection.errors.tcpwrap | The number of connections refused by the libwrap library. | long | counter |
| mysql.status.connections | long | counter | |
| mysql.status.created.tmp.disk_tables | long | counter | |
| mysql.status.created.tmp.files | long | counter | |
| mysql.status.created.tmp.tables | long | counter | |
| mysql.status.delayed.errors | long | counter | |
| mysql.status.delayed.insert_threads | long | counter | |
| mysql.status.delayed.writes | long | counter | |
| mysql.status.flush_commands | long | counter | |
| mysql.status.handler.commit | The number of internal COMMIT statements. | long | counter |
| mysql.status.handler.delete | The number of times that rows have been deleted from tables. | long | counter |
| mysql.status.handler.external_lock | The server increments this variable for each call to its external_lock() function, which generally occurs at the beginning and end of access to a table instance. | long | counter |
| mysql.status.handler.mrr_init | The number of times the server uses a storage engine's own Multi-Range Read implementation for table access. | long | counter |
| mysql.status.handler.prepare | A counter for the prepare phase of two-phase commit operations. | long | counter |
| mysql.status.handler.read.first | The number of times the first entry in an index was read. | long | counter |
| mysql.status.handler.read.key | The number of requests to read a row based on a key. | long | counter |
| mysql.status.handler.read.last | The number of requests to read the last key in an index. | long | counter |
| mysql.status.handler.read.next | The number of requests to read the next row in key order. | long | counter |
| mysql.status.handler.read.prev | The number of requests to read the previous row in key order. | long | counter |
| mysql.status.handler.read.rnd | The number of requests to read a row based on a fixed position. | long | counter |
| mysql.status.handler.read.rnd_next | The number of requests to read the next row in the data file. | long | counter |
| mysql.status.handler.rollback | The number of requests for a storage engine to perform a rollback operation. | long | counter |
| mysql.status.handler.savepoint | The number of requests for a storage engine to place a savepoint. | long | counter |
| mysql.status.handler.savepoint_rollback | The number of requests for a storage engine to roll back to a savepoint. | long | counter |
| mysql.status.handler.update | The number of requests to update a row in a table. | long | counter |
| mysql.status.handler.write | The number of requests to insert a row in a table. | long | counter |
| mysql.status.innodb.buffer_pool.bytes.data | The total number of bytes in the InnoDB buffer pool containing data. | long | counter |
| mysql.status.innodb.buffer_pool.bytes.dirty | The total current number of bytes held in dirty pages in the InnoDB buffer pool. | long | counter |
| mysql.status.innodb.buffer_pool.dump_status | The progress of an operation to record the pages held in the InnoDB buffer pool, triggered by the setting of innodb_buffer_pool_dump_at_shutdown or innodb_buffer_pool_dump_now. | long | counter |
| mysql.status.innodb.buffer_pool.load_status | The progress of an operation to warm up the InnoDB buffer pool by reading in a set of pages corresponding to an earlier point in time, triggered by the setting of innodb_buffer_pool_load_at_startup or innodb_buffer_pool_load_now. | long | counter |
| mysql.status.innodb.buffer_pool.pages.data | The number of pages in the InnoDB buffer pool containing data. | long | gauge |
| mysql.status.innodb.buffer_pool.pages.dirty | The current number of dirty pages in the InnoDB buffer pool. | long | gauge |
| mysql.status.innodb.buffer_pool.pages.flushed | The number of requests to flush pages from the InnoDB buffer pool. | long | gauge |
| mysql.status.innodb.buffer_pool.pages.free | The number of free pages in the InnoDB buffer pool. | long | gauge |
| mysql.status.innodb.buffer_pool.pages.latched | The number of latched pages in the InnoDB buffer pool. | long | gauge |
| mysql.status.innodb.buffer_pool.pages.misc | The number of pages in the InnoDB buffer pool that are busy because they have been allocated for administrative overhead, such as row locks or the adaptive hash index. | long | gauge |
| mysql.status.innodb.buffer_pool.pages.total | The total size of the InnoDB buffer pool, in pages. | long | gauge |
| mysql.status.innodb.buffer_pool.pool.reads | The number of logical reads that InnoDB could not satisfy from the buffer pool, and had to read directly from disk. | long | counter |
| mysql.status.innodb.buffer_pool.pool.resize_status | The status of an operation to resize the InnoDB buffer pool dynamically, triggered by setting the innodb_buffer_pool_size parameter dynamically. | long | counter |
| mysql.status.innodb.buffer_pool.pool.wait_free | Normally, writes to the InnoDB buffer pool happen in the background. When InnoDB needs to read or create a page and no clean pages are available, InnoDB flushes some dirty pages first and waits for that operation to finish. This counter counts instances of these waits. | long | counter |
| mysql.status.innodb.buffer_pool.read.ahead | The number of pages read into the InnoDB buffer pool by the read-ahead background thread. | long | gauge |
| mysql.status.innodb.buffer_pool.read.ahead_evicted | The number of pages read into the InnoDB buffer pool by the read-ahead background thread that were subsequently evicted without having been accessed by queries. | long | gauge |
| mysql.status.innodb.buffer_pool.read.ahead_rnd | The number of "random" read-aheads initiated by InnoDB. | long | gauge |
| mysql.status.innodb.buffer_pool.read.requests | The number of logical read requests. | long | gauge |
| mysql.status.innodb.buffer_pool.write_requests | The number of writes done to the InnoDB buffer pool. | long | counter |
| mysql.status.innodb.rows.deleted | The number of rows deleted into InnoDB tables. | long | counter |
| mysql.status.innodb.rows.inserted | The number of rows inserted into InnoDB tables. | long | counter |
| mysql.status.innodb.rows.reads | The number of rows reads into InnoDB tables. | long | counter |
| mysql.status.innodb.rows.updated | The number of rows updated into InnoDB tables. | long | counter |
| mysql.status.max_used_connections | long | counter | |
| mysql.status.open.files | long | gauge | |
| mysql.status.open.streams | long | gauge | |
| mysql.status.open.tables | long | gauge | |
| mysql.status.opened_tables | long | counter | |
| mysql.status.queries | The number of statements executed by the server. This variable includes statements executed within stored programs, unlike the Questions variable. It does not count COM_PING or COM_STATISTICS commands. | long | counter |
| mysql.status.questions | The number of statements executed by the server. This includes only statements sent to the server by clients and not statements executed within stored programs, unlike the Queries variable. This variable does not count COM_PING, COM_STATISTICS, COM_STMT_PREPARE, COM_STMT_CLOSE, or COM_STMT_RESET commands. | long | counter |
| mysql.status.threads.cached | The number of cached threads. | long | gauge |
| mysql.status.threads.connected | The number of connected threads. | long | gauge |
| mysql.status.threads.created | The number of created threads. | long | gauge |
| mysql.status.threads.running | The number of running threads. | long | gauge |
| service.address | Address where data about this service was collected from. This should be a URI, network address (ipv4:port or [ipv6]:port) or a resource path (sockets). | keyword |
Alert rule templates provide pre-defined configurations for creating alert rules in Kibana.
For more information, refer to the Elastic documentation.
Alert rule templates require Elastic Stack version 9.2.0 or later.
The following alert rule templates are available:
[MySQL Galera] Cluster State Abnormal
[MySQL Replica] Replication Lag High
[MySQL Performance] Slow Query Latency High
This integration includes one or more Kibana dashboards that visualizes the data collected by the integration. The screenshots below illustrate how the ingested data is displayed.
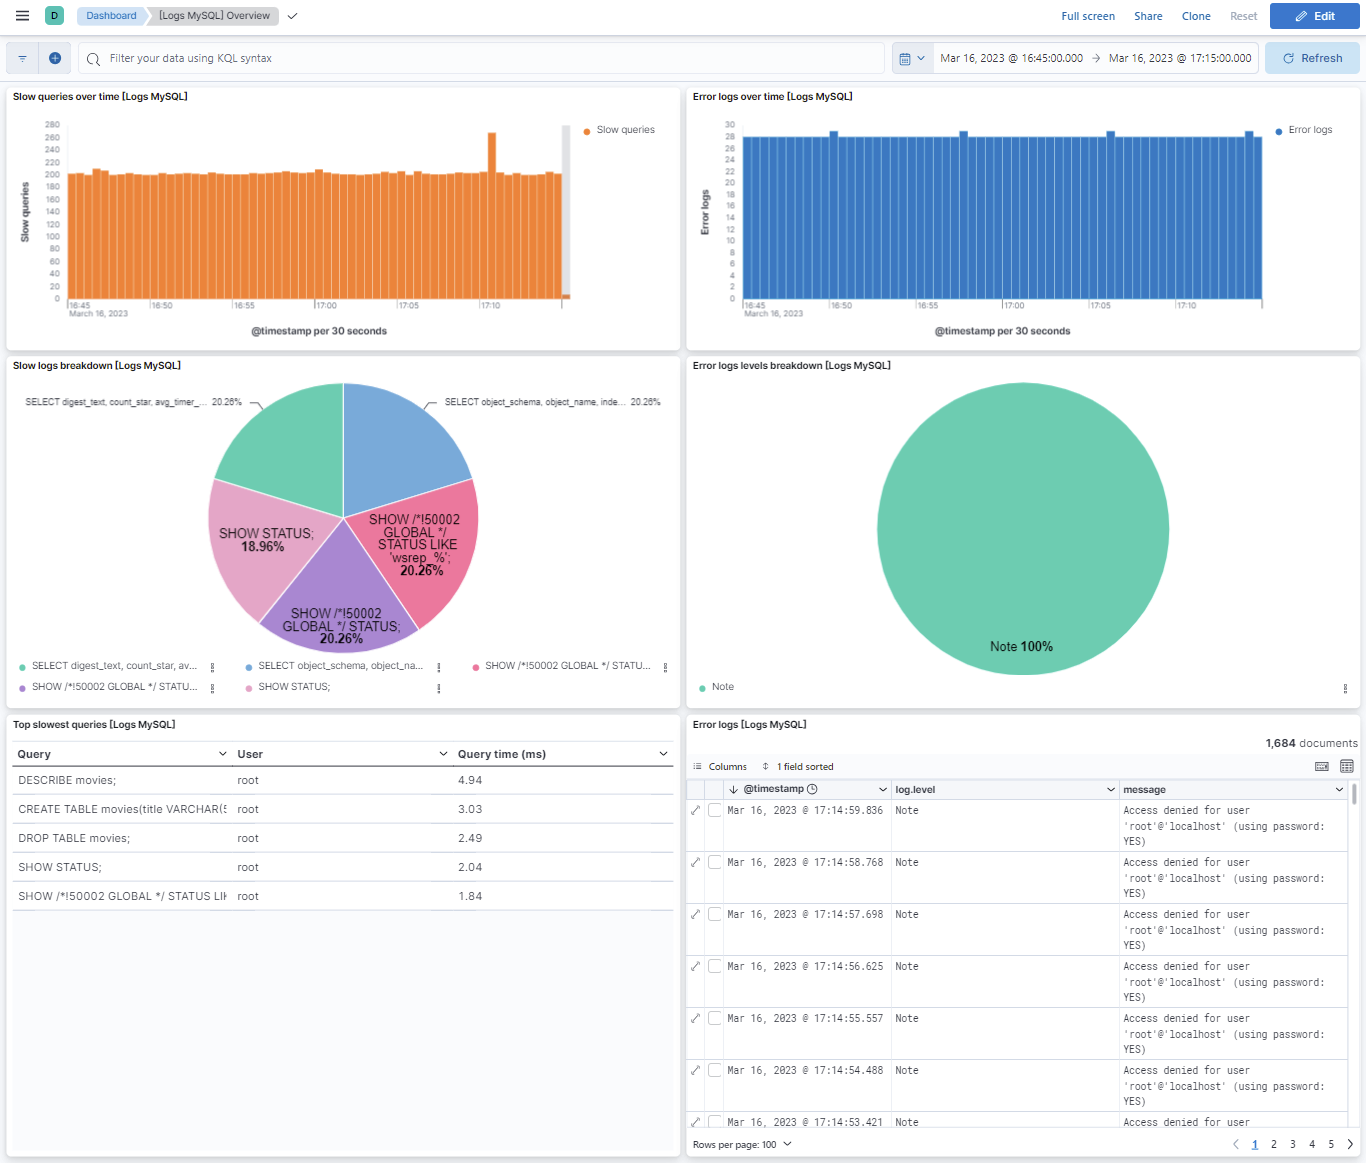
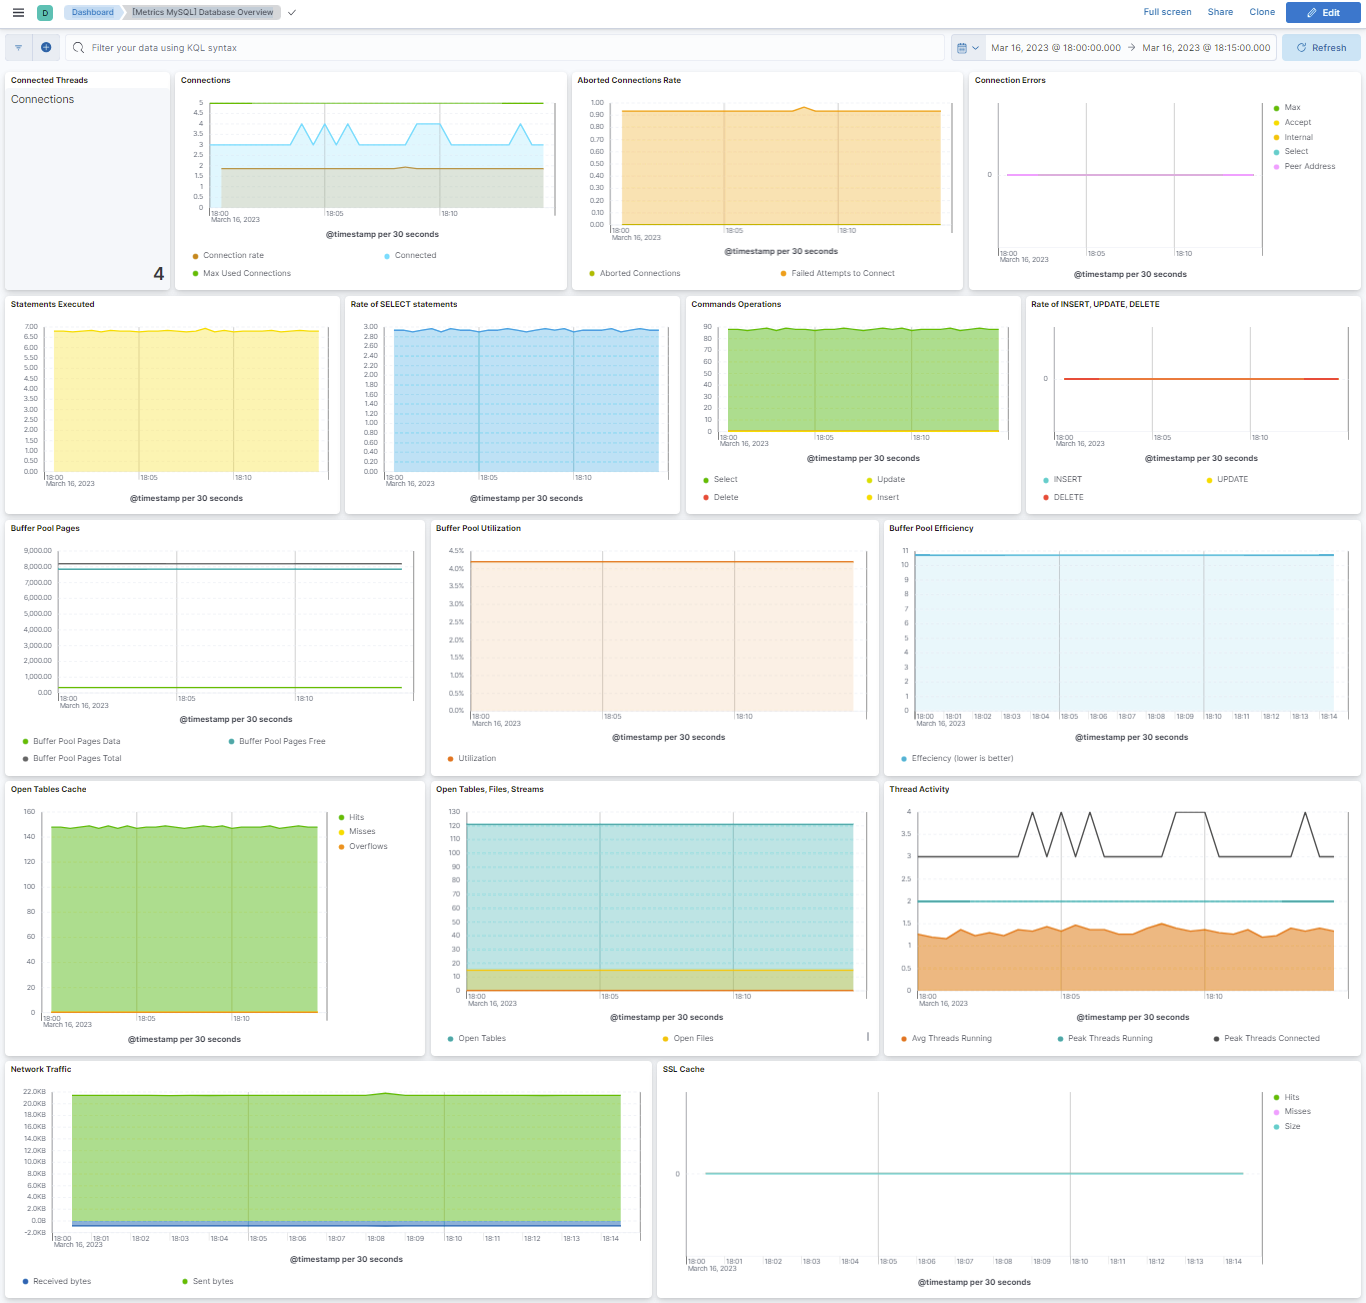
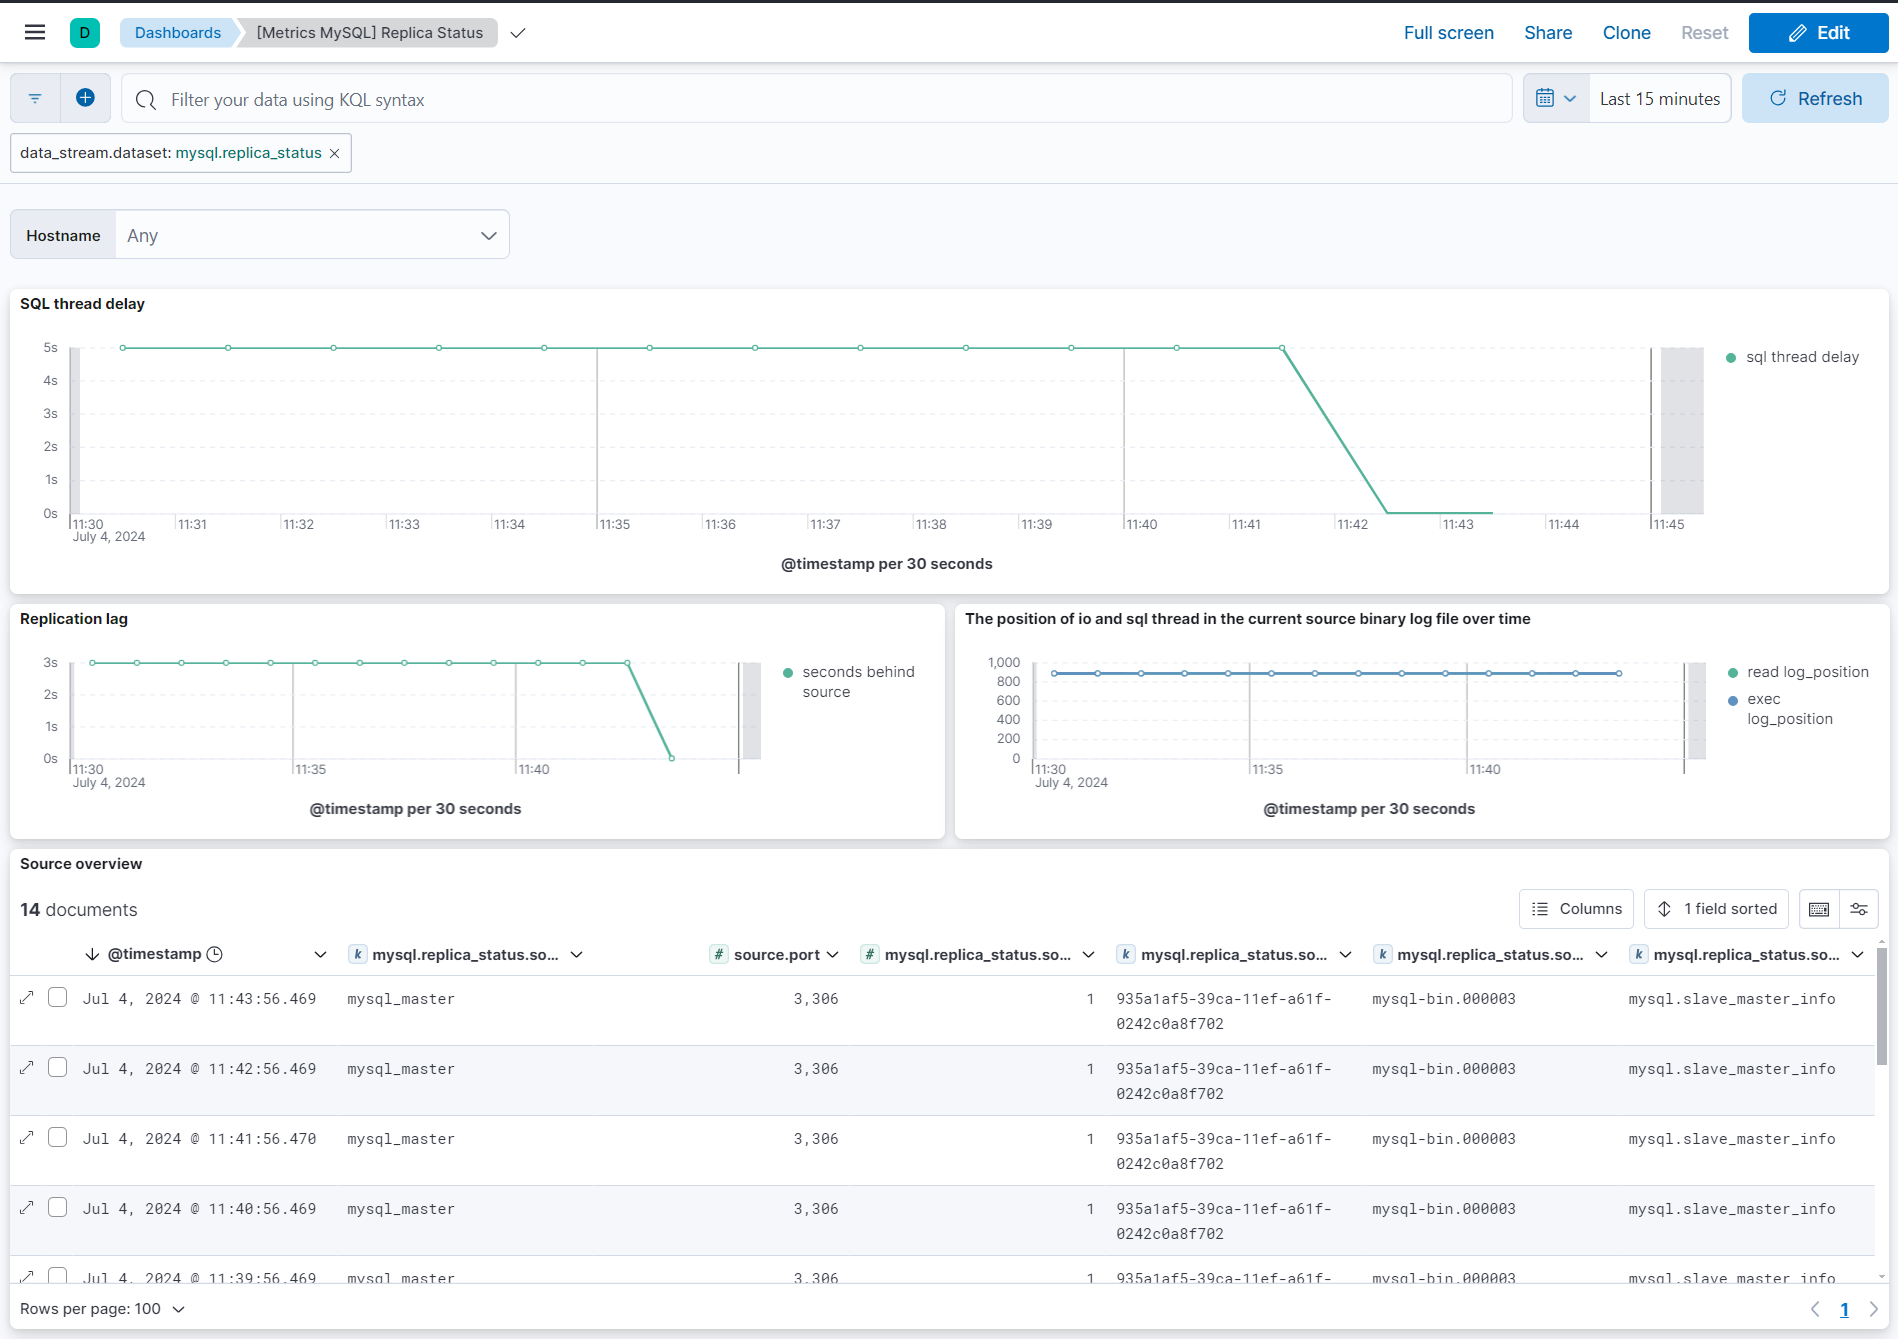
Changelog
| Version | Details | Minimum Kibana version |
|---|---|---|
| 1.31.1 | Enhancement (View pull request) Add ignore_older option to the mysql error and slowlog data streams. |
9.2.1 8.19.0 |
| 1.31.0 | Bug fix (View pull request) Hide replica status credentials by moving username and password out of the DSN into secret fields. Bug fix (View pull request) Remove the default MySQL metrics password so unused metric inputs do not store a Fleet secret. Bug fix (View pull request) Keep the replica status password in the DSN when it is set without a username, instead of silently dropping it. |
9.2.1 8.19.0 |
| 1.30.3 | Enhancement (View pull request) change mapping for mysql.performance.events_statements.digest and mysql.performance.events_statements.digest.text. |
9.2.1 8.19.0 |
| 1.30.2 | Enhancement (View pull request) Add group field to package manifest. |
9.2.1 8.19.0 |
| 1.30.1 | Enhancement (View pull request) Update package title and description to improve clarity of use. |
9.2.1 8.19.0 |
| 1.30.0 | Enhancement (View pull request) Add ability to set condition for logs and metrics. |
9.2.1 8.19.0 |
| 1.29.2 | Bug fix (View pull request) Fix alerting rule templates names. |
9.2.1 8.19.0 |
| 1.29.1 | Enhancement (View pull request) Update README with alerting rule templates. |
9.2.1 8.19.0 |
| 1.29.0 | Enhancement (View pull request) Add alerting rule templates. |
9.2.1 8.19.0 |
| 1.28.1 | Enhancement (View pull request) Update MySQL Integration documentation with the required privileges. |
9.0.0 8.15.0 |
| 1.28.0 | Enhancement (View pull request) Allow @custom pipeline access to event.original without setting preserve_original_event. |
9.0.0 8.15.0 |
| 1.27.1 | Bug fix (View pull request) Fix healthcheck. |
9.0.0 8.15.0 |
| 1.27.0 | Enhancement (View pull request) Add a flag fips_compatible to control whether the package is allowed in the ECH FedRAMP High environment. |
9.0.0 8.15.0 |
| 1.26.3 | Enhancement (View pull request) Fix the documentation formatting and text. |
9.0.0 8.15.0 |
| 1.26.2 | Bug fix (View pull request) Fix table and edits on MySQL Integration documentation. |
9.0.0 8.15.0 |
| 1.26.1 | Bug fix (View pull request) Added description to ssl nodes including links to documentation. |
9.0.0 8.15.0 |
| 1.26.0 | Enhancement (View pull request) Add support for Kibana 9.0.0. |
9.0.0 8.15.0 |
| 1.25.3 | Bug fix (View pull request) Update links to getting started docs |
8.15.0 |
| 1.25.2 | Bug fix (View pull request) Fix optional chaining in the replica_status data stream pipeline. |
8.15.0 |
| 1.25.1 | Enhancement (View pull request) Update README to clarify the setup information for replica_status data stream. |
8.15.0 |
| 1.25.0 | Enhancement (View pull request) Add schemaname field in the performance data stream. |
8.15.0 |
| 1.24.0 | Enhancement (View pull request) Add replica_status data stream. |
8.14.0 |
| 1.23.0 | Enhancement (View pull request) Add processor support for galera_status, performance and status data streams. |
8.14.0 |
| 1.22.0 | Enhancement (View pull request) ECS version updated to 8.11.0. Modified the field definitions to remove ECS fields made redundant by the ecs@mappings component template. |
8.14.0 |
| 1.21.0 | Enhancement (View pull request) Add global filter on data_stream.dataset to improve performance. |
8.14.0 |
| 1.20.0 | Enhancement (View pull request) Add SSL support. |
8.14.0 |
| 1.19.0 | Enhancement (View pull request) Enable secrets for sensitive fields. For more details, refer https://www.elastic.co/guide/en/fleet/current/agent-policy.html#agent-policy-secret-values |
8.12.0 |
| 1.18.2 | Bug fix (View pull request) Disable secrets for older stack versions due to errors. |
8.8.2 |
| 1.18.1 | Bug fix (View pull request) Add missing dimension to the performance datastream. |
8.8.2 |
| 1.18.0 | Enhancement (View pull request) Enable 'secret' for the sensitive fields, supported from 8.12. |
8.8.2 |
| 1.17.0 | Enhancement (View pull request) Add support for tags, processors and the preserve_original_event to the error and slowlog datastreams. |
8.8.2 |
| 1.16.0 | Enhancement (View pull request) Update the package format_version to 3.0.0. |
8.8.2 |
| 1.15.0 | Enhancement (View pull request) Enable time series data streams for the metrics datasets. This dramatically reduces storage for metrics and is expected to progressively improve query performance. For more details, see https://www.elastic.co/guide/en/elasticsearch/reference/current/tsds.html. |
8.8.2 |
| 1.14.0 | Enhancement (View pull request) Migrate Database Overview dashboard visualizations to lens. |
8.8.0 |
| 1.13.0 | Enhancement (View pull request) Migrate Logs Overview dashboard visualizations to lens. |
8.8.0 |
| 1.12.4 | Bug fix (View pull request) Fix to correct the aggregate function used in dashboard for fields having metric_type value counter. |
8.8.0 |
| 1.12.3 | Enhancement (View pull request) Add dimensions for TSDB enablement for performance datastream. |
8.8.0 |
| 1.12.2 | Bug fix (View pull request) Modifed the dimension field mapping to support public cloud deployment. |
8.0.0 7.14.0 |
| 1.12.1 | Enhancement (View pull request) Add system test cases for performance datastream |
8.0.0 7.14.0 |
| 1.12.0 | Enhancement (View pull request) Rename ownership from obs-service-integrations to obs-infraobs-integrations |
8.0.0 7.14.0 |
| 1.11.0 | Enhancement (View pull request) Added system test cases for galera_status datastream |
8.0.0 7.14.0 |
| 1.10.0 | Enhancement (View pull request) Add dimension fields to all status and gallera_status datastream to support TSDB enablement. |
8.0.0 7.14.0 |
| 1.9.0 | Enhancement (View pull request) Added metric type mapping for galera_status datastream |
8.0.0 7.14.0 |
| 1.8.0 | Enhancement (View pull request) Added metric type mapping for status datastream |
8.0.0 7.14.0 |
| 1.7.0 | Enhancement (View pull request) Added metric type mapping for performance datastream |
8.0.0 7.14.0 |
| 1.6.1 | Enhancement (View pull request) Added categories and/or subcategories. |
— |
| 1.6.0 | Enhancement (View pull request) Update ECS to 8.5.1 |
8.0.0 7.14.0 |
| 1.5.1 | Bug fix (View pull request) Update mysql slowlog pipeline to parse schema name with dash. |
8.0.0 7.14.0 |
| 1.5.0 | Enhancement (View pull request) Update ingest pipeline for performance datastream. |
8.0.0 7.14.0 |
| 1.4.0 | Enhancement (View pull request) Added infrastructure category. |
8.0.0 7.14.0 |
| 1.3.2 | Bug fix (View pull request) Add Performance Config |
8.0.0 7.14.0 |
| 1.3.1 | Enhancement (View pull request) Add documentation for multi-fields |
8.0.0 7.14.0 |
| 1.3.0 | Enhancement (View pull request) Update to ECS 8.0 |
8.0.0 7.14.0 |
| 1.2.1 | Bug fix (View pull request) Change test public IPs to the supported subset |
8.0.0 7.14.0 |
| 1.2.0 | Enhancement (View pull request) Release package for v8.0.0 |
— |
| 1.1.1 | Enhancement (View pull request) Uniform with guidelines |
7.14.0 |
| 1.1.0 | Enhancement (View pull request) Update to ECS 1.12.0 |
7.14.0 |
| 1.0.0 | Enhancement (View pull request) Release MySQL as GA |
— |
| 0.6.0 | Enhancement (View pull request) Update integration description |
— |
| 0.5.0 | Bug fix (View pull request) Fix logs overview dashboard Enhancement (View pull request) Release as beta |
7.14.0 |
| 0.4.0 | Enhancement (View pull request) Sync latest changes from beats Enhancement (View pull request) Disable performance data stream by default in consistence with Beats Enhancement (View pull request) Enable ECS dependency Enhancement (View pull request) Set "event.module" and "event.dataset" |
— |
| 0.3.8 | Enhancement (View pull request) Updating package owner |
— |
| 0.3.7 | Bug fix (View pull request) Correct sample event file. |
— |
| 0.1.0 | Enhancement (View pull request) initial release |
— |