Nginx Ingress Controller Integration
Elastic Cloud Serverless projects are autoscaled environments, fully managed by Elastic and available on Elastic Cloud. Availability This functionality is in technical preview and is ready for evaluation. Use with caution in production; it is not recommended for mission-critical workloads. Elastic will work to fix any issues, but features in technical preview are not subject to the support SLA of official GA features. Specific Support terms apply. Elastic Cloud Serverless projects are autoscaled environments, fully managed by Elastic and available on Elastic Cloud. Availability This functionality is in technical preview and is ready for evaluation. Use with caution in production; it is not recommended for mission-critical workloads. Elastic will work to fix any issues, but features in technical preview are not subject to the support SLA of official GA features. Specific Support terms apply. The Elastic Stack includes Elastic's core products such as Elasticsearch, Kibana, Logstash, and Beats. Availability This functionality is in technical preview and is ready for evaluation. Use with caution in production; it is not recommended for mission-critical workloads. Elastic will work to fix any issues, but features in technical preview are not subject to the support SLA of official GA features. Specific Support terms apply. Unless stated otherwise on the page, this functionality is available when your Elastic Stack is deployed on Elastic Cloud Hosted, Elastic Cloud Enterprise, Elastic Cloud on Kubernetes, and self-managed environments. This documentation corresponds to the latest patch available for each minor version. If you're not using the latest patch, check the release notes for changes.
Serverless Observability
Preview
Preview
Serverless Security
Preview
Preview
Stack
Preview
9.0+
Preview since 9.0
| Version | 0.4.2 Availability Preview This functionality is in technical preview and is ready for evaluation. Use with caution in production; it is not recommended for mission-critical workloads. Elastic will work to fix any issues, but features in technical preview are not subject to the support SLA of official GA features. Specific Support terms apply. (View all) |
| Subscription level What's this? |
Basic |
| Developed by What's this? |
Elastic |
| Minimum Kibana version(s) | 9.0.0 8.16.0 |
To use pre-release integrations, go to the Integrations page in Kibana, scroll down, and toggle on the Display beta integrations option.
This integration collects and parses logs from Nginx Ingress Controller instances. It can parse access and error logs created by the ingress.
The integration was tested with the Nginx Ingress Controller v0.30.0 and v0.40.2. The log format is described here.
EDOT collector supported versions: 8.16.0
OpenTelemetry collector components:
- Filelog receiver v0.112.0+
- Transform processor v0.112.0+
- Resource detector processor v0.112.0+
- (Optional) GeoIP processor v0.112.0+: The optional GeoIP processor is not available in the EDOT collector yet. To use this processor, you must switch to the OpenTelemetry Contrib collector instead.
- Elasticsearch exporter v0.112.0+
- Filestorage extension v0.112.0+
extensions:
  file_storage:

receivers:
  filelog:
    include_file_path: true
    include: [/var/log/pods/*nginx-ingress-nginx-controller*/controller/*.log]
    operators:
      - id: container-parser
        type: container

processors:
  transform/parse_nginx_ingress_error/log:
    error_mode: ignore
    log_statements:
      - context: log
        conditions:
            # ^[EWF]: Matches logs starting with E (Error), W (Warning), or F (Fatal).
            # \d{4}: Matches the four digits after the log level (representing the date, like 1215 for December 15).
            # .+: Matches the rest of the log line (the message part, without needing specific timestamp or file format).
          - IsMatch(body, "^[EWF]\\d{4} .+")
        statements:
          - set(body, ExtractGrokPatterns(body, "%{LOG_LEVEL:log.level}%{MONTHNUM}%{MONTHDAY} %{HOUR}:%{MINUTE}:%{SECOND}\\.%{MICROS}%{SPACE}%{NUMBER:thread_id} %{SOURCE_FILE:source.file.name}:%{NUMBER:source.line_number}\\] %{GREEDYMULTILINE:message}", true, ["LOG_LEVEL=[A-Z]", "MONTHNUM=(0[1-9]|1[0-2])", "MONTHDAY=(0[1-9]|[12][0-9]|3[01])", "HOUR=([01][0-9]|2[0-3])", "MINUTE=[0-5][0-9]", "SECOND=[0-5][0-9]", "MICROS=[0-9]{6}", "SOURCE_FILE=[^:]+", "GREEDYMULTILINE=(.|\\n)*"]))

          - set(attributes["data_stream.dataset"], "nginx_ingress_controller.error")

          # LogRecord event: https://github.com/open-telemetry/semantic-conventions/pull/982
          - set(attributes["event.name"], "nginx_ingress_controller.error")

  transform/parse_nginx_ingress_access/log:
    error_mode: ignore
    log_statements:
      - context: log
        conditions:
            #
            #
            #
          - IsMatch(body, "^([0-9a-fA-F:.]+) - [^ ]+ .*[0-9a-fA-F]+$")
        statements:
          # Log format: https://github.com/kubernetes/ingress-nginx/blob/nginx-0.30.0/docs/user-guide/nginx-configuration/log-format.md
          # Based on https://github.com/elastic/integrations/blob/main/packages/nginx_ingress_controller/data_stream/access/elasticsearch/ingest_pipeline/default.yml
          - set(body, ExtractGrokPatterns(body, "(%{NGINX_HOST} )?\"?(?:%{NGINX_ADDRESS_LIST:nginx_ingress_controller.access.remote_ip_list}|%{NOTSPACE:source.address}) - (-|%{DATA:user.name}) \\[%{HTTPDATE:nginx_ingress_controller.access.time}\\] \"%{DATA:nginx_ingress_controller.access.info}\" %{NUMBER:http.response.status_code:long} %{NUMBER:http.response.body.size:long} \"(-|%{DATA:http.request.referrer})\" \"(-|%{DATA:user_agent.original})\" %{NUMBER:http.request.size:long} %{NUMBER:http.request.time:double} \\[%{DATA:upstream.name}\\] \\[%{DATA:upstream.alternative_name}\\] (%{UPSTREAM_ADDRESS_LIST:upstream.address}|-) (%{UPSTREAM_RESPONSE_SIZE_LIST:upstream.response.size_list}|-) (%{UPSTREAM_RESPONSE_TIME_LIST:upstream.response.time_list}|-) (%{UPSTREAM_RESPONSE_STATUS_CODE_LIST:upstream.response.status_code_list}|-) %{GREEDYDATA:http.request.id}", true, ["NGINX_HOST=(?:%{IP:destination.ip}|%{NGINX_NOTSEPARATOR:destination.domain})(:%{NUMBER:destination.port})?", "NGINX_NOTSEPARATOR=[^\t ,:]+", "NGINX_ADDRESS_LIST=(?:%{IP}|%{WORD}) (\"?,?\\s*(?:%{IP}|%{WORD}))*", "UPSTREAM_ADDRESS_LIST=(?:%{IP}(:%{NUMBER})?)(\"?,?\\s*(?:%{IP}(:%{NUMBER})?))*", "UPSTREAM_RESPONSE_SIZE_LIST=(?:%{NUMBER})(\"?,?\\s*(?:%{NUMBER}))*", "UPSTREAM_RESPONSE_TIME_LIST=(?:%{NUMBER})(\"?,?\\s*(?:%{NUMBER}))*", "UPSTREAM_RESPONSE_STATUS_CODE_LIST=(?:%{NUMBER})(\"?,?\\s*(?:%{NUMBER}))*", "IP=(?:\\[?%{IPV6}\\]?|%{IPV4})"]))
          - merge_maps(body, ExtractGrokPatterns(body["nginx_ingress_controller.access.info"], "%{WORD:http.request.method} %{DATA:url.original} HTTP/%{NUMBER:http.version}", true), "upsert")
          - delete_key(body, "nginx_ingress_controller.access.info")

          # Extra URL parsing
          - merge_maps(body, URL(body["url.original"]), "upsert")
          - set(body["url.domain"], body["destination.domain"])

          # set source.address as attribute for GeoIP processor
          - set(attributes["source.address"], body["source.address"])

          - set(attributes["data_stream.dataset"], "nginx_ingress_controller.access")

          # LogRecord event: https://github.com/open-telemetry/semantic-conventions/pull/982
          - set(attributes["event.name"], "nginx_ingress_controller.access")
          - set(attributes["event.timestamp"], String(Time(body["nginx_ingress_controller.access.time"], "%d/%b/%Y:%H:%M:%S %z")))

          - delete_key(body, "nginx_ingress_controller.access.time")

      - context: log
        conditions:
            # Extract user agent when not empty
          - body["user_agent.original"] != nil
        statements:
          # Extract UserAgent
          # TODO: UserAgent OTTL function does not provide os specific metadata yet: https://github.com/open-telemetry/opentelemetry-collector-contrib/issues/35458
          - merge_maps(body, UserAgent(body["user_agent.original"]), "upsert")

      - context: log
        conditions:
          - body["upstream.response.time_list"] != nil
        statements:
          # Extract comma separated list
          # TODO: We would like to get the sum over all upstream.response.time_list values instead of providing a slice with all the values
          - set(body["upstream.response.time"], Split(body["upstream.response.time_list"], ","))
          - delete_key(body, "upstream.response.time_list")

      - context: log
        conditions:
          - body["upstream.response.size_list"] != nil
        statements:
          # Extract comma separated list
          # TODO: We would like to get the Last upstream.response.size_list value instead of providing a slice with all the values
          # See: https://github.com/elastic/integrations/blob/main/packages/nginx_ingress_controller/data_stream/access/elasticsearch/ingest_pipeline/default.yml#L94b
          - set(body["upstream.response.size"], Split(body["upstream.response.size_list"], ","))
          - delete_key(body, "upstream.response.size_list")

      - context: log
        conditions:
          - body["upstream.response.status_code_list"] != nil
        statements:
          # Extract comma separated list
          # TODO: We would like to get the Last upstream.response.status_code_list value instead of providing a slice with all the values
          - set(body["upstream.response.status_code"], Split(body["upstream.response.status_code_list"], ","))
          - delete_key(body, "upstream.response.status_code_list")

  # TODO: add other detectors
  resourcedetection/system:
    detectors: ["system"]
    system:
      hostname_sources: [ "os" ]
      resource_attributes:
        host.name:
          enabled: true
        host.id:
          enabled: false
        host.arch:
          enabled: true

  # geoip:
  #   context: record
  #   providers:
  #     maxmind:
  #       database_path: /tmp/GeoLite2-City.mmdb

exporters:
  elasticsearch:
    endpoints:
    - YOUR_ELASTICSEARCH_ENDPOINT
    api_key: YOUR_ELASTICSEARCH_API_KEY
    logs_dynamic_index:
      enabled: true
    mapping:
      mode: otel
  debug:
    verbosity: detailed

service:
  extensions: [file_storage]
  pipelines:
    logs:
      receivers: [filelog]
      processors: [transform/parse_nginx_ingress_access/log, transform/parse_nginx_ingress_error/log, resourcedetection/system]
      # Uncomment the following line if geoip is configured
      # processors: [transform/parse_nginx_ingress_access/log, transform/parse_nginx_ingress_error/log, geoip, resourcedetection/system]
      exporters: [debug, elasticsearch]
- ^([0-9a-fA-F:.]+): Matches the remote address (IPv4 or IPv6 format).
- [^ ]+: Matches the remote user (including the hyphen for missing user).
- .*[0-9a-fA-F]+$: Ensures the log line ends with a hexadecimal string (request ID).
Don't forget to replace:
YOUR_ELASTICSEARCH_ENDPOINT: your Elasticsearch endpoint (withhttps://prefix example:https://1234567.us-west2.gcp.elastic-cloud.com:443).YOUR_ELASTICSEARCH_API_KEY: your Elasticsearch API Key
The Geographical IP metadata for incoming Nginx Ingress controller requests is disabled by default. To enable it, you need to provide a local GeoIP database path in the processors' configuration:
- Uncomment the GeoIP processors configuration:
geoip:
 context: record
 providers:
   maxmind:
     database_path: /tmp/GeoLite2-City.mmdb
- Include the processors in the logs pipeline:
processors: [transform/parse_nginx_ingress_access/log, transform/parse_nginx_ingress_error/log, geoip, resourcedetection/system]
The access data stream collects the Nginx Ingress Controller access logs.
Exported fields
| Field | Description | Type |
|---|---|---|
| @timestamp | Event timestamp. | date |
| data_stream.dataset | Data stream dataset. | constant_keyword |
| data_stream.namespace | Data stream namespace. | constant_keyword |
| data_stream.type | Data stream type. | constant_keyword |
| event.name | Event name | constant_keyword |
| resource.attributes.k8s.cluster.name | keyword | |
| resource.attributes.k8s.container.name | keyword | |
| resource.attributes.k8s.container.restart_count | long | |
| resource.attributes.k8s.deployment.name | keyword | |
| resource.attributes.k8s.namespace.name | keyword | |
| resource.attributes.k8s.node.name | keyword | |
| resource.attributes.k8s.pod.name | keyword | |
| resource.attributes.k8s.pod.start_time | date | |
| resource.attributes.cloud.account.id | keyword | |
| resource.attributes.cloud.availability_zone | keyword | |
| resource.attributes.cloud.instance.id | keyword | |
| resource.attributes.cloud.platform | keyword | |
| resource.attributes.cloud.provider | keyword | |
| resource.attributes.deployment.environment | keyword | |
| resource.attributes.host.arch | keyword | |
| resource.attributes.host.cpu.cache.l2.size | keyword | |
| resource.attributes.host.cpu.family | keyword | |
| resource.attributes.host.cpu.model.id | keyword | |
| resource.attributes.host.cpu.model.name | keyword | |
| resource.attributes.host.cpu.stepping | keyword | |
| resource.attributes.host.cpu.vendor.id | keyword | |
| resource.attributes.host.id | keyword | |
| resource.attributes.host.ip | keyword | |
| resource.attributes.host.mac | keyword | |
| resource.attributes.host.name | keyword | |
| resource.attributes.os.type | keyword | |
| resource.attributes.os.description | keyword | |
| body.structured.http.request.method | HTTP request method. The value should retain its casing from the original event. For example, GET, get, and GeT are all considered valid values for this field. |
keyword |
| body.structured.http.request.referrer | Referrer for this HTTP request. | keyword |
| body.structured.http.response.body.size | Size in bytes of the response body. | long |
| body.structured.http.response.status_code | HTTP response status code. | long |
| body.structured.http.version | HTTP version. | keyword |
| attribute.log.file.path | Full path to the log file this event came from, including the file name. It should include the drive letter, when appropriate. If the event wasn't read from a log file, do not populate this field. | keyword |
| attribute.log.iostream | keyword | |
| body.structured.http.request.id | The randomly generated ID of the request | text |
| body.structured.http.request.size | The request length (including request line, header, and request body) | long |
| body.structured.http.request.time | Time elapsed since the first bytes were read from the client | double |
| body.structured.upstream.address | The IP address of the upstream server. If several servers were contacted during request processing, their addresses are separated by commas. | ip |
| body.structured.upstream.name | The name of the upstream. | keyword |
| body.structured.upstream.response.size | The length of the response obtained from the upstream server | long |
| body.structured.upstream.response.status_code | The status code of the response obtained from the upstream server | long |
| body.structured.upstream.response.time | The time spent on receiving the response from the upstream server as seconds with millisecond resolution | double |
| attribute.source.address | Some event source addresses are defined ambiguously. The event will sometimes list an IP, a domain or a unix socket. You should always store the raw address in the .address field. Then it should be duplicated to .ip or .domain, depending on which one it is. |
keyword |
| attribute.geo.city_name | City name. | keyword |
| attribute.geo.continent_name | Name of the continent. | keyword |
| attributes.geo.country_iso_code | Country ISO code. | keyword |
| attributes.geo.country_name | Country name. | keyword |
| attributes.geo.location.lat | Latitude. | geo_point |
| attributes.geo.location.lon | Longitude. | geo_point |
| attributes.geo.region_iso_code | Region ISO code. | keyword |
| attributes.geo.region_name | Region name. | keyword |
| body.structured.url.domain | Domain of the url, such as "www.elastic.co". In some cases a URL may refer to an IP and/or port directly, without a domain name. In this case, the IP address would go to the domain field. If the URL contains a literal IPv6 address enclosed by [ and ] (IETF RFC 2732), the [ and ] characters should also be captured in the domain field. |
keyword |
| body.structured.url.extension | The field contains the file extension from the original request url, excluding the leading dot. The file extension is only set if it exists, as not every url has a file extension. The leading period must not be included. For example, the value must be "png", not ".png". Note that when the file name has multiple extensions (example.tar.gz), only the last one should be captured ("gz", not "tar.gz"). | keyword |
| body.structured.url.original | Unmodified original url as seen in the event source. Note that in network monitoring, the observed URL may be a full URL, whereas in access logs, the URL is often just represented as a path. This field is meant to represent the URL as it was observed, complete or not. | wildcard |
| body.structured.url.path | Path of the request, such as "/search". | wildcard |
| body.structured.url.scheme | Scheme of the request, such as "https". Note: The : is not part of the scheme. |
keyword |
| body.structured.user.name | Short name or login of the user. | keyword |
| body.structured.user_agent.name | Name of the user agent. | keyword |
| body.structured.user_agent.original | Unparsed user_agent string. | keyword |
| body.structured.user_agent.version | Version of the user agent. | keyword |
The error data stream collects the Nginx Ingress Controller error logs.
Exported fields
| Field | Description | Type |
|---|---|---|
| @timestamp | Event timestamp. | date |
| data_stream.dataset | Data stream dataset. | constant_keyword |
| data_stream.namespace | Data stream namespace. | constant_keyword |
| data_stream.type | Data stream type. | constant_keyword |
| event.name | Event name | constant_keyword |
| resource.attributes.k8s.cluster.name | keyword | |
| resource.attributes.k8s.container.name | keyword | |
| resource.attributes.k8s.container.restart_count | long | |
| resource.attributes.k8s.deployment.name | keyword | |
| resource.attributes.k8s.namespace.name | keyword | |
| resource.attributes.k8s.node.name | keyword | |
| resource.attributes.k8s.pod.name | keyword | |
| resource.attributes.k8s.pod.start_time | date | |
| resource.attributes.cloud.account.id | keyword | |
| resource.attributes.cloud.availability_zone | keyword | |
| resource.attributes.cloud.instance.id | keyword | |
| resource.attributes.cloud.platform | keyword | |
| resource.attributes.cloud.provider | keyword | |
| resource.attributes.deployment.environment | keyword | |
| resource.attributes.host.arch | keyword | |
| resource.attributes.host.cpu.cache.l2.size | keyword | |
| resource.attributes.host.cpu.family | keyword | |
| resource.attributes.host.cpu.model.id | keyword | |
| resource.attributes.host.cpu.model.name | keyword | |
| resource.attributes.host.cpu.stepping | keyword | |
| resource.attributes.host.cpu.vendor.id | keyword | |
| resource.attributes.host.id | keyword | |
| resource.attributes.host.ip | keyword | |
| resource.attributes.host.mac | keyword | |
| resource.attributes.host.name | keyword | |
| resource.attributes.os.type | keyword | |
| resource.attributes.os.description | keyword | |
| attribute.log.file.path | Full path to the log file this event came from, including the file name. It should include the drive letter, when appropriate. If the event wasn't read from a log file, do not populate this field. | keyword |
| attributes.log.level | Original log level of the log event. If the source of the event provides a log level or textual severity, this is the one that goes in log.level. If your source doesn't specify one, you may put your event transport's severity here (e.g. Syslog severity). Some examples are warn, err, i, informational. |
keyword |
| body.structured.message | For log events the message field contains the log message, optimized for viewing in a log viewer. For structured logs without an original message field, other fields can be concatenated to form a human-readable summary of the event. If multiple messages exist, they can be combined into one message. | match_only_text |
| body.structured.source.file.name | Source file | keyword |
| body.structured.source.line_number | Source line number | long |
| body.structured.thread_id | Thread ID | long |
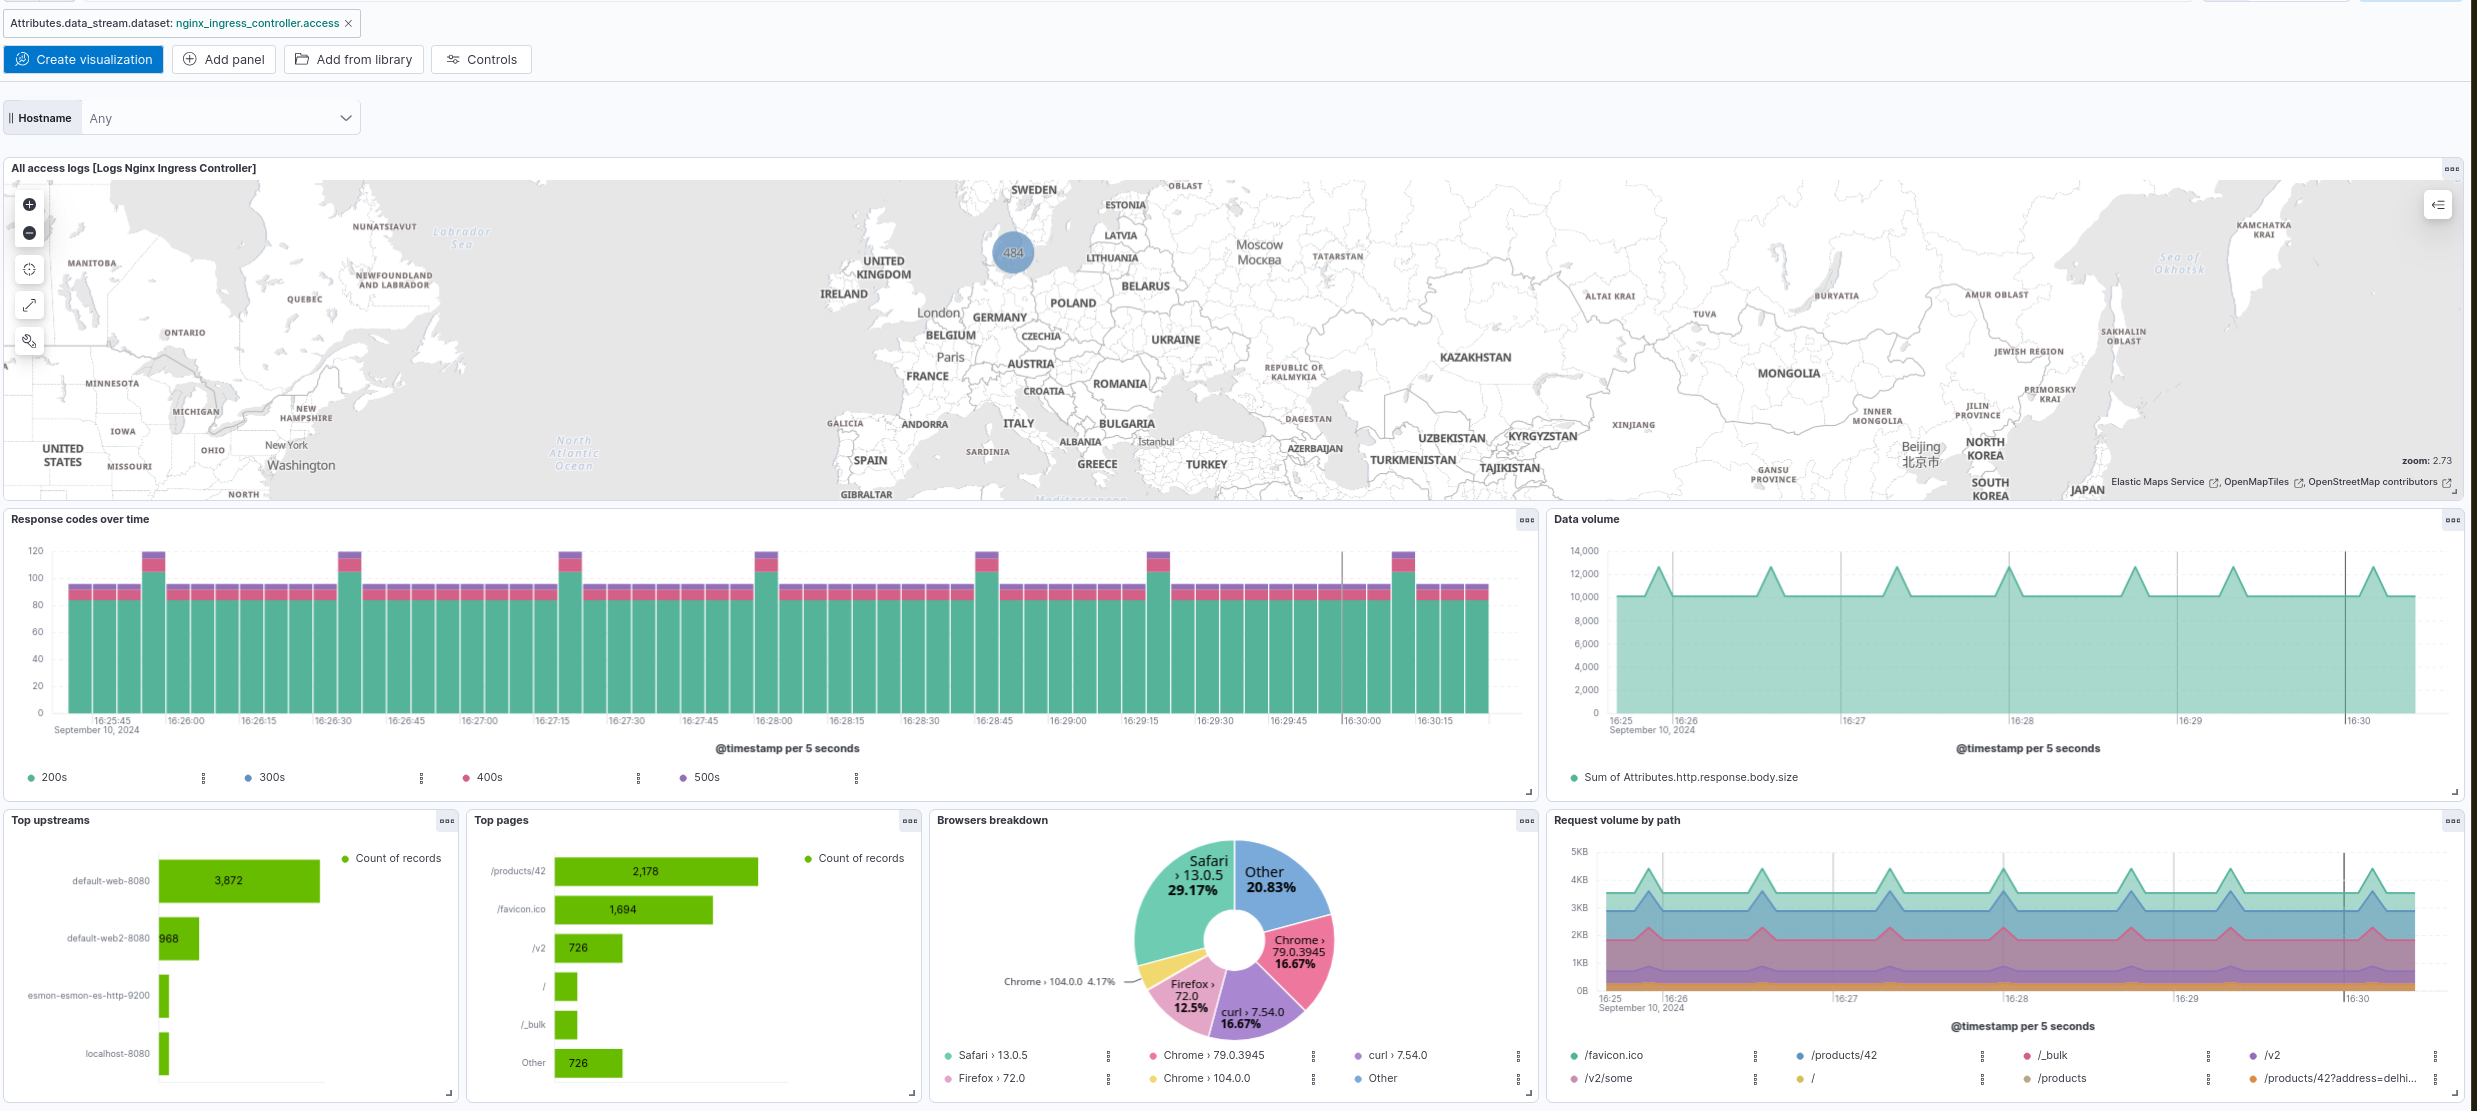
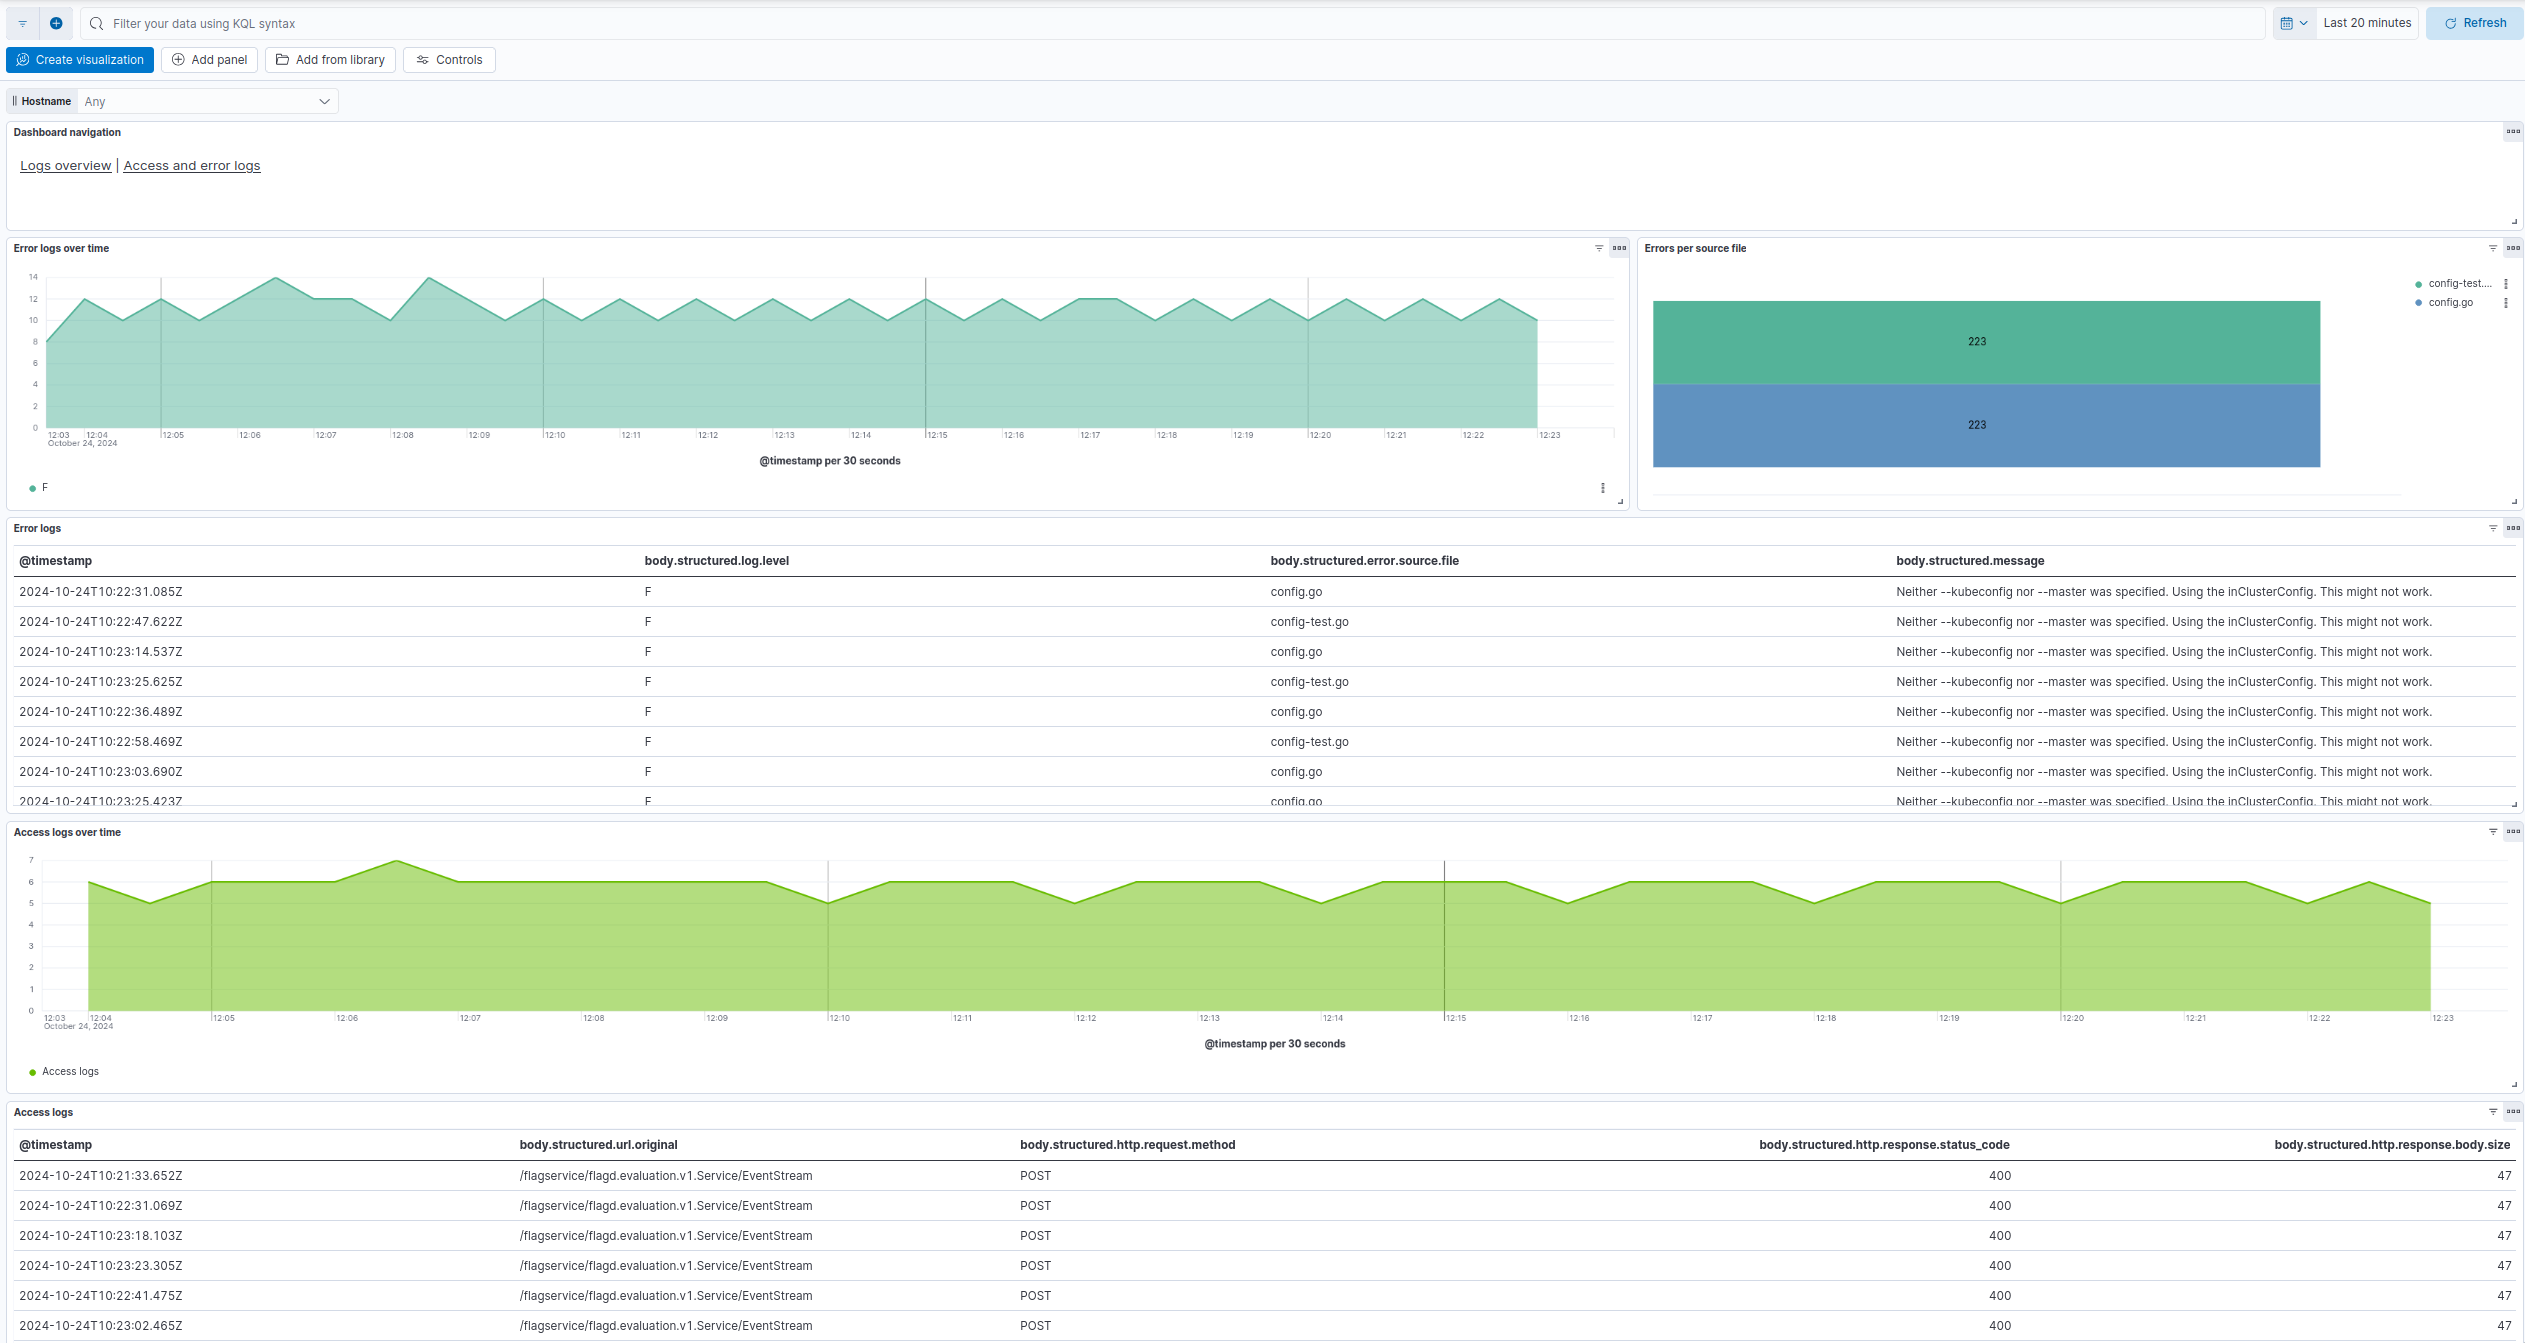
This integration includes one or more Kibana dashboards that visualizes the data collected by the integration. The screenshots below illustrate how the ingested data is displayed.
Changelog
| Version | Details | Minimum Kibana version |
|---|---|---|
| 0.4.2 | Enhancement (View pull request) Remove the nginx group so the content package no longer shows in the Nginx integration flyout. |
9.0.0 8.16.0 |
| 0.4.1 | Enhancement (View pull request) Add group field to package manifest. |
9.0.0 8.16.0 |
| 0.4.0 | Enhancement (View pull request) Add tags to Kibana assets |
9.0.0 8.16.0 |
| 0.3.0 | Enhancement (View pull request) Use standardized asset naming convention |
9.0.0 8.16.0 |
| 0.2.2 | Enhancement (View pull request) Add opentelemetry category |
9.0.0 8.16.0 |
| 0.2.1 | Bug fix (View pull request) Fix Dashboard Links Panel by setting useCurrentFilters to false. |
9.0.0 8.16.0 |
| 0.2.0 | Enhancement (View pull request) Use links panel in Dashboards. |
9.0.0 8.16.0 |
| 0.1.1 | Enhancement (View pull request) Downgrade integration format_version to 3.3.1. |
9.0.0 8.16.0 |
| 0.1.0 | Enhancement (View pull request) Add support for Kibana 9.0.0. |
9.0.0 8.16.0 |
| 0.0.3 | Bug fix (View pull request) Fix HTTP response status code breakdown |
8.16.0 |
| 0.0.2 | Bug fix (View pull request) Use body.structured field for dashboards |
8.16.0 |
| 0.0.1 | Enhancement (View pull request) Initial Nginx Ingress Controller Logs of the OpenTelemetry package |
9.0.0 |