SonicWall Firewall Integration for Elastic
Elastic Cloud Serverless projects are autoscaled environments, fully managed by Elastic and available on Elastic Cloud. Availability This functionality is generally available and ready for production usage. Elastic Cloud Serverless projects are autoscaled environments, fully managed by Elastic and available on Elastic Cloud. Availability This functionality is generally available and ready for production usage. The Elastic Stack includes Elastic's core products such as Elasticsearch, Kibana, Logstash, and Beats. Availability This functionality is generally available and ready for production usage. Unless stated otherwise on the page, this functionality is available when your Elastic Stack is deployed on Elastic Cloud Hosted, Elastic Cloud Enterprise, Elastic Cloud on Kubernetes, and self-managed environments. This documentation corresponds to the latest patch available for each minor version. If you're not using the latest patch, check the release notes for changes.
Serverless Observability
Generally available
Serverless Security
Generally available
Stack
9.0+
Generally available since 9.0
| Version | 1.22.1 (View all) |
| Subscription level What's this? |
Basic |
| Developed by What's this? |
Elastic |
| Ingestion method(s) | File, Network Protocol |
| Minimum Kibana version(s) | 9.0.0 8.11.0 |
The SonicWall Firewall integration for Elastic enables you to collect logs from SonicWall firewall devices. This integration provides essential visibility into network security events and device activities, helping you monitor threats and troubleshoot network issues within the Elastic Stack.
This integration is compatible with SonicWall Firewall devices running SonicOS 6.5 and 7.0. It supports the Enhanced Syslog format provided by these versions.
The integration collects data from SonicWall firewalls through two primary methods:
- Network syslog: You can configure your SonicWall device to send Enhanced Syslog messages to the Elastic Agent over UDP. The agent acts as a listener, receiving and processing the incoming data.
- Log files: You can configure the integration to read logs directly from specified file paths on the host where the agent's running.
Regardless of the collection method, the Elastic Agent sends the processed logs to your Elastic deployment, where they're stored in the log data stream and normalized for analysis.
The SonicWall Firewall integration collects various security and network event logs. This data is normalized into the sonicwall_firewall.log dataset within the Elastic Stack, so you'll have comprehensive visibility into network activity and potential threats.
The SonicWall Firewall integration collects log messages of the following types:
- Syslog messages sent using UDP, including firewall access rules and application firewall data.
- Flood protection and network events such as ARP, DNS, IP, and TCP.
- Security services logs including anti-spyware, anti-virus, Intrusion Prevention System (IPS), and content filtering events.
- System administration and user authentication logs.
- Enhanced Syslog messages captured from specified file paths on your agent's host.
Integrating your SonicWall logs with the Elastic Stack helps you monitor your network security and gain visibility into firewall operations. Key use cases include:
- Real-time threat detection where you use Elastic SIEM to identify and respond to threats identified in your firewall logs.
- Network traffic analysis to visualize patterns and identify anomalies using Kibana dashboards.
- Compliance and auditing to maintain searchable, long-term archives of firewall logs for regulatory requirements.
- Incident response to correlate firewall events with other observability data for faster investigations.
This integration features generic support for enhanced syslog messages produced by SonicOS and features more detailed ECS enrichment for the following messages:
| Category | Subcategory | Message IDs |
|---|---|---|
| Firewall | Access Rules | 440-442, 646, 647, 734, 735 |
| Firewall | Application Firewall | 793, 1654 |
| Firewall Settings | Advanced | 428, 1473, 1573, 1576, 1590 |
| Firewall Settings | Checksum Enforcement | 883-886, 1448, 1449 |
| Firewall Settings | FTP | 446, 527, 528, 538 |
| Firewall Settings | Flood Protection | 25, 856-860, 862-864, 897, 898, 901, 904, 905, 1180, 1213, 1214, 1366, 1369, 1450-1452 |
| Firewall Settings | Multicast | 683, 690, 694, 1233 |
| Firewall Settings | SSL Control | 999, 1001-1006, 1081 |
| High Availability | Cluster | 1149, 1152 |
| Log | Configuration Auditing | 1382, 1383, 1674 |
| Network | ARP | 45, 815, 1316 |
| Network | DNS | 1098, 1099 |
| Network | DNS Security | 1593 |
| Network | ICMP | 38, 63, 175, 182, 188, 523, 597, 598, 1254-1257, 1431, 1433, 1458 |
| Network | IP | 28, 522, 910, 1301-1303, 1429, 1430 |
| Network | IPcomp | 651-653 |
| Network | IPv6 Tunneling | 1253 |
| Network | Interfaces | 58 |
| Network | NAT | 339, 1197, 1436 |
| Network | NAT Policy | 1313-1315 |
| Network | Network Access | 41, 46, 98, 347, 524, 537, 590, 714, 1304 |
| Network | TCP | 36, 48, 173, 181, 580, 708, 709, 712, 713, 760, 887-896, 1029-1031, 1384, 1385, 1628, 1629 |
| Security Services | Anti-Spyware | 794-796 |
| Security Services | Anti-Virus | 123-125, 159, 408, 482 |
| Security Services | Application Control | 1154, 1155 |
| Security Services | Attacks | 22, 23, 27, 81-83, 177-179, 267, 606, 1373-1376, 1387, 1471 |
| Security Services | Botnet Filter | 1195, 1200, 1201, 1476, 1477, 1518, 1519 |
| Security Services | Content Filter | 14, 16, 1599-1601 |
| Security Services | Geo-IP Filter | 1198, 1199, 1474, 1475 |
| Security Services | IDP | 789, 790 |
| Security Services | IPS | 608, 609 |
| Security Services | Next-Gen Anti-Virus | 1559-1562 |
| Security Services | RBL Filter | 797, 798 |
| System | Administration | 340, 341 |
| System | Cloud Backup | 1511-1516 |
| System | Restart | 93-95, 164, 599-601, 1046, 1047, 1392, 1393 |
| System | Settings | 573, 574, 1049, 1065, 1066, 1160, 1161, 1268, 1269, 1336-1340, 1432, 1494, 1520, 1521, 1565-1568, 1636, 1637 |
| System | Status | 4, 53, 521, 1107, 1196, 1332, 1495, 1496 |
| Users | Authentication Access | 24, 29-35, 199, 200, 235-238, 246, 261-265, 328, 329, 438, 439, 486, 506-509, 520, 549-551, 557-562, 564, 583, 728, 729, 759, 986, 987, 994-998, 1008, 1035, 1048, 1080, 1117-1124, 1157, 1158, 1243, 1333-1335, 1341, 1342, 1517, 1570-1572, 1585, 1627, 1655, 1672 |
| Users | Radius Authentication | 243-245, 744-751, 753-757, 1011 |
| Users | SSO Agent Authentication | 988-991 |
| VPN | DHCP Relay | 229 |
| Wireless | RF Monitoring | 879 |
| Wireless | WLAN | 1363 |
| Wireless | WLAN IDS | 546, 548 |
To use the SonicWall Firewall integration, you'll need to meet the following vendor and Elastic requirements:
You must configure your SonicWall device with these settings:
- Administrative access to the SonicWall firewall web interface is required to configure syslog settings.
- The Elastic Agent must be reachable from the SonicWall firewall over the network using the
UDPprotocol on the configured syslog port (the default is9514). Ensure no firewalls or security groups are blocking this communication. - The SonicWall firewall must be configured to send logs in
Enhanced Syslogformat. - You'll need to enable
Display UTC in logs (instead of local time)under the firewall'sDevice > Settings > Timemenu to ensure correct timestamp parsing and avoid timezone-related issues. - You must know the IP address of the Elastic Agent where the syslog listener is running.
Ensure your Elastic environment meets these specifications:
- You have an Elastic Agent installed and enrolled in Fleet.
- Your Elastic Stack version is compatible with Elastic Stack
7.17.0or higher, including8.xversions. - The Elastic Agent has network connectivity to the SonicWall firewall to receive syslog messages on the configured
UDPport.
Elastic Agent must be installed. For more details, check the Elastic Agent installation instructions. You can install only one Elastic Agent per host.
Elastic Agent is required to stream data from the syslog or log file receiver and ship the data to Elastic, where the events will then be processed using the integration's ingest pipelines.
Depending on your firewall version, follow these steps to configure your SonicWall device to send logs to the Elastic Agent:
For SonicOS 7.x:
- Log in to your SonicWall firewall's administration interface.
- Navigate to
Device > Log > Syslog. - Under
Syslog Servers, click theAddbutton. - In the
Add Syslog Serverwindow, enter the IP address of your Elastic Agent in theName or IP Addressfield. - From the
Syslog Formatdropdown menu, selectEnhanced Syslog. - (Optional) Enter a
Syslog ID. The default isfirewall. This ID is used to differentiate logs from multiple firewalls and is mapped to theobserver.namefield in Elastic. - Click
OKto save the syslog server configuration. - Navigate to
Device > Log > Settings. - For each category of events you wish to forward (for example, System, Firewall, Network), enable the Syslog checkbox (often represented by a small paper airplane icon).
- Set the desired logging level for each category. It's recommended to set the level to
Informationalto capture sufficient detail. - Click
AcceptorSaveat the bottom of the page to apply the changes. - Navigate to
Device > Settings > Time. - Under
Display Time Zone, select the optionDisplay UTC in logs (instead of local time). - Click
Acceptto save the time setting.
For SonicOS 6.5:
- Log in to your SonicWall firewall's administration interface.
- Navigate to
Manage > Log Settings > SYSLOG. - Click the
Addbutton. - In the
Add Syslog Serverwindow, enter the name or IP address of your Elastic Agent in theName or IP Addressfield. The port will default to514 (UDP). - From the
Syslog Formatdropdown menu, selectEnhanced Syslog. - (Optional) Set the
Syslog ID. The default isfirewall. This ID is used to differentiate logs from multiple firewalls and is mapped to theobserver.namefield in Elastic. - Click
OKto save the syslog server configuration. - Navigate to
Manage > Log Settings > Base Setup. - For each category of events you wish to forward (for example, System, Firewall, Network), enable the Syslog checkbox (often represented by a small paper airplane icon).
- Set the desired logging level for each category. It's recommended to set the level to
Informationalto capture sufficient detail. - Click
AcceptorSaveat the bottom of the page to apply the changes. - Navigate to
Manage > System Setup > Time. - Under
Display Time Zone, select the optionDisplay UTC in logs (instead of local time). - Click
Acceptto save the time setting.
You can find more detailed information about SonicWall log events in the following vendor documentation:
To set up the SonicWall Firewall integration in Kibana:
- In Kibana, navigate to
Management > Integrations. - Search for
SonicWall Firewalland select the integration. - Click
Add SonicWall Firewall. - Configure the integration settings based on your preferred collection method.
Choose one of the following input types:
This input receives real-time syslog messages directly from your SonicWall firewall over UDP.
| Setting | Description |
|---|---|
| Listen address | The address where the Elastic Agent will accept syslog messages (for example, 0.0.0.0 to receive on all interfaces). |
| Listen Port | The UDP port where the Elastic Agent will receive syslog messages (for example, 9514). |
| Timezone Offset | Specify the timezone offset (for example, Europe/Amsterdam, EST, or -05:00) if your firewall isn't sending logs in UTC. Defaults to local. |
| Preserve original event | If enabled, the raw log is stored in the event.original field. |
Under Advanced options, you can configure:
| Setting | Description |
|---|---|
| Custom UDP Options | Specify advanced tuning for the UDP listener, such as buffer sizes or timeouts. |
| Processors | Add custom processors to filter or enhance the data before it's sent to Elastic. |
Example for Custom UDP Options:
read_buffer: 100MiB
max_message_size: 50KiB
timeout: 300s
This input collects logs directly from file paths on the host where the Elastic Agent is running.
| Setting | Description |
|---|---|
| Paths | A list of file paths to monitor for new log entries (for example, /var/log/sonicwall-firewall.log). |
| Timezone Offset | Specify the timezone offset if the logs aren't recorded in UTC. |
| Preserve original event | If enabled, the raw log is stored in the event.original field. |
After configuring the input, assign the integration to an agent policy and click Save and continue.
To verify that your integration is working correctly, follow these steps:
- Verify Elastic Agent status: Navigate to
Management > Fleet > Agentsin Kibana and ensure your agent's status isHealthy. - Trigger data flow on the firewall: Generate some activity that the firewall will log:
- Browse several websites from a client behind the firewall to generate access logs.
- Attempt to access a blocked service to generate denial events.
- Log out and back into the SonicWall administration interface to generate authentication logs.
- Modify a minor setting (like time display) and click
Acceptto trigger a configuration audit log.
- Check data in Discover:
- In Kibana, navigate to
Analytics > Discover. - Filter for
data_stream.dataset : "sonicwall_firewall.log". - Confirm that logs are appearing with recent timestamps and that fields like
source.ip,destination.ip, andobserver.nameare correctly populated.
- In Kibana, navigate to
- Check dashboards: Navigate to
Analytics > Dashboardsand search forSonicWall Firewallto view the pre-built visualizations. Confirm they are populated with data from your device.
For help with Elastic ingest tools, check the Common problems documentation.
You might encounter the following issues when configuring the SonicWall Firewall integration:
- Incorrect syslog format: Ensure the SonicWall firewall is configured to send logs in
Enhanced Syslogformat. This integration is designed for the enhanced format and will not correctly parse logs sent inLegacyor other formats. - Timezone mismatch: Check if the SonicWall firewall is sending logs in UTC. If the firewall is using local time, you must configure the
Timezone Offsetsetting in the integration settings to ensure timestamps are parsed correctly. EnablingDisplay UTC in logson the firewall is the recommended approach. - Network connectivity problems: Verify that the SonicWall device can reach the Elastic Agent host on the configured UDP port (default is
9514). Check for any intermediate firewalls or host-based security software that might be blocking the traffic. - Missing log categories: Confirm that the desired log categories (such as Firewall, Network, or System) have the syslog forwarding option enabled in the SonicWall administration interface under the log settings menu.
- Syslog listener not starting: Ensure no other process on the Elastic Agent host is already using the configured UDP port. You can use tools like
netstatorssto check for port conflicts.
For more detailed information on SonicWall log events and troubleshooting, refer to the following resources:
To ensure optimal performance and reliable data ingestion in high-volume environments, consider the following factors:
- Transport and collection: The SonicWall Firewall integration primarily uses UDP Syslog for log collection. UDP offers high speed and low overhead, which makes it suitable for high-volume log streams. However, UDP is an unreliable protocol. For environments where log loss is unacceptable, ensure network reliability between the firewall and the Elastic Agent by implementing network quality-of-service (QoS) or ensuring sufficient buffer sizes.
- Data volume management: To manage data volume and reduce the load on both the SonicWall firewall and the Elastic Agent, filter or limit the data at the source. Configure your SonicWall firewall to only send relevant log categories and severity levels to the Syslog server. Excessive logging of low-priority events can consume significant network bandwidth and processing resources on both ends.
- Elastic Agent scaling: While a single Elastic Agent can handle a significant volume of syslog data, for extremely high-throughput environments or to ensure redundancy, deploy multiple Elastic Agents. Place Elastic Agents strategically in the same network segment as the firewall to minimize network latency.
- Resource monitoring: Monitor agent resource utilization, such as CPU, memory, and disk I/O. This helps you size resources appropriately and scale out by adding more agents as your data volume increases.
For more information on architectures that can be used for scaling this integration, check the Ingest Architectures documentation.
The following reference material provides details about the SonicWall Firewall integration.
These inputs can be used with this integration:
logfile
For more details about the logfile input settings, check the Filebeat documentation.
To collect logs via logfile, select Collect logs via the logfile input and configure the following parameter:
- Paths: List of glob-based paths to crawl and fetch log files from. Supports glob patterns like
/var/log/*.logor/var/log/*/*.logfor subfolder matching. Each file found starts a separate harvester.
udp
For more details about the UDP input settings, check the Filebeat documentation.
To collect logs via UDP, select Collect logs via UDP and configure the following parameters:
Required Settings:
- Host
- Port
Common Optional Settings:
- Max Message Size - Maximum size of UDP packets to accept (default: 10KB, max: 64KB)
- Read Buffer - UDP socket read buffer size for handling bursts of messages
- Read Timeout - How long to wait for incoming packets before checking for shutdown
The SonicWall Firewall integration includes the following data stream.
The log data stream provides events from SonicWall Firewall devices of the following types:
- Traffic logs
- Unified Threat Management (UTM) logs
- System event logs
- Authentication logs
- Security service logs
Exported fields
| Field | Description | Type |
|---|---|---|
| @timestamp | Event timestamp. | date |
| data_stream.dataset | Data stream dataset. | constant_keyword |
| data_stream.namespace | Data stream namespace. | constant_keyword |
| data_stream.type | Data stream type. | constant_keyword |
| destination.address | Some event destination addresses are defined ambiguously. The event will sometimes list an IP, a domain or a unix socket. You should always store the raw address in the .address field. Then it should be duplicated to .ip or .domain, depending on which one it is. |
keyword |
| destination.bytes | Bytes sent from the destination to the source. | long |
| destination.domain | The domain name of the destination system. This value may be a host name, a fully qualified domain name, or another host naming format. The value may derive from the original event or be added from enrichment. | keyword |
| destination.geo.city_name | City name. | keyword |
| destination.geo.continent_name | Name of the continent. | keyword |
| destination.geo.country_iso_code | Country ISO code. | keyword |
| destination.geo.country_name | Country name. | keyword |
| destination.geo.location | Longitude and latitude. | geo_point |
| destination.geo.region_iso_code | Region ISO code. | keyword |
| destination.geo.region_name | Region name. | keyword |
| destination.ip | IP address of the destination (IPv4 or IPv6). | ip |
| destination.mac | MAC address of the destination. The notation format from RFC 7042 is suggested: Each octet (that is, 8-bit byte) is represented by two [uppercase] hexadecimal digits giving the value of the octet as an unsigned integer. Successive octets are separated by a hyphen. | keyword |
| destination.nat.ip | Translated ip of destination based NAT sessions (e.g. internet to private DMZ) Typically used with load balancers, firewalls, or routers. | ip |
| destination.nat.port | Port the source session is translated to by NAT Device. Typically used with load balancers, firewalls, or routers. | long |
| destination.packets | Packets sent from the destination to the source. | long |
| destination.port | Port of the destination. | long |
| ecs.version | ECS version this event conforms to. ecs.version is a required field and must exist in all events. When querying across multiple indices -- which may conform to slightly different ECS versions -- this field lets integrations adjust to the schema version of the events. |
keyword |
| event.dataset | Event dataset | constant_keyword |
| event.module | Event module | constant_keyword |
| event.sequence | Sequence number of the event. The sequence number is a value published by some event sources, to make the exact ordering of events unambiguous, regardless of the timestamp precision. | long |
| event.severity | The numeric severity of the event according to your event source. What the different severity values mean can be different between sources and use cases. It's up to the implementer to make sure severities are consistent across events from the same source. The Syslog severity belongs in log.syslog.severity.code. event.severity is meant to represent the severity according to the event source (e.g. firewall, IDS). If the event source does not publish its own severity, you may optionally copy the log.syslog.severity.code to event.severity. |
long |
| host.ip | Host ip addresses. | ip |
| http.request.body.bytes | Size in bytes of the request body. | long |
| http.request.method | HTTP request method. The value should retain its casing from the original event. For example, GET, get, and GeT are all considered valid values for this field. |
keyword |
| input.type | Type of Filebeat input. | keyword |
| log.file.path | Path to the log file. | keyword |
| log.flags | Flags for the log file. | keyword |
| log.level | Original log level of the log event. If the source of the event provides a log level or textual severity, this is the one that goes in log.level. If your source doesn't specify one, you may put your event transport's severity here (e.g. Syslog severity). Some examples are warn, err, i, informational. |
keyword |
| log.offset | Offset of the entry in the log file. | long |
| log.source.address | Source address from which the log event was read / sent from. | keyword |
| log.syslog.priority | Syslog numeric priority of the event, if available. According to RFCs 5424 and 3164, the priority is 8 * facility + severity. This number is therefore expected to contain a value between 0 and 191. | long |
| message | For log events the message field contains the log message, optimized for viewing in a log viewer. For structured logs without an original message field, other fields can be concatenated to form a human-readable summary of the event. If multiple messages exist, they can be combined into one message. | match_only_text |
| network.bytes | Total bytes transferred in both directions. If source.bytes and destination.bytes are known, network.bytes is their sum. |
long |
| network.packets | Total packets transferred in both directions. If source.packets and destination.packets are known, network.packets is their sum. |
long |
| network.protocol | In the OSI Model this would be the Application Layer protocol. For example, http, dns, or ssh. The field value must be normalized to lowercase for querying. |
keyword |
| network.transport | Same as network.iana_number, but instead using the Keyword name of the transport layer (udp, tcp, ipv6-icmp, etc.) The field value must be normalized to lowercase for querying. | keyword |
| observer.egress.interface.name | Interface name as reported by the system. | keyword |
| observer.egress.zone | Network zone of outbound traffic as reported by the observer to categorize the destination area of egress traffic, e.g. Internal, External, DMZ, HR, Legal, etc. | keyword |
| observer.hostname | Hostname of the observer. | keyword |
| observer.ingress.interface.name | Interface name as reported by the system. | keyword |
| observer.ingress.zone | Network zone of incoming traffic as reported by the observer to categorize the source area of ingress traffic. e.g. internal, External, DMZ, HR, Legal, etc. | keyword |
| observer.ip | IP addresses of the observer. | ip |
| observer.name | Custom name of the observer. This is a name that can be given to an observer. This can be helpful for example if multiple firewalls of the same model are used in an organization. If no custom name is needed, the field can be left empty. | keyword |
| observer.product | The product name of the observer. | keyword |
| observer.serial_number | Observer serial number. | keyword |
| observer.type | The type of the observer the data is coming from. There is no predefined list of observer types. Some examples are forwarder, firewall, ids, ips, proxy, poller, sensor, APM server. |
keyword |
| observer.vendor | Vendor name of the observer. | keyword |
| related.ip | All of the IPs seen on your event. | ip |
| related.user | All the user names or other user identifiers seen on the event. | keyword |
| rule.id | A rule ID that is unique within the scope of an agent, observer, or other entity using the rule for detection of this event. | keyword |
| rule.name | The name of the rule or signature generating the event. | keyword |
| rule.uuid | A rule ID that is unique within the scope of a set or group of agents, observers, or other entities using the rule for detection of this event. | keyword |
| sonicwall.firewall.Category | Category of CFS blocked content. | keyword |
| sonicwall.firewall.af_polid | Displays the Application Filter Policy ID. | keyword |
| sonicwall.firewall.app | Numeric application ID. | keyword |
| sonicwall.firewall.appName | Non-Signature Application Name. | keyword |
| sonicwall.firewall.appcat | Application control category. | keyword |
| sonicwall.firewall.appid | Application ID. | keyword |
| sonicwall.firewall.auditId | keyword | |
| sonicwall.firewall.code | CFS blocking code. | keyword |
| sonicwall.firewall.dpi | Indicates wether a flow underwent Deep Packet Inspection. | boolean |
| sonicwall.firewall.event_group_category | Event group category. | keyword |
| sonicwall.firewall.gcat | Event group category (numeric identifier). | keyword |
| sonicwall.firewall.ipscat | IPS category. | keyword |
| sonicwall.firewall.ipspri | IPS priority. | keyword |
| sonicwall.firewall.oldValue | keyword | |
| sonicwall.firewall.sess | User session type. | keyword |
| sonicwall.firewall.sid | IPS or Anti-Spyware signature ID. | keyword |
| sonicwall.firewall.tranxId | keyword | |
| sonicwall.firewall.type | ICMP type. | keyword |
| sonicwall.firewall.userMode | keyword | |
| sonicwall.firewall.uuid | Object UUID. | keyword |
| sonicwall.firewall.vpnpolicy | source VPN policy name. | keyword |
| sonicwall.firewall.vpnpolicyDst | destination VPN policy name. | keyword |
| source.address | Some event source addresses are defined ambiguously. The event will sometimes list an IP, a domain or a unix socket. You should always store the raw address in the .address field. Then it should be duplicated to .ip or .domain, depending on which one it is. |
keyword |
| source.bytes | Bytes sent from the source to the destination. | long |
| source.domain | The domain name of the source system. This value may be a host name, a fully qualified domain name, or another host naming format. The value may derive from the original event or be added from enrichment. | keyword |
| source.geo.city_name | City name. | keyword |
| source.geo.continent_name | Name of the continent. | keyword |
| source.geo.country_iso_code | Country ISO code. | keyword |
| source.geo.country_name | Country name. | keyword |
| source.geo.location | Longitude and latitude. | geo_point |
| source.geo.region_iso_code | Region ISO code. | keyword |
| source.geo.region_name | Region name. | keyword |
| source.ip | IP address of the source (IPv4 or IPv6). | ip |
| source.mac | MAC address of the source. The notation format from RFC 7042 is suggested: Each octet (that is, 8-bit byte) is represented by two [uppercase] hexadecimal digits giving the value of the octet as an unsigned integer. Successive octets are separated by a hyphen. | keyword |
| source.nat.ip | Translated ip of source based NAT sessions (e.g. internal client to internet) Typically connections traversing load balancers, firewalls, or routers. | ip |
| source.nat.port | Translated port of source based NAT sessions. (e.g. internal client to internet) Typically used with load balancers, firewalls, or routers. | long |
| source.packets | Packets sent from the source to the destination. | long |
| source.port | Port of the source. | long |
| tags | List of keywords used to tag each event. | keyword |
| url.domain | Domain of the url, such as "www.elastic.co". In some cases a URL may refer to an IP and/or port directly, without a domain name. In this case, the IP address would go to the domain field. If the URL contains a literal IPv6 address enclosed by [ and ] (IETF RFC 2732), the [ and ] characters should also be captured in the domain field. |
keyword |
| url.full | If full URLs are important to your use case, they should be stored in url.full, whether this field is reconstructed or present in the event source. |
wildcard |
| url.full.text | Multi-field of url.full. |
match_only_text |
| url.original | Unmodified original url as seen in the event source. Note that in network monitoring, the observed URL may be a full URL, whereas in access logs, the URL is often just represented as a path. This field is meant to represent the URL as it was observed, complete or not. | wildcard |
| url.original.text | Multi-field of url.original. |
match_only_text |
| url.path | Path of the request, such as "/search". | wildcard |
| url.scheme | Scheme of the request, such as "https". Note: The : is not part of the scheme. |
keyword |
| user.name | Short name or login of the user. | keyword |
| user.name.text | Multi-field of user.name. |
match_only_text |
Example
{
    "@timestamp": "2022-05-16T08:18:39.000+02:00",
    "agent": {
        "ephemeral_id": "8f24cddd-67ce-47a5-abbf-f121166c864d",
        "id": "8601d89d-ddce-4945-96ce-7d8dd35e7d9e",
        "name": "docker-fleet-agent",
        "type": "filebeat",
        "version": "8.11.4"
    },
    "data_stream": {
        "dataset": "sonicwall_firewall.log",
        "namespace": "ep",
        "type": "logs"
    },
    "destination": {
        "geo": {
            "city_name": "London",
            "continent_name": "Europe",
            "country_iso_code": "GB",
            "country_name": "United Kingdom",
            "location": {
                "lat": 51.5142,
                "lon": -0.0931
            },
            "region_iso_code": "GB-ENG",
            "region_name": "England"
        },
        "ip": "81.2.69.193",
        "mac": "00-17-C5-30-F9-D9",
        "port": 64889
    },
    "ecs": {
        "version": "8.17.0"
    },
    "elastic_agent": {
        "id": "8601d89d-ddce-4945-96ce-7d8dd35e7d9e",
        "snapshot": false,
        "version": "8.11.4"
    },
    "event": {
        "action": "connection-denied",
        "agent_id_status": "verified",
        "category": [
            "network"
        ],
        "code": "713",
        "dataset": "sonicwall_firewall.log",
        "ingested": "2024-01-29T19:06:19Z",
        "kind": "event",
        "outcome": "success",
        "sequence": 692,
        "severity": 7,
        "timezone": "+02:00",
        "type": [
            "connection",
            "denied"
        ]
    },
    "input": {
        "type": "udp"
    },
    "log": {
        "level": "debug",
        "source": {
            "address": "172.23.0.4:37942"
        },
        "syslog": {
            "priority": 135
        }
    },
    "message": "� (TCP Flag(s): RST)",
    "network": {
        "bytes": 46,
        "protocol": "https",
        "transport": "tcp"
    },
    "observer": {
        "egress": {
            "interface": {
                "name": "X1"
            },
            "zone": "Untrusted"
        },
        "ingress": {
            "interface": {
                "name": "X1"
            },
            "zone": "Untrusted"
        },
        "ip": [
            "10.0.0.96"
        ],
        "name": "firewall",
        "product": "SonicOS",
        "serial_number": "0040103CE114",
        "type": "firewall",
        "vendor": "SonicWall"
    },
    "related": {
        "ip": [
            "10.0.0.96",
            "81.2.69.193"
        ],
        "user": [
            "admin"
        ]
    },
    "rule": {
        "id": "15 (WAN->WAN)"
    },
    "sonicwall": {
        "firewall": {
            "app": "12",
            "event_group_category": "Firewall Settings",
            "gcat": "6",
            "sess": "Web"
        }
    },
    "source": {
        "bytes": 46,
        "ip": "10.0.0.96",
        "mac": "00-06-B1-DD-4F-D4",
        "port": 443
    },
    "tags": [
        "sonicwall-firewall",
        "forwarded"
    ],
    "user": {
        "name": "admin"
    }
}
For more information about the logs generated by your device, you can refer to the following documentation:
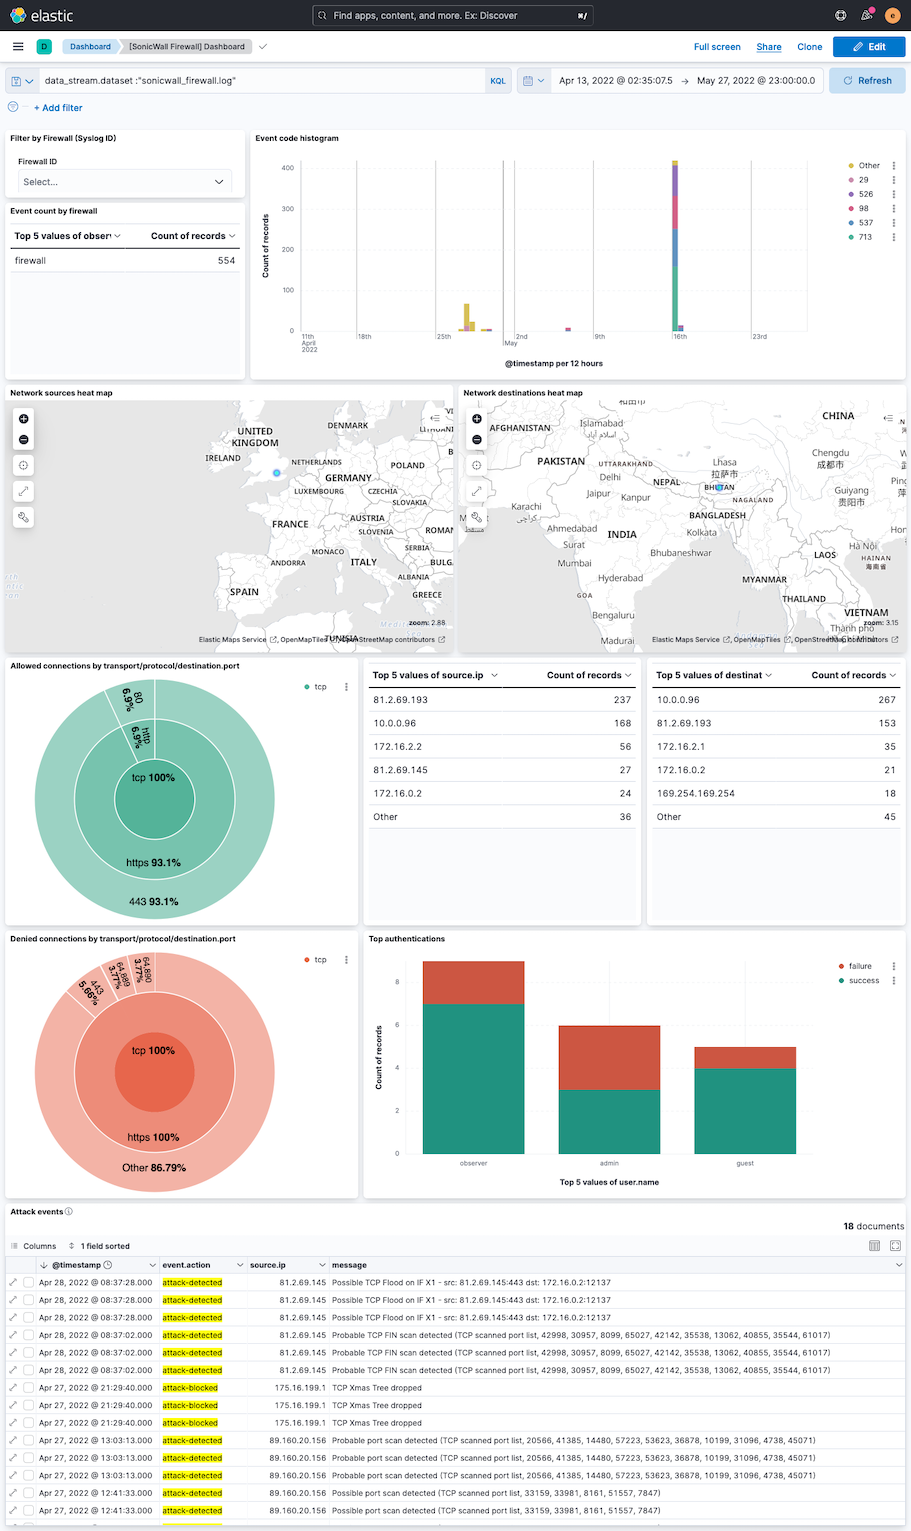
This integration includes one or more Kibana dashboards that visualizes the data collected by the integration. The screenshots below illustrate how the ingested data is displayed.
Changelog
| Version | Details | Minimum Kibana version |
|---|---|---|
| 1.22.1 | Bug fix (View pull request) Remove top level note from docs |
9.0.0 8.11.0 |
| 1.22.0 | Enhancement (View pull request) Generate new documentation |
9.0.0 8.11.0 |
| 1.21.0 | Bug fix (View pull request) Global Category corrections, and a packet event correction |
9.0.0 8.11.0 |
| 1.20.0 | Enhancement (View pull request) Preserve event.original on pipeline error. |
9.0.0 8.11.0 |
| 1.19.2 | Enhancement (View pull request) Generate processor tags and normalize error handler. |
9.0.0 8.11.0 |
| 1.19.1 | Enhancement (View pull request) Changed owners. |
9.0.0 8.11.0 |
| 1.19.0 | Enhancement (View pull request) Allow @custom pipeline access to event.original without setting preserve_original_event. |
9.0.0 8.11.0 |
| 1.18.0 | Enhancement (View pull request) Support stack version 9.0. |
9.0.0 8.2.0 |
| 1.17.0 | Enhancement (View pull request) ECS version updated to 8.17.0. |
8.2.0 |
| 1.16.0 | Enhancement (View pull request) Update package spec to 3.0.3. |
8.2.0 |
| 1.15.0 | Bug fix (View pull request) Add ecs fields mappings for event.sequence, event.severity, host.ip, http.request.body.bytes. |
8.2.0 |
| 1.14.2 | Enhancement (View pull request) Changed owners |
8.2.0 |
| 1.14.1 | Bug fix (View pull request) Fix exclude_files pattern. |
8.2.0 |
| 1.14.0 | Enhancement (View pull request) Parse host.name or host.ip, and syslog priority from log message header. |
8.2.0 |
| 1.13.0 | Enhancement (View pull request) ECS version updated to 8.11.0. |
8.2.0 |
| 1.12.0 | Enhancement (View pull request) Improve 'event.original' check to avoid errors if set. |
8.2.0 |
| 1.11.0 | Enhancement (View pull request) ECS version updated to 8.10.0. |
8.2.0 |
| 1.10.0 | Enhancement (View pull request) The format_version in the package manifest changed from 2.11.0 to 3.0.0. Removed dotted YAML keys from package manifest. Added 'owner.type: elastic' to package manifest. |
8.2.0 |
| 1.9.0 | Enhancement (View pull request) Add tags.yml file so that integration's dashboards and saved searches are tagged with "Security Solution" and displayed in the Security Solution UI. |
8.2.0 |
| 1.8.0 | Enhancement (View pull request) Update package to ECS 8.9.0. |
8.2.0 |
| 1.7.0 | Enhancement (View pull request) Update to package-spec 2.9.0. |
8.2.0 |
| 1.6.0 | Enhancement (View pull request) Ensure event.kind is correctly set for pipeline errors. |
8.2.0 |
| 1.5.0 | Enhancement (View pull request) Update package to ECS 8.8.0. |
8.2.0 |
| 1.4.0 | Enhancement (View pull request) Update package to ECS 8.7.0. |
8.2.0 |
| 1.3.2 | Enhancement (View pull request) Added categories and/or subcategories. |
8.2.0 |
| 1.3.1 | Bug fix (View pull request) Ensure numeric timezones are correctly interpreted. |
8.2.0 |
| 1.3.0 | Enhancement (View pull request) Update package to ECS 8.6.0. |
8.2.0 |
| 1.2.0 | Enhancement (View pull request) Add udp_options to the UDP input. |
8.2.0 |
| 1.1.0 | Enhancement (View pull request) Update package to ECS 8.5.0. |
8.2.0 |
| 1.0.0 | Enhancement (View pull request) Make GA |
8.2.0 |
| 0.3.0 | Enhancement (View pull request) Update package to ECS 8.4.0 |
8.2.0 |
| 0.2.0 | Enhancement (View pull request) Update package to ECS 8.3.0. |
8.2.0 |
| 0.1.1 | Bug fix (View pull request) Fix handling of NAT fields |
8.2.0 |
| 0.1.0 | Enhancement (View pull request) Initial beta version of the package |
— |