Imperva Integration for Elastic
Elastic Cloud Serverless projects are autoscaled environments, fully managed by Elastic and available on Elastic Cloud. Availability This functionality is generally available and ready for production usage. Elastic Cloud Serverless projects are autoscaled environments, fully managed by Elastic and available on Elastic Cloud. Availability This functionality is generally available and ready for production usage. The Elastic Stack includes Elastic's core products such as Elasticsearch, Kibana, Logstash, and Beats. Availability This functionality is generally available and ready for production usage. Unless stated otherwise on the page, this functionality is available when your Elastic Stack is deployed on Elastic Cloud Hosted, Elastic Cloud Enterprise, Elastic Cloud on Kubernetes, and self-managed environments. This documentation corresponds to the latest patch available for each minor version. If you're not using the latest patch, check the release notes for changes.
Serverless Observability
Generally available
Serverless Security
Generally available
Stack
9.0+
Generally available since 9.0
| Version | 1.10.1 (View all) |
| Subscription level What's this? |
Basic |
| Developed by What's this? |
Elastic |
| Ingestion method(s) | File, Network Protocol |
| Minimum Kibana version(s) | 9.0.0 8.11.0 |
The Imperva integration for Elastic enables you to collect and analyze logs from Imperva SecureSphere devices using Elastic Agent. This integration supports logs in CEF (Common Event Format) only. By ingesting these logs into the Elastic Stack, you can monitor security events, audit database activity, and gain comprehensive visibility into web application traffic.
This integration is compatible with Imperva SecureSphere. It supports log collection from SecureSphere appliances configured to export logs via syslog.
This integration is compatible with Elastic Stack version 8.11.0 or higher.
This integration collects logs from Imperva SecureSphere by receiving data over the network or by reading from log files. You can configure an Elastic Agent to act as a syslog receiver listening on a specific TCP or UDP port. Alternatively, if logs are being written to a file system accessible by the Elastic Agent, you can use the filestream input to ingest them.
The Elastic Agent processes the incoming logs, parses them into the Elastic Common Schema (ECS) format, and forwards them to your Elastic deployment. This allows you to use pre-built dashboards to visualize security events and perform detailed analysis of your Imperva log data.
The Imperva integration collects log messages from your SecureSphere appliances. You'll gain visibility into your security posture and administrative activity through several types of data.
The integration supports the following data stream:
securesphere: You can ingest logs that include security alerts,auditrecords, and system-level events from Imperva SecureSphere.
The types of logs you'll collect include:
- Security alerts: These logs contain details about potential threats, policy violations, and firewall decisions.
auditlogs: You'll see records of administrative actions and configuration changes made within the Imperva environment.logmessages: You'll receive system-level information about the health and status of your SecureSphere appliances.
Integrating Imperva logs with the Elastic Stack helps you enhance your security operations in several ways:
- Real-time threat detection: You can use Elastic Security to monitor Imperva alerts and respond to potential attacks as they happen.
- Compliance and reporting: You'll be able to store and search through your
auditandlogdata to satisfy regulatory requirements and simplify security audits. - Incident investigation: You can correlate Imperva events with other data sources in Elastic to understand the full scope of a security incident.
- Operational monitoring: You'll track system events and hardware status to ensure your Imperva deployment remains healthy and effective.
You need the following to use this integration:
- An Imperva SecureSphere device with administrative access to configure log forwarding or log file generation.
- Network connectivity between your Imperva SecureSphere device and the Elastic Agent host for TCP or UDP syslog delivery. By default, the integration listens on port
9507. - Permissions for the Elastic Agent to read log files if you're using the filestream input method.
- Elastic Stack version 8.11.0 or higher.
Elastic Agent must be installed on a host that will receive the syslog data or has access to the log files from the Imperva SecureSphere device. For detailed installation instructions, refer to the Elastic Agent installation guide. Only one Elastic Agent is needed per host.
To send logs from Imperva SecureSphere to Elastic Agent, you'll need to create or modify an action set that sends data via syslog:
- Log in to the SecureSphere Management Server (MX) console.
- Navigate to Main > Policies > Action Sets.
- Click the New icon to create a new action set.
- Provide a name for the action set (for example,
Elastic_Agent_Syslog). - In the Action Interface column, select Gateway System Log or External Log.
- In the Action column, select the specific action to send the log.
- Configure the following parameters for the action:
- Syslog Host: The IP address of the host where the Elastic Agent is installed.
- Syslog Port: The port number configured in the Elastic integration (for example,
9507). - Protocol: The protocol configured in the Elastic integration (
TCPorUDP). - Message Format: Select CEF (Common Event Format).
- In the Apply to event type drop-down menu, select an event type to which to apply the action set.
- Click Create to create the action set.
- Navigate to the relevant policy (for example, Security, Audit, or System) where you want to apply this action set.
- In the Apply To or Action section of the policy, select the action set you just created.
- Click Save to apply the changes.
To set up the integration in Kibana, follow these steps:
- In Kibana, navigate to Management > Integrations.
- Search for Imperva and select the integration.
- Click Add Imperva.
- Configure the integration by selecting an input type and providing the necessary settings. This integration supports
TCP,UDP, andFilestreaminputs.
This input collects logs over a TCP socket. Configure the following settings:
| Setting | Description |
|---|---|
| Listen address | The bind address for the TCP listener (for example, localhost or 0.0.0.0). |
| Listen port | The TCP port number to listen on (for example, 9507). |
| Timezone offset | Specify an IANA timezone or offset (for example, +0200) for logs with no timezone information. |
| Preserve original event | If checked, a raw copy of the original log is stored in the event.original field. |
Under Advanced options, you can configure the following optional parameters:
| Setting | Description |
|---|---|
| Custom TCP options | Specify custom configuration options for the TCP input, such as max_message_size or max_connections. |
| SSL configuration | Configure SSL options for encrypted communication. See the SSL documentation for details. |
| Preserve duplicate custom fields | If checked, imperva.securesphere fields that were copied to Elastic Common Schema (ECS) fields are preserved. |
| Processors | Add custom processors to enhance or reduce event fields before parsing. |
This input collects logs over a UDP socket. Configure the following settings:
| Setting | Description |
|---|---|
| Listen address | The bind address for the UDP listener (for example, localhost or 0.0.0.0). |
| Listen port | The UDP port number to listen on (for example, 9507). |
| Timezone offset | Specify an IANA timezone or offset (for example, +0200) for logs with no timezone information. |
| Preserve original event | If checked, a raw copy of the original log is stored in the event.original field. |
Under Advanced options, you can configure the following optional parameters:
| Setting | Description |
|---|---|
| Custom UDP options | Specify custom configuration options for the UDP input, such as max_message_size or timeout. |
| Preserve duplicate custom fields | If checked, imperva.securesphere fields that were copied to Elastic Common Schema (ECS) fields are preserved. |
| Processors | Add custom processors to enhance or reduce event fields before parsing. |
This input collects logs directly from log files on the host where the Elastic Agent is running. Configure the following settings:
| Setting | Description |
|---|---|
| Paths | A list of file paths to monitor (for example, /var/log/imperva-securesphere.log). |
| Timezone offset | Specify an IANA timezone or offset (for example, +0200) for logs with no timezone information. |
| Preserve original event | If checked, a raw copy of the original log is stored in the event.original field. |
Under Advanced options, you can configure the following optional parameters:
| Setting | Description |
|---|---|
| Custom filestream options | Specify custom configuration options for the Filestream input. |
| Preserve duplicate custom fields | If checked, imperva.securesphere fields that were copied to Elastic Common Schema (ECS) fields are preserved. |
| Processors | Add custom processors to enhance or reduce event fields before parsing. |
To validate that the integration is working properly and data is flowing into Elasticsearch:
- Verify on the Imperva SecureSphere device that logs are being sent to the configured Elastic Agent host and port.
- In Kibana, navigate to Discover.
- Select the
logs-*index pattern or use the search bar to enterdata_stream.dataset: "imperva.securesphere"and check for incoming documents. - Verify that events are appearing with recent timestamps and that fields are being parsed correctly.
- Navigate to Management > Dashboards and search for Imperva SecureSphere Overview to see if the visualizations are populated with data.
- Trigger a test alert or generate traffic in Imperva that would be logged to confirm the data appears in Kibana.
For help with Elastic ingest tools, you can check the Common problems documentation.
You might encounter the following issues when configuring the integration:
- No data is being collected: Check that the Imperva device can reach the Elastic Agent host on the configured port. By default, this is port
9507. You can use tools liketcpdumporncto verify that traffic is arriving at the host. - Incorrect timestamps: If your logs don't include a timezone, the agent assumes the local timezone of the host where it's running. You can use the
tz_offsetsetting in the integration configuration to adjust this if the Imperva device is in a different timezone. - Parsing errors or missing fields: This integration expects logs in the Common Event Format (CEF). You'll need to ensure that your Imperva SecureSphere SIEM logging policy is configured to use the CEF format; otherwise, the agent won't be able to extract fields correctly.
- Connection refused for TCP: If you've enabled SSL/TLS for the TCP input, ensure that the certificates are valid and that the client (Imperva) is configured to use the correct CA. You should also check that the
listen_addressis set to0.0.0.0if you want the agent to listen on all network interfaces. - UDP packet loss: If you're using UDP and notice missing logs, you might be experiencing packet loss due to network congestion or small buffer sizes. You can try increasing the
max_message_sizein the UDP options or switching to TCP for more reliable delivery.
For more information on architectures that can be used for scaling this integration, check the Ingest Architectures documentation.
When you're dealing with high-volume log environments, particularly with syslog-based inputs like TCP or UDP used by Imperva SecureSphere, consider the following scaling strategies:
- Use a load balancer: Place a network load balancer in front of multiple Elastic Agents to distribute the incoming syslog traffic evenly. This ensures that no single agent becomes a bottleneck.
- Increase agent resources: Monitor the CPU and memory usage of your Elastic Agents. You might need to increase the allocated resources if you're processing a high volume of events per second.
- Adjust buffer sizes: For the UDP input, you can adjust the
max_message_sizeor kernel receive buffer sizes to prevent packet loss during traffic spikes. - Use dedicated collectors: For extremely high throughput, consider using Logstash as an intermediate collector and buffer before sending data to Elasticsearch.
You can also optimize performance by managing how much data you store. For example:
- Disable
preserve_original_eventin the integration settings if you don't need the raw log message stored in theevent.originalfield. This reduces the disk space used in Elasticsearch. - Use the
processorssetting to drop unnecessary fields or events at the agent level before they're sent over the network.
The following resources provide additional information for configuring Imperva SecureSphere:
These inputs can be used with this integration:
filestream
For more details about the Filestream input settings, check the Filebeat documentation.
To collect logs via Filestream, select Collect logs via Filestream and configure the following parameters:
- Filestream paths: The full path to the related log file.
tcp
For more details about the TCP input settings, check the Filebeat documentation.
To collect logs via TCP, select Collect logs via TCP and configure the following parameters:
Required Settings:
- Host
- Port
Common Optional Settings:
- Max Message Size - Maximum size of incoming messages
- Max Connections - Maximum number of concurrent connections
- Timeout - How long to wait for data before closing idle connections
- Line Delimiter - Character(s) that separate log messages
To enable encrypted connections, configure the following SSL settings:
SSL Settings:
- Enable SSL - Toggle to enable SSL/TLS encryption
- Certificate - Path to the SSL certificate file (
.crtor.pem) - Certificate Key - Path to the private key file (
.key) - Certificate Authorities - Path to CA certificate file for client certificate validation (optional)
- Client Authentication - Require client certificates (
none,optional, orrequired) - Supported Protocols - TLS versions to support (e.g.,
TLSv1.2,TLSv1.3)
Example SSL Configuration:
ssl.enabled: true
ssl.certificate: "/path/to/server.crt"
ssl.key: "/path/to/server.key"
ssl.certificate_authorities: ["/path/to/ca.crt"]
ssl.client_authentication: "optional"
udp
For more details about the UDP input settings, check the Filebeat documentation.
To collect logs via UDP, select Collect logs via UDP and configure the following parameters:
Required Settings:
- Host
- Port
Common Optional Settings:
- Max Message Size - Maximum size of UDP packets to accept (default: 10KB, max: 64KB)
- Read Buffer - UDP socket read buffer size for handling bursts of messages
- Read Timeout - How long to wait for incoming packets before checking for shutdown
The securesphere data stream provides events from Imperva SecureSphere of the following types:
- Security alerts and policy violations
- Database activity monitoring logs
- Administrative audit trails and system events
Exported fields
| Field | Description | Type |
|---|---|---|
| @timestamp | Event timestamp. | date |
| data_stream.dataset | Data stream dataset. | constant_keyword |
| data_stream.namespace | Data stream namespace. | constant_keyword |
| data_stream.type | Data stream type. | constant_keyword |
| event.dataset | Event dataset. | constant_keyword |
| event.module | Event module. | constant_keyword |
| imperva.securesphere.destination.address | ip | |
| imperva.securesphere.destination.port | long | |
| imperva.securesphere.destination.user_name | keyword | |
| imperva.securesphere.device.action | keyword | |
| imperva.securesphere.device.custom_string1.label | keyword | |
| imperva.securesphere.device.custom_string1.value | keyword | |
| imperva.securesphere.device.custom_string10.label | keyword | |
| imperva.securesphere.device.custom_string10.value | keyword | |
| imperva.securesphere.device.custom_string11.label | keyword | |
| imperva.securesphere.device.custom_string11.value | keyword | |
| imperva.securesphere.device.custom_string12.label | keyword | |
| imperva.securesphere.device.custom_string12.value | keyword | |
| imperva.securesphere.device.custom_string13.label | keyword | |
| imperva.securesphere.device.custom_string13.value | keyword | |
| imperva.securesphere.device.custom_string14.label | keyword | |
| imperva.securesphere.device.custom_string14.value | keyword | |
| imperva.securesphere.device.custom_string15.label | keyword | |
| imperva.securesphere.device.custom_string15.value | keyword | |
| imperva.securesphere.device.custom_string16.label | keyword | |
| imperva.securesphere.device.custom_string16.value | keyword | |
| imperva.securesphere.device.custom_string17.label | keyword | |
| imperva.securesphere.device.custom_string17.value | keyword | |
| imperva.securesphere.device.custom_string18.label | keyword | |
| imperva.securesphere.device.custom_string18.value | keyword | |
| imperva.securesphere.device.custom_string19.label | keyword | |
| imperva.securesphere.device.custom_string19.value | keyword | |
| imperva.securesphere.device.custom_string2.label | keyword | |
| imperva.securesphere.device.custom_string2.value | keyword | |
| imperva.securesphere.device.custom_string20.label | keyword | |
| imperva.securesphere.device.custom_string20.value | keyword | |
| imperva.securesphere.device.custom_string21.label | keyword | |
| imperva.securesphere.device.custom_string21.value | keyword | |
| imperva.securesphere.device.custom_string3.label | keyword | |
| imperva.securesphere.device.custom_string3.value | keyword | |
| imperva.securesphere.device.custom_string4.label | keyword | |
| imperva.securesphere.device.custom_string4.value | keyword | |
| imperva.securesphere.device.custom_string5.label | keyword | |
| imperva.securesphere.device.custom_string5.value | keyword | |
| imperva.securesphere.device.custom_string6.label | keyword | |
| imperva.securesphere.device.custom_string6.value | keyword | |
| imperva.securesphere.device.custom_string7.label | keyword | |
| imperva.securesphere.device.custom_string7.value | keyword | |
| imperva.securesphere.device.custom_string8.label | keyword | |
| imperva.securesphere.device.custom_string8.value | keyword | |
| imperva.securesphere.device.custom_string9.label | keyword | |
| imperva.securesphere.device.custom_string9.value | keyword | |
| imperva.securesphere.device.event.category | keyword | |
| imperva.securesphere.device.event.class_id | keyword | |
| imperva.securesphere.device.product | keyword | |
| imperva.securesphere.device.receipt_time | date | |
| imperva.securesphere.device.vendor | keyword | |
| imperva.securesphere.device.version | keyword | |
| imperva.securesphere.name | keyword | |
| imperva.securesphere.severity | keyword | |
| imperva.securesphere.source.address | ip | |
| imperva.securesphere.source.port | long | |
| imperva.securesphere.source.user_name | keyword | |
| imperva.securesphere.transport_protocol | keyword | |
| imperva.securesphere.version | keyword | |
| input.type | Type of filebeat input. | keyword |
| log.file.device_id | ID of the device containing the filesystem where the file resides. | keyword |
| log.file.fingerprint | The sha256 fingerprint identity of the file when fingerprinting is enabled. | keyword |
| log.file.idxhi | The high-order part of a unique identifier that is associated with a file. (Windows-only) | keyword |
| log.file.idxlo | The low-order part of a unique identifier that is associated with a file. (Windows-only) | keyword |
| log.file.inode | Inode number of the log file. | keyword |
| log.file.vol | The serial number of the volume that contains a file. (Windows-only) | keyword |
| log.offset | Log offset. | long |
| log.source.address | Source address from which the log event was read / sent from. | keyword |
| tags | User defined tags. | keyword |
Example
{
    "@timestamp": "2023-10-05T18:33:02.000Z",
    "agent": {
        "ephemeral_id": "94608df6-6778-4ec4-99dc-d0cd37d583d8",
        "id": "0412638f-dd94-4c0e-b349-e99a0886d9f0",
        "name": "docker-fleet-agent",
        "type": "filebeat",
        "version": "8.10.1"
    },
    "data_stream": {
        "dataset": "imperva.securesphere",
        "namespace": "ep",
        "type": "logs"
    },
    "ecs": {
        "version": "8.17.0"
    },
    "elastic_agent": {
        "id": "0412638f-dd94-4c0e-b349-e99a0886d9f0",
        "snapshot": false,
        "version": "8.10.1"
    },
    "event": {
        "agent_id_status": "verified",
        "code": "User logged in",
        "dataset": "imperva.securesphere",
        "ingested": "2023-12-01T09:10:18Z",
        "kind": "event",
        "original": "<14>CEF:0|Imperva Inc.|SecureSphere|15.1.0|User logged in|User admin logged in from 81.2.69.142.|High|suser=admin rt=Oct 05 2023 18:33:02 cat=SystemEvent",
        "severity": 7
    },
    "imperva": {
        "securesphere": {
            "device": {
                "event": {
                    "category": "SystemEvent",
                    "class_id": "User logged in"
                },
                "product": "SecureSphere",
                "receipt_time": "2023-10-05T18:33:02.000Z",
                "vendor": "Imperva Inc.",
                "version": "15.1.0"
            },
            "name": "User admin logged in from 81.2.69.142.",
            "severity": "High",
            "source": {
                "user_name": "admin"
            },
            "version": "0"
        }
    },
    "input": {
        "type": "udp"
    },
    "log": {
        "source": {
            "address": "192.168.249.7:48857"
        }
    },
    "message": "User admin logged in from 81.2.69.142.",
    "observer": {
        "product": "SecureSphere",
        "vendor": "Imperva Inc.",
        "version": "15.1.0"
    },
    "related": {
        "user": [
            "admin"
        ]
    },
    "source": {
        "user": {
            "name": "admin"
        }
    },
    "tags": [
        "preserve_original_event",
        "preserve_duplicate_custom_fields",
        "forwarded",
        "imperva.securesphere"
    ]
}
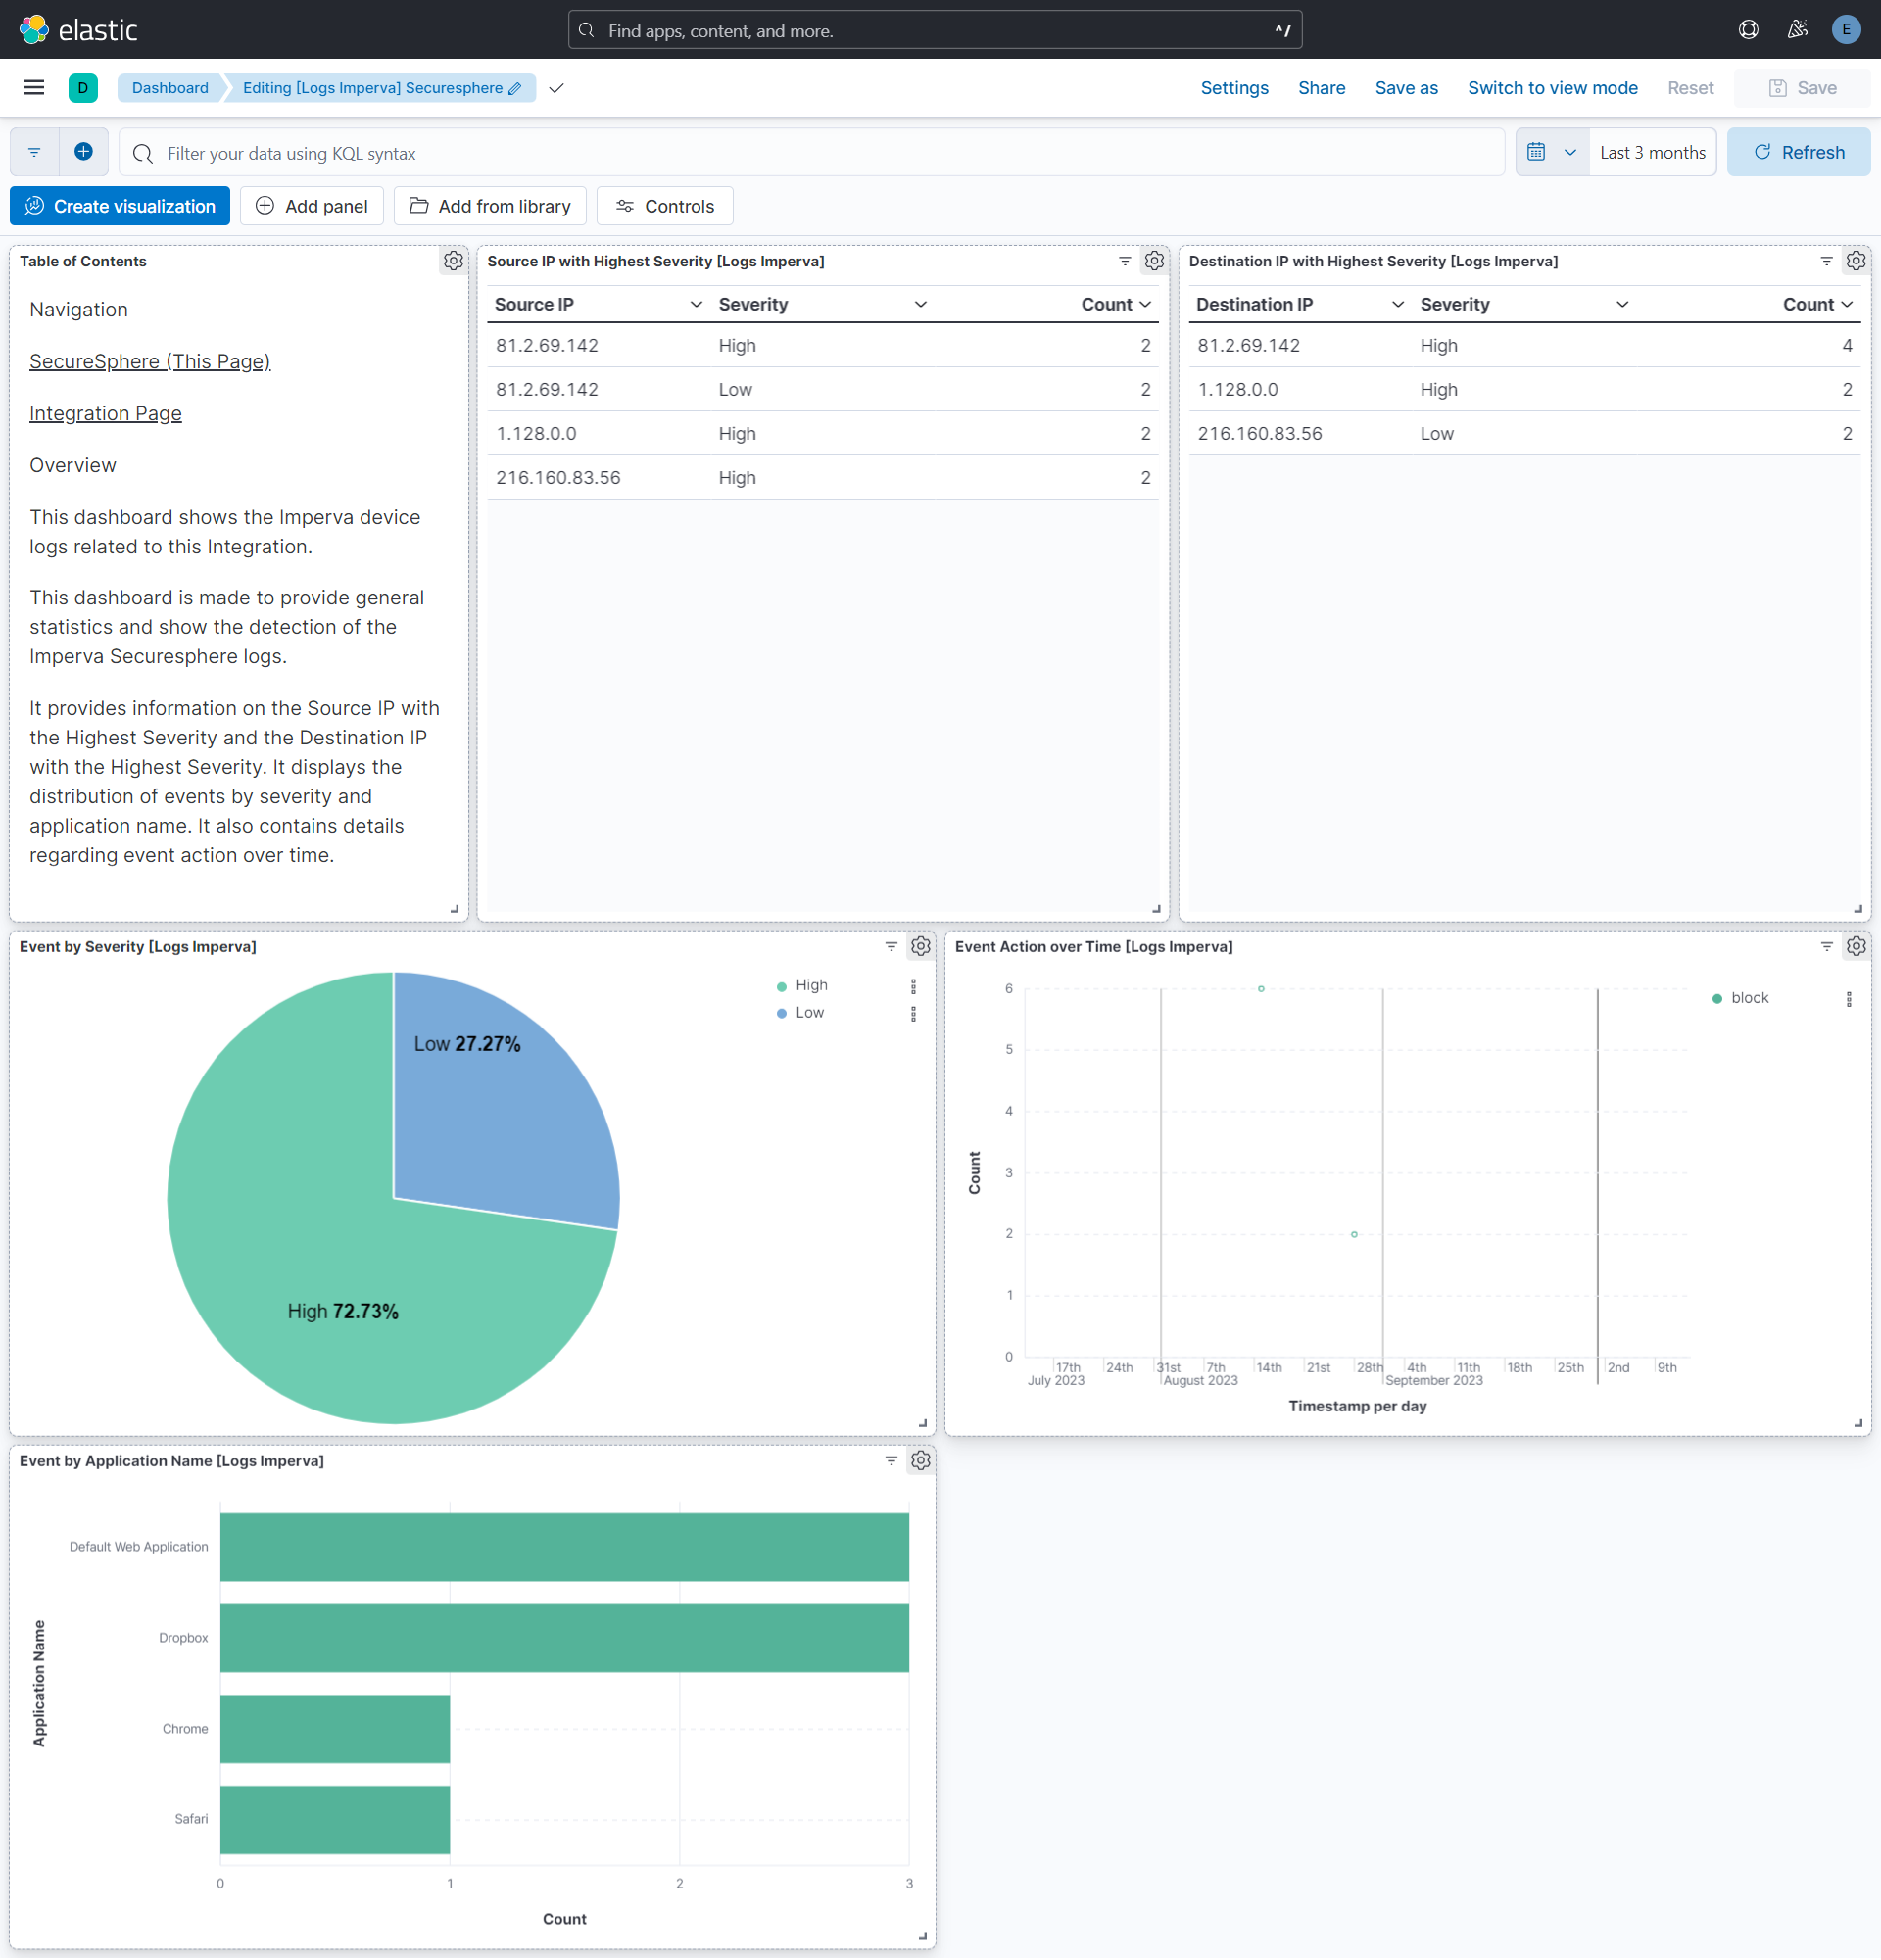
This integration includes one or more Kibana dashboards that visualizes the data collected by the integration. The screenshots below illustrate how the ingested data is displayed.
Changelog
| Version | Details | Minimum Kibana version |
|---|---|---|
| 1.10.1 | Bug fix (View pull request) Remove top level note from docs |
9.0.0 8.11.0 |
| 1.10.0 | Enhancement (View pull request) Update documentation. |
9.0.0 8.11.0 |
| 1.9.1 | Bug fix (View pull request) Fix bug while adding additional processors for UDP and filestream inputs. |
9.0.0 8.11.0 |
| 1.9.0 | Enhancement (View pull request) Preserve event.original on pipeline error. |
9.0.0 8.11.0 |
| 1.8.2 | Enhancement (View pull request) Generate processor tags and normalize error handler. |
9.0.0 8.11.0 |
| 1.8.1 | Enhancement (View pull request) Fixed H1s for SEO purpose. |
9.0.0 8.11.0 |
| 1.8.0 | Enhancement (View pull request) Removed markdown links from dashboards. |
9.0.0 8.11.0 |
| 1.7.1 | Enhancement (View pull request) Changed owners. |
9.0.0 8.11.0 |
| 1.7.0 | Enhancement (View pull request) Remove duplicated installation instructions from the documentation. |
9.0.0 8.11.0 |
| 1.6.0 | Enhancement (View pull request) Allow @custom pipeline access to event.original without setting preserve_original_event. |
9.0.0 8.11.0 |
| 1.5.0 | Enhancement (View pull request) Support stack version 9.0. |
9.0.0 8.10.1 |
| 1.4.1 | Bug fix (View pull request) Updated SSL description to be uniform and to include links to documentation. |
8.10.1 |
| 1.4.0 | Enhancement (View pull request) Add support for additional custom string fields. |
8.10.1 |
| 1.3.0 | Enhancement (View pull request) ECS version updated to 8.17.0. |
8.10.1 |
| 1.2.0 | Enhancement (View pull request) Add configuration for custom filestream options. Ensure filestream fingerprint is disabled in system test. |
8.10.1 |
| 1.1.0 | Enhancement (View pull request) Update package spec to 3.0.3. |
8.10.1 |
| 1.0.1 | Enhancement (View pull request) Changed owners |
8.10.1 |
| 1.0.0 | Enhancement (View pull request) Release package as GA. |
8.10.1 |
| 0.20.2 | Bug fix (View pull request) Fix exclude_files pattern. |
8.10.1 |
| 0.20.1 | Bug fix (View pull request) Adapt fields for changes in file system info. |
8.10.1 |
| 0.20.0 | Enhancement (View pull request) ECS version updated to 8.11.0. |
8.10.1 |
| 0.19.0 | Enhancement (View pull request) Replace RSA2ELK with Syslog integration. |
8.10.1 |
| 0.18.0 | Enhancement (View pull request) ECS version updated to 8.10.0. |
8.0.0 7.14.1 |
| 0.17.0 | Enhancement (View pull request) Update package to ECS 8.9.0. |
8.0.0 7.14.1 |
| 0.16.0 | Enhancement (View pull request) Ensure event.kind is correctly set for pipeline errors. |
8.0.0 7.14.1 |
| 0.15.0 | Enhancement (View pull request) Update package to ECS 8.8.0. |
8.0.0 7.14.1 |
| 0.14.0 | Enhancement (View pull request) Update package-spec version to 2.7.0. |
8.0.0 7.14.1 |
| 0.13.0 | Enhancement (View pull request) Update package to ECS 8.7.0. |
— |
| 0.12.0 | Enhancement (View pull request) Update package to ECS 8.6.0. |
— |
| 0.11.2 | Bug fix (View pull request) Update docs to match field definitions. |
— |
| 0.11.1 | Bug fix (View pull request) Remove duplicate fields. |
— |
| 0.11.0 | Enhancement (View pull request) Update package to ECS 8.5.0. |
— |
| 0.10.1 | Enhancement (View pull request) Use ECS geo.location definition. |
— |
| 0.10.0 | Enhancement (View pull request) Update package to ECS 8.4.0 |
— |
| 0.9.0 | Enhancement (View pull request) Update package to ECS 8.3.0. |
— |
| 0.8.0 | Enhancement (View pull request) Update to ECS 8.2.0 |
— |
| 0.7.0 | Enhancement (View pull request) Update to ECS 8.0.0 |
— |
| 0.6.1 | Bug fix (View pull request) Regenerate test files using the new GeoIP database |
— |
| 0.6.0 | Enhancement (View pull request) Add 8.0.0 version constraint |
— |
| 0.5.4 | Enhancement (View pull request) Uniform with guidelines |
— |
| 0.5.3 | Enhancement (View pull request) Update Title and Description. |
— |
| 0.5.2 | Bug fix (View pull request) Fixed a bug that prevents the package from working in 7.16. |
— |
| 0.5.1 | Bug fix (View pull request) Fix logic that checks for the 'forwarded' tag |
— |
| 0.5.0 | Enhancement (View pull request) Update to ECS 1.12.0 |
— |
| 0.4.3 | Bug fix (View pull request) Requires version 7.14.1 of the stack |
— |
| 0.4.2 | Enhancement (View pull request) Convert to generated ECS fields |
— |
| 0.4.1 | Enhancement (View pull request) update to ECS 1.11.0 |
— |
| 0.4.0 | Enhancement (View pull request) Update integration description |
— |
| 0.3.0 | Enhancement (View pull request) Set "event.module" and "event.dataset" |
— |
| 0.2.0 | Enhancement (View pull request) update to ECS 1.10.0 and adding event.original options |
— |
| 0.1.4 | Enhancement (View pull request) update to ECS 1.9.0 |
— |
| 0.1.0 | Enhancement (View pull request) initial release |
— |