Logstash
Elastic Cloud Serverless projects are autoscaled environments, fully managed by Elastic and available on Elastic Cloud. Availability This functionality is generally available and ready for production usage. Elastic Cloud Serverless projects are autoscaled environments, fully managed by Elastic and available on Elastic Cloud. Availability This functionality is generally available and ready for production usage. The Elastic Stack includes Elastic's core products such as Elasticsearch, Kibana, Logstash, and Beats. Availability This functionality is generally available and ready for production usage. Unless stated otherwise on the page, this functionality is available when your Elastic Stack is deployed on Elastic Cloud Hosted, Elastic Cloud Enterprise, Elastic Cloud on Kubernetes, and self-managed environments. This documentation corresponds to the latest patch available for each minor version. If you're not using the latest patch, check the release notes for changes.
Serverless Observability
Generally available
Serverless Security
Generally available
Stack
9.0+
Generally available since 9.0
| Version | 2.11.3 (View all) |
| Subscription level What's this? |
Basic |
| Developed by What's this? |
Elastic |
| Ingestion method(s) | API, File |
| Minimum Kibana version(s) | 9.0.0 8.17.0 |
This integration collects logs and metrics from Logstash instances.
You can find additional information about monitoring Logstash with the Logstash integration in the Logstash Reference: Monitoring Logstash with Elastic Agent.
The logstash package works with Logstash 8.5.0 and later
Metric collection for the Logstash integration can be done via Elastic Agent (preferred) or with Stack Monitoring. By utilizing Elastic Agent we are able to query additional monitoring APIs and provide additional dashboards, which provide the best view into your Logstash deployment and pipeline execution.
Elastic Agent based metrics collection is not compatible with the Stack Monitoring UI inside Kibana, please only select Metrics (Elastic Agent).
Users that prefer the Stack Monitoring UI should uncheck Metrics (Elastic Agent) and continue to use Metrics (Stack Monitoring).
The health report api is available starting with Logstash 8.16.0, which provides the health_report dataset for Node health and Pipeline health dashboards
An example event for 'health_report' looks as following:
Exported fields
| Field | Description | Type | Metric Type |
|---|---|---|---|
| @timestamp | Date/time when the event originated. This is the date/time extracted from the event, typically representing when the event was generated by the source. If the event source has no original timestamp, this value is typically populated by the first time the event was received by the pipeline. Required field for all events. | date | |
| agent.id | Unique identifier of this agent (if one exists). Example: For Beats this would be beat.id. | keyword | |
| data_stream.dataset | The field can contain anything that makes sense to signify the source of the data. Examples include nginx.access, prometheus, endpoint etc. For data streams that otherwise fit, but that do not have dataset set we use the value "generic" for the dataset value. event.dataset should have the same value as data_stream.dataset. Beyond the Elasticsearch data stream naming criteria noted above, the dataset value has additional restrictions: * Must not contain - * No longer than 100 characters |
constant_keyword | |
| data_stream.namespace | A user defined namespace. Namespaces are useful to allow grouping of data. Many users already organize their indices this way, and the data stream naming scheme now provides this best practice as a default. Many users will populate this field with default. If no value is used, it falls back to default. Beyond the Elasticsearch index naming criteria noted above, namespace value has the additional restrictions: * Must not contain - * No longer than 100 characters |
constant_keyword | |
| data_stream.type | An overarching type for the data stream. Currently allowed values are "logs" and "metrics". We expect to also add "traces" and "synthetics" in the near future. | constant_keyword | |
| ecs.version | ECS version this event conforms to. ecs.version is a required field and must exist in all events. When querying across multiple indices -- which may conform to slightly different ECS versions -- this field lets integrations adjust to the schema version of the events. |
keyword | |
| error.message | Error message. | match_only_text | |
| event.dataset | Name of the dataset. If an event source publishes more than one type of log or events (e.g. access log, error log), the dataset is used to specify which one the event comes from. It's recommended but not required to start the dataset name with the module name, followed by a dot, then the dataset name. | keyword | |
| event.duration | Duration of the event in nanoseconds. If event.start and event.end are known this value should be the difference between the end and start time. | long | |
| event.module | Name of the module this data is coming from. If your monitoring agent supports the concept of modules or plugins to process events of a given source (e.g. Apache logs), event.module should contain the name of this module. |
keyword | |
| logstash.node.address | keyword | ||
| logstash.node.name | keyword | ||
| logstash.node.status | keyword | ||
| logstash.node.symptom | keyword | ||
| logstash.node.symptom.text | Multi-field of logstash.node.symptom. |
match_only_text | |
| logstash.node.uuid | keyword | ||
| logstash.node.version | keyword | ||
| logstash.pipeline.diagnosis.action | keyword | ||
| logstash.pipeline.diagnosis.action.text | Multi-field of logstash.pipeline.diagnosis.action. |
match_only_text | |
| logstash.pipeline.diagnosis.cause | keyword | ||
| logstash.pipeline.diagnosis.cause.text | Multi-field of logstash.pipeline.diagnosis.cause. |
match_only_text | |
| logstash.pipeline.diagnosis.help_url | keyword | ||
| logstash.pipeline.diagnosis.help_url.text | Multi-field of logstash.pipeline.diagnosis.help_url. |
match_only_text | |
| logstash.pipeline.diagnosis.id | keyword | ||
| logstash.pipeline.flow.worker_utilization.current | float | gauge | |
| logstash.pipeline.flow.worker_utilization.last_15_minutes | float | gauge | |
| logstash.pipeline.flow.worker_utilization.last_1_hour | float | gauge | |
| logstash.pipeline.flow.worker_utilization.last_1_minute | float | gauge | |
| logstash.pipeline.flow.worker_utilization.last_24_hours | float | gauge | |
| logstash.pipeline.flow.worker_utilization.last_5_minutes | float | gauge | |
| logstash.pipeline.flow.worker_utilization.lifetime | float | gauge | |
| logstash.pipeline.id | keyword | ||
| logstash.pipeline.impacts.description | keyword | ||
| logstash.pipeline.impacts.description.text | Multi-field of logstash.pipeline.impacts.description. |
match_only_text | |
| logstash.pipeline.impacts.id | keyword | ||
| logstash.pipeline.impacts.impact_areas | keyword | ||
| logstash.pipeline.impacts.severity | short | gauge | |
| logstash.pipeline.state | keyword | ||
| logstash.pipeline.status | keyword | ||
| logstash.pipeline.symptom | keyword | ||
| logstash.pipeline.symptom.text | Multi-field of logstash.pipeline.symptom. |
match_only_text | |
| process.pid | Process id. | long | |
| service.address | Address where data about this service was collected from. This should be a URI, network address (ipv4:port or [ipv6]:port) or a resource path (sockets). | keyword | |
| service.hostname | Hostname of the service | keyword | |
| service.id | Unique identifier of the running service. If the service is comprised of many nodes, the service.id should be the same for all nodes. This id should uniquely identify the service. This makes it possible to correlate logs and metrics for one specific service, no matter which particular node emitted the event. Note that if you need to see the events from one specific host of the service, you should filter on that host.name or host.id instead. |
keyword | |
| service.name | Name of the service data is collected from. The name of the service is normally user given. This allows for distributed services that run on multiple hosts to correlate the related instances based on the name. In the case of Elasticsearch the service.name could contain the cluster name. For Beats the service.name is by default a copy of the service.type field if no name is specified. |
keyword | |
| service.type | The type of the service data is collected from. The type can be used to group and correlate logs and metrics from one service type. Example: If logs or metrics are collected from Elasticsearch, service.type would be elasticsearch. |
keyword | |
| service.version | Version of the service the data was collected from. This allows to look at a data set only for a specific version of a service. | keyword |
Example
{
    "logstash": {
        "pipeline": {
            "symptom": "The pipeline is unhealthy; 1 area is impacted and 1 diagnosis is available",
            "diagnosis": {
                "help_url": "https://www.elastic.co/guide/en/logstash/8.17/health-report-pipeline-status.html#terminated",
                "action": "view logs to determine the cause of abnormal pipeline shutdown",
                "cause": "pipeline is not running, likely because it has encountered an error",
                "id": "logstash:health:pipeline:status:diagnosis:terminated"
            },
            "state": "TERMINATED",
            "impacts": {
                "severity": 1,
                "impact_areas": [
                    "pipeline_execution"
                ],
                "description": "the pipeline is not currently processing",
                "id": "logstash:health:pipeline:status:impact:not_processing"
            },
            "id": "bad",
            "flow": {
                "worker_utilization": {
                    "current": 0.000001826,
                    "last_24_hours": 0.000001826,
                    "last_5_minutes": 0.000001826,
                    "last_1_hour": 0.000001826,
                    "last_15_minutes": 0.000001826,
                    "lifetime": 0.000001826,
                    "last_1_minute": 0.000001826
                }
            },
            "status": "red"
        },
        "node": {
            "address": "0.0.0.0:9600",
            "name": "9cbebe0b66d9",
            "version": "8.17.1",
            "uuid": "1a3d4358-0d0a-4b82-8cf7-21f59ea592e8"
        }
    }
}
This is the node dataset, which drives the Node dashboard pages.
Exported fields
| Field | Description | Type | Metric Type |
|---|---|---|---|
| @timestamp | Date/time when the event originated. This is the date/time extracted from the event, typically representing when the event was generated by the source. If the event source has no original timestamp, this value is typically populated by the first time the event was received by the pipeline. Required field for all events. | date | |
| agent.id | Unique identifier of this agent (if one exists). Example: For Beats this would be beat.id. | keyword | |
| cloud.account.id | The cloud account or organization id used to identify different entities in a multi-tenant environment. Examples: AWS account id, Google Cloud ORG Id, or other unique identifier. | keyword | |
| cloud.availability_zone | Availability zone in which this host, resource, or service is located. | keyword | |
| cloud.image.id | Image ID for the cloud instance. | keyword | |
| cloud.instance.id | Instance ID of the host machine. | keyword | |
| cloud.instance.name | Instance name of the host machine. | keyword | |
| cloud.machine.type | Machine type of the host machine. | keyword | |
| cloud.project.id | The cloud project identifier. Examples: Google Cloud Project id, Azure Project id. | keyword | |
| cloud.provider | Name of the cloud provider. Example values are aws, azure, gcp, or digitalocean. | keyword | |
| cloud.region | Region in which this host, resource, or service is located. | keyword | |
| cluster_uuid | alias | ||
| container.id | Unique container id. | keyword | |
| container.image.name | Name of the image the container was built on. | keyword | |
| container.labels | Image labels. | object | |
| container.name | Container name. | keyword | |
| data_stream.dataset | The field can contain anything that makes sense to signify the source of the data. Examples include nginx.access, prometheus, endpoint etc. For data streams that otherwise fit, but that do not have dataset set we use the value "generic" for the dataset value. event.dataset should have the same value as data_stream.dataset. Beyond the Elasticsearch data stream naming criteria noted above, the dataset value has additional restrictions: * Must not contain - * No longer than 100 characters |
constant_keyword | |
| data_stream.namespace | A user defined namespace. Namespaces are useful to allow grouping of data. Many users already organize their indices this way, and the data stream naming scheme now provides this best practice as a default. Many users will populate this field with default. If no value is used, it falls back to default. Beyond the Elasticsearch index naming criteria noted above, namespace value has the additional restrictions: * Must not contain - * No longer than 100 characters |
constant_keyword | |
| data_stream.type | An overarching type for the data stream. Currently allowed values are "logs" and "metrics". We expect to also add "traces" and "synthetics" in the near future. | constant_keyword | |
| ecs.version | ECS version this event conforms to. ecs.version is a required field and must exist in all events. When querying across multiple indices -- which may conform to slightly different ECS versions -- this field lets integrations adjust to the schema version of the events. |
keyword | |
| error.message | Error message. | match_only_text | |
| event.dataset | Name of the dataset. If an event source publishes more than one type of log or events (e.g. access log, error log), the dataset is used to specify which one the event comes from. It's recommended but not required to start the dataset name with the module name, followed by a dot, then the dataset name. | keyword | |
| event.duration | Duration of the event in nanoseconds. If event.start and event.end are known this value should be the difference between the end and start time. | long | |
| event.module | Name of the module this data is coming from. If your monitoring agent supports the concept of modules or plugins to process events of a given source (e.g. Apache logs), event.module should contain the name of this module. |
keyword | |
| host.architecture | Operating system architecture. | keyword | |
| host.containerized | If the host is a container. | boolean | |
| host.domain | Name of the domain of which the host is a member. For example, on Windows this could be the host's Active Directory domain or NetBIOS domain name. For Linux this could be the domain of the host's LDAP provider. | keyword | |
| host.hostname | Hostname of the host. It normally contains what the hostname command returns on the host machine. |
keyword | |
| host.id | Unique host id. As hostname is not always unique, use values that are meaningful in your environment. Example: The current usage of beat.name. |
keyword | |
| host.ip | Host ip addresses. | ip | |
| host.mac | Host MAC addresses. The notation format from RFC 7042 is suggested: Each octet (that is, 8-bit byte) is represented by two [uppercase] hexadecimal digits giving the value of the octet as an unsigned integer. Successive octets are separated by a hyphen. | keyword | |
| host.name | Name of the host. It can contain what hostname returns on Unix systems, the fully qualified domain name, or a name specified by the user. The sender decides which value to use. |
keyword | |
| host.os.build | OS build information. | keyword | |
| host.os.codename | OS codename, if any. | keyword | |
| host.os.family | OS family (such as redhat, debian, freebsd, windows). | keyword | |
| host.os.kernel | Operating system kernel version as a raw string. | keyword | |
| host.os.name | Operating system name, without the version. | keyword | |
| host.os.name.text | Multi-field of host.os.name. |
match_only_text | |
| host.os.platform | Operating system platform (such centos, ubuntu, windows). | keyword | |
| host.os.version | Operating system version as a raw string. | keyword | |
| host.type | Type of host. For Cloud providers this can be the machine type like t2.medium. If vm, this could be the container, for example, or other information meaningful in your environment. |
keyword | |
| input.type | keyword | ||
| logstash.elasticsearch.cluster.id | keyword | ||
| logstash.host.address | alias | ||
| logstash.host.name | alias | ||
| logstash.node.stats.events.duration_in_millis | long | counter | |
| logstash.node.stats.events.filtered | Filtered events counter | long | counter |
| logstash.node.stats.events.in | Incoming events counter | long | counter |
| logstash.node.stats.events.out | Outgoing events counter | long | counter |
| logstash.node.stats.events.queue_push_duration_in_millis | long | counter | |
| logstash.node.stats.jvm.gc.collectors.old.collection_count | long | counter | |
| logstash.node.stats.jvm.gc.collectors.old.collection_time_in_millis | long | counter | |
| logstash.node.stats.jvm.gc.collectors.young.collection_count | long | counter | |
| logstash.node.stats.jvm.gc.collectors.young.collection_time_in_millis | long | counter | |
| logstash.node.stats.jvm.mem.heap_committed_in_bytes | long | gauge | |
| logstash.node.stats.jvm.mem.heap_max_in_bytes | long | gauge | |
| logstash.node.stats.jvm.mem.heap_used_in_bytes | long | gauge | |
| logstash.node.stats.jvm.mem.heap_used_percent | long | gauge | |
| logstash.node.stats.jvm.mem.non_heap_committed_in_bytes | long | gauge | |
| logstash.node.stats.jvm.mem.non_heap_used_in_bytes | long | gauge | |
| logstash.node.stats.jvm.threads.count | current number of threads | long | gauge |
| logstash.node.stats.jvm.threads.peak_count | peak number of threads | long | gauge |
| logstash.node.stats.jvm.uptime_in_millis | long | counter | |
| logstash.node.stats.logstash.ephemeral_id | keyword | ||
| logstash.node.stats.logstash.host | keyword | ||
| logstash.node.stats.logstash.http_address | keyword | ||
| logstash.node.stats.logstash.name | keyword | ||
| logstash.node.stats.logstash.pipeline.batch_delay | long | gauge | |
| logstash.node.stats.logstash.pipeline.batch_size | long | gauge | |
| logstash.node.stats.logstash.pipeline.workers | long | gauge | |
| logstash.node.stats.logstash.pipelines | keyword | ||
| logstash.node.stats.logstash.snapshot | boolean | ||
| logstash.node.stats.logstash.status | keyword | ||
| logstash.node.stats.logstash.uuid | keyword | ||
| logstash.node.stats.logstash.version | keyword | ||
| logstash.node.stats.os.cgroup.cpu.cfs_quota_micros | long | gauge | |
| logstash.node.stats.os.cgroup.cpu.control_group | text | ||
| logstash.node.stats.os.cgroup.cpu.stat.number_of_elapsed_periods | long | gauge | |
| logstash.node.stats.os.cgroup.cpu.stat.number_of_times_throttled | long | counter | |
| logstash.node.stats.os.cgroup.cpu.stat.time_throttled_nanos | long | counter | |
| logstash.node.stats.os.cgroup.cpuacct.control_group | text | ||
| logstash.node.stats.os.cgroup.cpuacct.usage_nanos | long | counter | |
| logstash.node.stats.os.cpu.load_average.15m | half_float | gauge | |
| logstash.node.stats.os.cpu.load_average.1m | half_float | gauge | |
| logstash.node.stats.os.cpu.load_average.5m | half_float | gauge | |
| logstash.node.stats.os.cpu.percent | double | gauge | |
| logstash.node.stats.os.cpu.total_in_millis | long | counter | |
| logstash.node.stats.pipelines.ephemeral_id | keyword | ||
| logstash.node.stats.pipelines.events.duration_in_millis | long | counter | |
| logstash.node.stats.pipelines.events.filtered | long | counter | |
| logstash.node.stats.pipelines.events.in | long | counter | |
| logstash.node.stats.pipelines.events.out | long | counter | |
| logstash.node.stats.pipelines.events.queue_push_duration_in_millis | long | counter | |
| logstash.node.stats.pipelines.hash | keyword | ||
| logstash.node.stats.pipelines.id | keyword | ||
| logstash.node.stats.pipelines.queue.events_count | long | gauge | |
| logstash.node.stats.pipelines.queue.max_queue_size_in_bytes | long | gauge | |
| logstash.node.stats.pipelines.queue.queue_size_in_bytes | long | gauge | |
| logstash.node.stats.pipelines.queue.type | keyword | ||
| logstash.node.stats.pipelines.reloads.failures | long | counter | |
| logstash.node.stats.pipelines.reloads.successes | long | counter | |
| logstash.node.stats.process.cpu.load_average.15m | half_float | gauge | |
| logstash.node.stats.process.cpu.load_average.1m | half_float | gauge | |
| logstash.node.stats.process.cpu.load_average.5m | half_float | gauge | |
| logstash.node.stats.process.cpu.percent | double | gauge | |
| logstash.node.stats.process.cpu.total_in_millis | long | counter | |
| logstash.node.stats.process.max_file_descriptors | long | gauge | |
| logstash.node.stats.process.mem.total_virtual_in_bytes | long | gauge | |
| logstash.node.stats.process.open_file_descriptors | long | gauge | |
| logstash.node.stats.process.peak_open_file_descriptors | long | gauge | |
| logstash.node.stats.queue.events_count | long | gauge | |
| logstash.node.stats.reloads.failures | long | counter | |
| logstash.node.stats.reloads.successes | long | counter | |
| logstash.node.stats.timestamp | date | ||
| logstash.pipeline.name | alias | ||
| process.pid | Process id. | long | |
| service.address | Address where data about this service was collected from. This should be a URI, network address (ipv4:port or [ipv6]:port) or a resource path (sockets). | keyword | |
| service.hostname | Hostname of the service | keyword | |
| service.id | Unique identifier of the running service. If the service is comprised of many nodes, the service.id should be the same for all nodes. This id should uniquely identify the service. This makes it possible to correlate logs and metrics for one specific service, no matter which particular node emitted the event. Note that if you need to see the events from one specific host of the service, you should filter on that host.name or host.id instead. |
keyword | |
| service.name | Name of the service data is collected from. The name of the service is normally user given. This allows for distributed services that run on multiple hosts to correlate the related instances based on the name. In the case of Elasticsearch the service.name could contain the cluster name. For Beats the service.name is by default a copy of the service.type field if no name is specified. |
keyword | |
| service.type | The type of the service data is collected from. The type can be used to group and correlate logs and metrics from one service type. Example: If logs or metrics are collected from Elasticsearch, service.type would be elasticsearch. |
keyword | |
| service.version | Version of the service the data was collected from. This allows to look at a data set only for a specific version of a service. | keyword |
Example
{
    "logstash": {
        "node": {
            "stats": {
                "jvm": {
                    "mem": {
                        "heap_committed_in_bytes": 264241152,
                        "heap_used_percent": 2,
                        "heap_max_in_bytes": 5184159742,
                        "non_heap_committed_in_bytes": 191889408,
                        "heap_used_in_bytes": 143564464,
                        "non_heap_used_in_bytes": 180940656
                    },
                    "threads": {
                        "count": 83,
                        "peak_count": 85
                    },
                    "uptime_in_millis": 448206
                },
                "logstash": {
                    "pipeline": {
                        "batch_delay": 50,
                        "batch_size": 125,
                        "workers": 8
                    },
                    "pipelines": [
                        "standalone-pipeline",
                        "pipeline-with-memory-queue",
                        "pipeline-with-persisted-queue"
                    ],
                    "http_address": "0.0.0.0:9600",
                    "name": "21d61ee7529e",
                    "host": "21d61ee7529e",
                    "ephemeral_id": "fa27552b-e31d-463d-a5db-f470e6c2f0ba",
                    "version": "8.6.0",
                    "uuid": "2566e68f-ea0e-4dd0-8b65-17bc7bd9f685",
                    "snapshot": false,
                    "status": "green"
                },
                "process": {
                    "open_file_descriptors": 94,
                    "mem": {
                        "total_virtual_in_bytes": 11442712576
                    },
                    "max_file_descriptors": 1048576,
                    "cpu": {
                        "load_average": {
                            "5m": 1.49,
                            "15m": 1.23,
                            "1m": 0.74
                        },
                        "total_in_millis": 130690,
                        "percent": 2
                    },
                    "peak_open_file_descriptors": 95
                },
                "os": {
                    "cpu": {
                        "load_average": {
                            "5m": 1.49,
                            "15m": 1.23,
                            "1m": 0.74
                        },
                        "total_in_millis": 130690,
                        "percent": 2
                    },
                    "cgroup": {}
                },
                "events": {
                    "filtered": 27752,
                    "in": 28442,
                    "queue_push_duration_in_millis": 597,
                    "duration_in_millis": 3202220,
                    "out": 27752
                },
                "queue": {
                    "events_count": 0
                },
                "reloads": {
                    "failures": 0,
                    "successes": 0
                }
            }
        }
    },
    "input": {
        "type": "cel"
    },
    "agent": {
        "name": "MacBook-Pro.local",
        "id": "b88de78b-7bd7-49ae-99d7-f68ea18070c4",
        "type": "filebeat",
        "ephemeral_id": "e24a6e70-8e93-4d18-8535-319e63c81bc8",
        "version": "8.10.1"
    },
    "@timestamp": "2023-10-04T18:53:48.769Z",
    "ecs": {
        "version": "8.0.0"
    },
    "data_stream": {
        "namespace": "default",
        "type": "metrics",
        "dataset": "logstash.node"
    },
    "elastic_agent": {
        "id": "b88de78b-7bd7-49ae-99d7-f68ea18070c4",
        "version": "8.10.1",
        "snapshot": false
    },
    "host": {
        "hostname": "macbook-pro.local",
        "os": {
            "build": "22F82",
            "kernel": "22.5.0",
            "name": "macOS",
            "family": "darwin",
            "type": "macos",
            "version": "13.4.1",
            "platform": "darwin"
        },
        "ip": [
            "192.168.1.184"
        ],
        "name": "macbook-pro.local",
        "id": "AA4215F6-994F-5CCE-B6F2-B6AED75AE125",
        "mac": [
            "AC-DE-48-00-11-22"
        ],
        "architecture": "x86_64"
    },
    "event": {
        "agent_id_status": "verified",
        "ingested": "2023-10-04T18:53:49Z",
        "dataset": "logstash.node"
    }
}
This is the pipeline dataset, which drives the Pipeline dashboard pages.
Exported fields
| Field | Description | Type | Unit | Metric Type |
|---|---|---|---|---|
| @timestamp | Date/time when the event originated. This is the date/time extracted from the event, typically representing when the event was generated by the source. If the event source has no original timestamp, this value is typically populated by the first time the event was received by the pipeline. Required field for all events. | date | ||
| agent.id | Unique identifier of this agent (if one exists). Example: For Beats this would be beat.id. | keyword | ||
| cloud.account.id | The cloud account or organization id used to identify different entities in a multi-tenant environment. Examples: AWS account id, Google Cloud ORG Id, or other unique identifier. | keyword | ||
| cloud.availability_zone | Availability zone in which this host, resource, or service is located. | keyword | ||
| cloud.image.id | Image ID for the cloud instance. | keyword | ||
| cloud.instance.id | Instance ID of the host machine. | keyword | ||
| cloud.instance.name | Instance name of the host machine. | keyword | ||
| cloud.machine.type | Machine type of the host machine. | keyword | ||
| cloud.project.id | The cloud project identifier. Examples: Google Cloud Project id, Azure Project id. | keyword | ||
| cloud.provider | Name of the cloud provider. Example values are aws, azure, gcp, or digitalocean. | keyword | ||
| cloud.region | Region in which this host, resource, or service is located. | keyword | ||
| cluster_uuid | alias | |||
| container.id | Unique container id. | keyword | ||
| container.image.name | Name of the image the container was built on. | keyword | ||
| container.labels | Image labels. | object | ||
| container.name | Container name. | keyword | ||
| data_stream.dataset | The field can contain anything that makes sense to signify the source of the data. Examples include nginx.access, prometheus, endpoint etc. For data streams that otherwise fit, but that do not have dataset set we use the value "generic" for the dataset value. event.dataset should have the same value as data_stream.dataset. Beyond the Elasticsearch data stream naming criteria noted above, the dataset value has additional restrictions: * Must not contain - * No longer than 100 characters |
constant_keyword | ||
| data_stream.namespace | A user defined namespace. Namespaces are useful to allow grouping of data. Many users already organize their indices this way, and the data stream naming scheme now provides this best practice as a default. Many users will populate this field with default. If no value is used, it falls back to default. Beyond the Elasticsearch index naming criteria noted above, namespace value has the additional restrictions: * Must not contain - * No longer than 100 characters |
constant_keyword | ||
| data_stream.type | An overarching type for the data stream. Currently allowed values are "logs" and "metrics". We expect to also add "traces" and "synthetics" in the near future. | constant_keyword | ||
| ecs.version | ECS version this event conforms to. ecs.version is a required field and must exist in all events. When querying across multiple indices -- which may conform to slightly different ECS versions -- this field lets integrations adjust to the schema version of the events. |
keyword | ||
| error.message | Error message. | match_only_text | ||
| event.dataset | Name of the dataset. If an event source publishes more than one type of log or events (e.g. access log, error log), the dataset is used to specify which one the event comes from. It's recommended but not required to start the dataset name with the module name, followed by a dot, then the dataset name. | keyword | ||
| event.duration | Duration of the event in nanoseconds. If event.start and event.end are known this value should be the difference between the end and start time. | long | ||
| event.module | Name of the module this data is coming from. If your monitoring agent supports the concept of modules or plugins to process events of a given source (e.g. Apache logs), event.module should contain the name of this module. |
keyword | ||
| host.architecture | Operating system architecture. | keyword | ||
| host.containerized | If the host is a container. | boolean | ||
| host.domain | Name of the domain of which the host is a member. For example, on Windows this could be the host's Active Directory domain or NetBIOS domain name. For Linux this could be the domain of the host's LDAP provider. | keyword | ||
| host.hostname | Hostname of the host. It normally contains what the hostname command returns on the host machine. |
keyword | ||
| host.id | Unique host id. As hostname is not always unique, use values that are meaningful in your environment. Example: The current usage of beat.name. |
keyword | ||
| host.ip | Host ip addresses. | ip | ||
| host.mac | Host MAC addresses. The notation format from RFC 7042 is suggested: Each octet (that is, 8-bit byte) is represented by two [uppercase] hexadecimal digits giving the value of the octet as an unsigned integer. Successive octets are separated by a hyphen. | keyword | ||
| host.name | Name of the host. It can contain what hostname returns on Unix systems, the fully qualified domain name, or a name specified by the user. The sender decides which value to use. |
keyword | ||
| host.os.build | OS build information. | keyword | ||
| host.os.codename | OS codename, if any. | keyword | ||
| host.os.family | OS family (such as redhat, debian, freebsd, windows). | keyword | ||
| host.os.kernel | Operating system kernel version as a raw string. | keyword | ||
| host.os.name | Operating system name, without the version. | keyword | ||
| host.os.name.text | Multi-field of host.os.name. |
match_only_text | ||
| host.os.platform | Operating system platform (such centos, ubuntu, windows). | keyword | ||
| host.os.version | Operating system version as a raw string. | keyword | ||
| host.type | Type of host. For Cloud providers this can be the machine type like t2.medium. If vm, this could be the container, for example, or other information meaningful in your environment. |
keyword | ||
| input.type | keyword | |||
| logstash.host.address | alias | |||
| logstash.host.name | alias | |||
| logstash.pipeline.elasticsearch.cluster.id | Elasticsearch clusters this Logstash pipeline is attached to | keyword | ||
| logstash.pipeline.host.address | address hosting this instance of logstash | keyword | ||
| logstash.pipeline.host.name | Host name of the node running logstash | keyword | ||
| logstash.pipeline.info.batch_delay | Batch delay for the running pipeline | long | gauge | |
| logstash.pipeline.info.batch_size | Batch size for the running pipeline | long | gauge | |
| logstash.pipeline.info.ephemeral_id | Ephemeral Id for the running pipeline | keyword | ||
| logstash.pipeline.info.workers | Number of workers for the running pipeline | long | gauge | |
| logstash.pipeline.name | Logstash Pipeline id/name | keyword | ||
| logstash.pipeline.total.batch.byte_size.average.last_1_minute | Average size in bytes of batch by the pipeline (last 1 minute) | long | byte | gauge |
| logstash.pipeline.total.batch.byte_size.current | Size in bytes of batch by the pipeline | long | byte | gauge |
| logstash.pipeline.total.batch.byte_size.max.last_1_minute | Maximum batch size in bytes for the pipeline (last 1 minute) | long | byte | gauge |
| logstash.pipeline.total.batch.byte_size.p50.last_1_minute | 50th percentile of batch size in bytes for the pipeline (last 1 minute) | long | byte | gauge |
| logstash.pipeline.total.batch.byte_size.p90.last_1_minute | 90th percentile of batch size in bytes for the pipeline (last 1 minute) | long | byte | gauge |
| logstash.pipeline.total.batch.event_count.average.last_1_minute | Number of average events contained in batch by the pipeline (last 1 minute) | long | gauge | |
| logstash.pipeline.total.batch.event_count.current | Number of events contained in batch by the pipeline | long | gauge | |
| logstash.pipeline.total.batch.event_count.p50.last_1_minute | 50th percentile of events per batch for the pipeline (last 1 minute) | long | gauge | |
| logstash.pipeline.total.batch.event_count.p90.last_1_minute | 90th percentile of events per batch for the pipeline (last 1 minute) | long | gauge | |
| logstash.pipeline.total.events.filtered | Number of events filtered by the pipeline | long | counter | |
| logstash.pipeline.total.events.in | Number of events received by the pipeline | long | counter | |
| logstash.pipeline.total.events.out | Number of events emitted by the pipeline | long | counter | |
| logstash.pipeline.total.flow.filter_throughput.current | current value of the filter throughput flow metric | scaled_float | gauge | |
| logstash.pipeline.total.flow.filter_throughput.last_1_minute | current value of the filter throughput flow metric | scaled_float | gauge | |
| logstash.pipeline.total.flow.input_throughput.current | current value of the input throughput flow metric | scaled_float | gauge | |
| logstash.pipeline.total.flow.input_throughput.last_1_minute | current value of the throughput flow metric | scaled_float | gauge | |
| logstash.pipeline.total.flow.output_throughput.current | current value of the output throughput flow metric | scaled_float | gauge | |
| logstash.pipeline.total.flow.output_throughput.last_1_minute | current value of the output throughput flow metric | scaled_float | gauge | |
| logstash.pipeline.total.flow.queue_backpressure.current | current value of the queue backpressure flow metric | scaled_float | gauge | |
| logstash.pipeline.total.flow.queue_backpressure.last_1_minute | current value of the queue backpressure flow metric | scaled_float | gauge | |
| logstash.pipeline.total.flow.queue_persisted_growth_bytes.current | current value of the queue persisted growth bytes flow metric | scaled_float | gauge | |
| logstash.pipeline.total.flow.queue_persisted_growth_bytes.last_1_minute | current value of the queue persisted growth bytes flow metric | scaled_float | gauge | |
| logstash.pipeline.total.flow.queue_persisted_growth_events.current | current value of the queue persisted growth events flow metric | scaled_float | gauge | |
| logstash.pipeline.total.flow.queue_persisted_growth_events.last_1_minute | current value of the queue persisted growth events flow metric | scaled_float | gauge | |
| logstash.pipeline.total.flow.worker_concurrency.current | last 1 minute value of the worker utilization flow metric | scaled_float | gauge | |
| logstash.pipeline.total.flow.worker_concurrency.last_1_minute | current value of the worker concurrency flow metric | scaled_float | gauge | |
| logstash.pipeline.total.flow.worker_utilization.current | last 1 minute value of the worker concurrency flow metric | scaled_float | gauge | |
| logstash.pipeline.total.flow.worker_utilization.last_1_minute | current value of the worker concurrency flow metric | scaled_float | gauge | |
| logstash.pipeline.total.queues.current_size.bytes | Current size of the PQ | long | byte | gauge |
| logstash.pipeline.total.queues.events | Number of events in the PQ for this pipeline | long | gauge | |
| logstash.pipeline.total.queues.max_size.bytes | Maximum possible size of the PQ | long | gauge | |
| logstash.pipeline.total.queues.type | Type of queue - persistent or memory | keyword | ||
| logstash.pipeline.total.reloads.failures | Number of failed reloads for this pipeline | long | counter | |
| logstash.pipeline.total.reloads.successes | Number of successful reloads for this pipeline | long | counter | |
| logstash.pipeline.total.time.duration.ms | Time spent processing events through the pipeline. | long | ms | counter |
| logstash.pipeline.total.time.queue_push_duration.ms | Time spent pushing events to the queue for this pipeline. | long | ms | counter |
| process.pid | Process id. | long | ||
| service.address | Address where data about this service was collected from. This should be a URI, network address (ipv4:port or [ipv6]:port) or a resource path (sockets). | keyword | ||
| service.hostname | Hostname of the service | keyword | ||
| service.id | Unique identifier of the running service. If the service is comprised of many nodes, the service.id should be the same for all nodes. This id should uniquely identify the service. This makes it possible to correlate logs and metrics for one specific service, no matter which particular node emitted the event. Note that if you need to see the events from one specific host of the service, you should filter on that host.name or host.id instead. |
keyword | ||
| service.name | Name of the service data is collected from. The name of the service is normally user given. This allows for distributed services that run on multiple hosts to correlate the related instances based on the name. In the case of Elasticsearch the service.name could contain the cluster name. For Beats the service.name is by default a copy of the service.type field if no name is specified. |
keyword | ||
| service.type | The type of the service data is collected from. The type can be used to group and correlate logs and metrics from one service type. Example: If logs or metrics are collected from Elasticsearch, service.type would be elasticsearch. |
keyword | ||
| service.version | Version of the service the data was collected from. This allows to look at a data set only for a specific version of a service. | keyword |
Example
{
    "@timestamp": "2023-10-04T18:53:18.708Z",
    "data_stream": {
        "dataset": "logstash.pipeline",
        "namespace": "default",
        "type": "metrics"
    },
    "ecs": {
        "version": "8.0.0"
    },
    "event": {
        "agent_id_status": "verified",
        "dataset": "logstash.pipeline",
        "ingested": "2023-10-04T18:53:19Z"
    },
    "host": {
        "architecture": "x86_64",
        "hostname": "macbook-pro.local",
        "id": "AA4215F6-994F-5CCE-B6F2-B6AED75AE125",
        "ip": [
            "192.168.1.184"
        ],
        "mac": [
            "AC-DE-48-00-11-22"
        ],
        "name": "macbook-pro.local",
        "os": {
            "build": "22F82",
            "family": "darwin",
            "kernel": "22.5.0",
            "name": "macOS",
            "platform": "darwin",
            "version": "13.4.1"
        }
    },
    "input": {
        "type": "cel"
    },
    "logstash": {
        "pipeline": {
            "host": {
                "address": "0.0.0.0:9600",
                "name": "21d61ee7529e"
            },
            "name": "standalone-pipeline",
            "total": {
                "events": {
                    "filtered": 2038,
                    "in": 2038,
                    "out": 2038
                },
                "flow": {
                    "filter_throughput": {
                        "current": 5.02,
                        "last_1_minute": 5.003
                    },
                    "input_throughput": {
                        "current": 4.948,
                        "last_1_minute": 5.003
                    },
                    "output_throughput": {
                        "current": 5.02,
                        "last_1_minute": 5.003
                    },
                    "queue_backpressure": {
                        "current": 0,
                        "last_1_minute": 0
                    },
                    "worker_concurrency": {
                        "current": 0.001,
                        "last_1_minute": 0.001
                    }
                },
                "queues": {
                    "current_size": {
                        "bytes": 0
                    },
                    "events": 0,
                    "max_size": {
                        "bytes": 0
                    },
                    "type": "memory"
                },
                "reloads": {
                    "failures": 0,
                    "successes": 0
                },
                "time": {
                    "duration": {
                        "ms": 1363
                    },
                    "queue_push_duration": {
                        "ms": 12
                    }
                }
            }
        }
    }
}
This is the plugin dataset, which drives the Pipeline detail dashboard pages. Note that this dataset may produce many documents for logstash instances using a large number of pipelines and/or plugins within those pipelines. For those instances, we recommend reviewing the
pipeline collection period, and setting it to an appropriate value.
Exported fields
| Field | Description | Type | Unit | Metric Type |
|---|---|---|---|---|
| @timestamp | Date/time when the event originated. This is the date/time extracted from the event, typically representing when the event was generated by the source. If the event source has no original timestamp, this value is typically populated by the first time the event was received by the pipeline. Required field for all events. | date | ||
| agent.id | Unique identifier of this agent (if one exists). Example: For Beats this would be beat.id. | keyword | ||
| cloud.account.id | The cloud account or organization id used to identify different entities in a multi-tenant environment. Examples: AWS account id, Google Cloud ORG Id, or other unique identifier. | keyword | ||
| cloud.availability_zone | Availability zone in which this host, resource, or service is located. | keyword | ||
| cloud.image.id | Image ID for the cloud instance. | keyword | ||
| cloud.instance.id | Instance ID of the host machine. | keyword | ||
| cloud.instance.name | Instance name of the host machine. | keyword | ||
| cloud.machine.type | Machine type of the host machine. | keyword | ||
| cloud.project.id | The cloud project identifier. Examples: Google Cloud Project id, Azure Project id. | keyword | ||
| cloud.provider | Name of the cloud provider. Example values are aws, azure, gcp, or digitalocean. | keyword | ||
| cloud.region | Region in which this host, resource, or service is located. | keyword | ||
| cluster_uuid | alias | |||
| container.id | Unique container id. | keyword | ||
| container.image.name | Name of the image the container was built on. | keyword | ||
| container.labels | Image labels. | object | ||
| container.name | Container name. | keyword | ||
| data_stream.dataset | The field can contain anything that makes sense to signify the source of the data. Examples include nginx.access, prometheus, endpoint etc. For data streams that otherwise fit, but that do not have dataset set we use the value "generic" for the dataset value. event.dataset should have the same value as data_stream.dataset. Beyond the Elasticsearch data stream naming criteria noted above, the dataset value has additional restrictions: * Must not contain - * No longer than 100 characters |
constant_keyword | ||
| data_stream.namespace | A user defined namespace. Namespaces are useful to allow grouping of data. Many users already organize their indices this way, and the data stream naming scheme now provides this best practice as a default. Many users will populate this field with default. If no value is used, it falls back to default. Beyond the Elasticsearch index naming criteria noted above, namespace value has the additional restrictions: * Must not contain - * No longer than 100 characters |
constant_keyword | ||
| data_stream.type | An overarching type for the data stream. Currently allowed values are "logs" and "metrics". We expect to also add "traces" and "synthetics" in the near future. | constant_keyword | ||
| ecs.version | ECS version this event conforms to. ecs.version is a required field and must exist in all events. When querying across multiple indices -- which may conform to slightly different ECS versions -- this field lets integrations adjust to the schema version of the events. |
keyword | ||
| error.message | Error message. | match_only_text | ||
| event.dataset | Name of the dataset. If an event source publishes more than one type of log or events (e.g. access log, error log), the dataset is used to specify which one the event comes from. It's recommended but not required to start the dataset name with the module name, followed by a dot, then the dataset name. | keyword | ||
| event.duration | Duration of the event in nanoseconds. If event.start and event.end are known this value should be the difference between the end and start time. | long | ||
| event.module | Name of the module this data is coming from. If your monitoring agent supports the concept of modules or plugins to process events of a given source (e.g. Apache logs), event.module should contain the name of this module. |
keyword | ||
| host.architecture | Operating system architecture. | keyword | ||
| host.containerized | If the host is a container. | boolean | ||
| host.domain | Name of the domain of which the host is a member. For example, on Windows this could be the host's Active Directory domain or NetBIOS domain name. For Linux this could be the domain of the host's LDAP provider. | keyword | ||
| host.hostname | Hostname of the host. It normally contains what the hostname command returns on the host machine. |
keyword | ||
| host.id | Unique host id. As hostname is not always unique, use values that are meaningful in your environment. Example: The current usage of beat.name. |
keyword | ||
| host.ip | Host ip addresses. | ip | ||
| host.mac | Host MAC addresses. The notation format from RFC 7042 is suggested: Each octet (that is, 8-bit byte) is represented by two [uppercase] hexadecimal digits giving the value of the octet as an unsigned integer. Successive octets are separated by a hyphen. | keyword | ||
| host.name | Name of the host. It can contain what hostname returns on Unix systems, the fully qualified domain name, or a name specified by the user. The sender decides which value to use. |
keyword | ||
| host.os.build | OS build information. | keyword | ||
| host.os.codename | OS codename, if any. | keyword | ||
| host.os.family | OS family (such as redhat, debian, freebsd, windows). | keyword | ||
| host.os.kernel | Operating system kernel version as a raw string. | keyword | ||
| host.os.name | Operating system name, without the version. | keyword | ||
| host.os.name.text | Multi-field of host.os.name. |
match_only_text | ||
| host.os.platform | Operating system platform (such centos, ubuntu, windows). | keyword | ||
| host.os.version | Operating system version as a raw string. | keyword | ||
| host.type | Type of host. For Cloud providers this can be the machine type like t2.medium. If vm, this could be the container, for example, or other information meaningful in your environment. |
keyword | ||
| input.type | keyword | |||
| logstash.host.address | alias | |||
| logstash.host.name | alias | |||
| logstash.pipeline.elasticsearch.cluster.id | Elasticsearch clusters this Logstash pipeline is attached to | keyword | ||
| logstash.pipeline.host.address | address hosting this instance of logstash | keyword | ||
| logstash.pipeline.host.name | Host name of the node running logstash | keyword | ||
| logstash.pipeline.id | Logstash Pipeline hash | keyword | ||
| logstash.pipeline.name | Logstash Pipeline id/name | keyword | ||
| logstash.pipeline.plugin.codec.decode.duration.ms | amount of time spend decoding events | long | ms | counter |
| logstash.pipeline.plugin.codec.decode.in | number of events entering the decoder | long | counter | |
| logstash.pipeline.plugin.codec.decode.out | number of events exiting the decoder | long | counter | |
| logstash.pipeline.plugin.codec.encode.duration.ms | amount of time spend encoding events | long | ms | counter |
| logstash.pipeline.plugin.codec.encode.in | number of events encoded | long | counter | |
| logstash.pipeline.plugin.codec.id | Id of codec plugin | keyword | ||
| logstash.pipeline.plugin.codec.name | Name of codec plugin | keyword | ||
| logstash.pipeline.plugin.filter.elasticsearch.cluster.id | Elasticsearch clusters this Logstash plugin is attached to | keyword | ||
| logstash.pipeline.plugin.filter.events.in | number of events received by the filter | long | counter | |
| logstash.pipeline.plugin.filter.events.out | number of events emitted by the filter | long | counter | |
| logstash.pipeline.plugin.filter.flow.worker_millis_per_event.current | amount of time spent per event for this plugin | scaled_float | gauge | |
| logstash.pipeline.plugin.filter.flow.worker_millis_per_event.last_1_minute | amount of time spent per event for this plugin | scaled_float | gauge | |
| logstash.pipeline.plugin.filter.flow.worker_utilization.current | worker utilization for this plugin | scaled_float | gauge | |
| logstash.pipeline.plugin.filter.flow.worker_utilization.last_1_minute | worker utilization for this plugin | scaled_float | gauge | |
| logstash.pipeline.plugin.filter.id | Id of filter plugin | keyword | ||
| logstash.pipeline.plugin.filter.metrics.dissect.failures | number of dissect failures | long | counter | |
| logstash.pipeline.plugin.filter.metrics.dissect.matches | number of dissect matches | long | counter | |
| logstash.pipeline.plugin.filter.metrics.grok.failures | number of grok failures | long | counter | |
| logstash.pipeline.plugin.filter.metrics.grok.matches | number of grok matches | long | counter | |
| logstash.pipeline.plugin.filter.name | Name of filter plugin | keyword | ||
| logstash.pipeline.plugin.filter.source.column | keyword | |||
| logstash.pipeline.plugin.filter.source.id | keyword | |||
| logstash.pipeline.plugin.filter.source.line | long | |||
| logstash.pipeline.plugin.filter.source.protocol | keyword | |||
| logstash.pipeline.plugin.filter.time.duration.ms | amount of time working on events in this plugin | long | ms | counter |
| logstash.pipeline.plugin.input.elasticsearch.cluster.id | Elasticsearch clusters this Logstash plugin is attached to | keyword | ||
| logstash.pipeline.plugin.input.events.out | number of events emitted by the input | long | counter | |
| logstash.pipeline.plugin.input.flow.throughput.current | throughput of this input plugin | scaled_float | gauge | |
| logstash.pipeline.plugin.input.flow.throughput.last_1_minute | throughput of this input plugin | scaled_float | gauge | |
| logstash.pipeline.plugin.input.id | Id of input plugin | keyword | ||
| logstash.pipeline.plugin.input.metrics.beats.current_connections | Current connections count | long | gauge | |
| logstash.pipeline.plugin.input.metrics.beats.peak_connections | Number of peak connections | long | gauge | |
| logstash.pipeline.plugin.input.name | Name of input plugin | keyword | ||
| logstash.pipeline.plugin.input.source.column | keyword | |||
| logstash.pipeline.plugin.input.source.id | keyword | |||
| logstash.pipeline.plugin.input.source.line | long | |||
| logstash.pipeline.plugin.input.source.protocol | keyword | |||
| logstash.pipeline.plugin.input.time.queue_push_duration.ms | amount of time spend pushing events to the queue | long | ms | counter |
| logstash.pipeline.plugin.output.elasticsearch.cluster.id | Elasticsearch clusters this Logstash plugin is attached to | keyword | ||
| logstash.pipeline.plugin.output.events.in | number of events received by the output | long | counter | |
| logstash.pipeline.plugin.output.events.out | number of events emitted by the output | long | counter | |
| logstash.pipeline.plugin.output.flow.worker_millis_per_event.current | amount of time spent per event for this plugin | scaled_float | gauge | |
| logstash.pipeline.plugin.output.flow.worker_millis_per_event.last_1_minute | amount of time spent per event for this plugin | scaled_float | gauge | |
| logstash.pipeline.plugin.output.flow.worker_utilization.current | worker utilization for this plugin | scaled_float | gauge | |
| logstash.pipeline.plugin.output.flow.worker_utilization.last_1_minute | worker utilization for this plugin | scaled_float | gauge | |
| logstash.pipeline.plugin.output.id | Id of output plugin | keyword | ||
| logstash.pipeline.plugin.output.metrics.elasticsearch.bulk_requests.responses.200 | long | counter | ||
| logstash.pipeline.plugin.output.metrics.elasticsearch.bulk_requests.responses.201 | long | counter | ||
| logstash.pipeline.plugin.output.metrics.elasticsearch.bulk_requests.responses.400 | long | counter | ||
| logstash.pipeline.plugin.output.metrics.elasticsearch.bulk_requests.responses.401 | long | counter | ||
| logstash.pipeline.plugin.output.metrics.elasticsearch.bulk_requests.responses.403 | long | counter | ||
| logstash.pipeline.plugin.output.metrics.elasticsearch.bulk_requests.responses.404 | long | counter | ||
| logstash.pipeline.plugin.output.metrics.elasticsearch.bulk_requests.responses.409 | long | counter | ||
| logstash.pipeline.plugin.output.metrics.elasticsearch.bulk_requests.responses.413 | long | counter | ||
| logstash.pipeline.plugin.output.metrics.elasticsearch.bulk_requests.responses.429 | long | counter | ||
| logstash.pipeline.plugin.output.metrics.elasticsearch.bulk_requests.responses.500 | long | counter | ||
| logstash.pipeline.plugin.output.metrics.elasticsearch.bulk_requests.successes | long | counter | ||
| logstash.pipeline.plugin.output.metrics.elasticsearch.documents.non_retryable_failures | long | counter | ||
| logstash.pipeline.plugin.output.metrics.elasticsearch.documents.successes | long | counter | ||
| logstash.pipeline.plugin.output.name | Name of output plugin | keyword | ||
| logstash.pipeline.plugin.output.source.column | keyword | |||
| logstash.pipeline.plugin.output.source.id | keyword | |||
| logstash.pipeline.plugin.output.source.line | long | |||
| logstash.pipeline.plugin.output.source.protocol | keyword | |||
| logstash.pipeline.plugin.output.time.duration.ms | amount of time working on events in this plugin | long | ms | counter |
| logstash.pipeline.plugin.type | Type of the plugin | keyword | ||
| process.pid | Process id. | long | ||
| service.address | Address where data about this service was collected from. This should be a URI, network address (ipv4:port or [ipv6]:port) or a resource path (sockets). | keyword | ||
| service.hostname | Hostname of the service | keyword | ||
| service.id | Unique identifier of the running service. If the service is comprised of many nodes, the service.id should be the same for all nodes. This id should uniquely identify the service. This makes it possible to correlate logs and metrics for one specific service, no matter which particular node emitted the event. Note that if you need to see the events from one specific host of the service, you should filter on that host.name or host.id instead. |
keyword | ||
| service.name | Name of the service data is collected from. The name of the service is normally user given. This allows for distributed services that run on multiple hosts to correlate the related instances based on the name. In the case of Elasticsearch the service.name could contain the cluster name. For Beats the service.name is by default a copy of the service.type field if no name is specified. |
keyword | ||
| service.type | The type of the service data is collected from. The type can be used to group and correlate logs and metrics from one service type. Example: If logs or metrics are collected from Elasticsearch, service.type would be elasticsearch. |
keyword | ||
| service.version | Version of the service the data was collected from. This allows to look at a data set only for a specific version of a service. | keyword |
Example
{
    "@timestamp": "2023-10-24T17:56:40.316Z",
    "data_stream": {
        "dataset": "logstash.plugins",
        "namespace": "default",
        "type": "metrics"
    },
    "ecs": {
        "version": "8.0.0"
    },
    "event": {
        "agent_id_status": "verified",
        "dataset": "logstash.plugins",
        "ingested": "2023-10-24T17:56:41Z"
    },
    "host": {
        "architecture": "x86_64",
        "hostname": "macbook-pro.local",
        "id": "AA4215F6-994F-5CCE-B6F2-B6AED75AE125",
        "ip": [
            "192.168.4.26"
        ],
        "mac": [
            "AC-DE-48-00-11-22"
        ],
        "name": "macbook-pro.local",
        "os": {
            "build": "22G120",
            "family": "darwin",
            "kernel": "22.6.0",
            "name": "macOS",
            "platform": "darwin",
            "version": "13.6"
        }
    },
    "input": {
        "type": "cel"
    },
    "logstash": {
        "pipeline": {
            "elasticsearch": {
                "cluster": {
                    "id": "9MOGoKiESvaklNVmxLo3iA"
                }
            },
            "host": {
                "address": "127.0.0.1:9602",
                "name": "logstash9602"
            },
            "id": "b18ff60bcd82055aab2bf5601a2bc170502f80b33ab5938f25fa95ec8b04cd4b",
            "name": "work",
            "plugin": {
                "output": {
                    "elasticsearch": {
                        "cluster": {
                            "id": "9MOGoKiESvaklNVmxLo3iA"
                        }
                    },
                    "events": {
                        "in": 798,
                        "out": 798
                    },
                    "flow": {
                        "worker_millis_per_event": {
                            "current": 54,
                            "last_1_minute": 54
                        },
                        "worker_utilization": {
                            "current": 0.023,
                            "last_1_minute": 0.01
                        }
                    },
                    "id": "out_to_elasticsearch",
                    "metrics": {
                        "elasticsearch": {
                            "bulk_requests": {
                                "responses": {
                                    "200": 798
                                },
                                "successes": 798
                            },
                            "documents": {
                                "successes": 798
                            }
                        }
                    },
                    "name": "elasticsearch",
                    "source": {
                        "column": "3",
                        "id": "/Users/test/ingestdemo/logstash-8.8.2/remap.conf",
                        "line": 132,
                        "protocol": "file"
                    },
                    "time": {
                        "duration": {
                            "ms": 198060
                        }
                    }
                },
                "type": "output"
            }
        }
    }
}
Logstash package supports the plain text format and the JSON format. Also, two types of logs can be activated with the Logstash package:
logcollects and parses the logs that Logstash writes to disk.slowlogparses the logstash slowlog (make sure to configure the Logstash slowlog option).
When using the log data stream to parse plaintext logs, if a multiline plaintext log contains an embedded JSON object such that
the JSON object starts on a new line, the fileset may not parse the multiline plaintext log event correctly.
Logstash metric related data streams works with Logstash 7.3.0 and later.
Example
{
"@timestamp": "2023-03-02T15:57:56.968Z",
"agent": {
"ephemeral_id": "16f2dd63-454b-4699-a8c8-2a748bd044b8",
"id": "3cc85092-54dc-4b58-8726-5e9458167f42",
"name": "docker-fleet-agent",
"type": "metricbeat",
"version": "8.5.0"
},
"data_stream": {
"dataset": "logstash.stack_monitoring.node_stats",
"namespace": "ep",
"type": "metrics"
},
"ecs": {
"version": "8.0.0"
},
"elastic_agent": {
"id": "3cc85092-54dc-4b58-8726-5e9458167f42",
"snapshot": false,
"version": "8.5.0"
},
"event": {
"agent_id_status": "verified",
"dataset": "logstash.stack_monitoring.node_stats",
"duration": 48419400,
"ingested": "2023-03-02T15:57:58Z",
"module": "logstash"
},
"host": {
"architecture": "x86_64",
"containerized": true,
"hostname": "docker-fleet-agent",
"id": "66392b0697b84641af8006d87aeb89f1",
"ip": [
"192.168.224.7"
],
"mac": [
"02-42-C0-A8-E0-07"
],
"name": "docker-fleet-agent",
"os": {
"codename": "focal",
"family": "debian",
"kernel": "5.10.47-linuxkit",
"name": "Ubuntu",
"platform": "ubuntu",
"type": "linux",
"version": "20.04.5 LTS (Focal Fossa)"
}
},
"logstash": {
"cluster": {
"id": "0toa26-cTzmqx0WD40-4XQ"
},
"elasticsearch": {
"cluster": {
"id": "0toa26-cTzmqx0WD40-4XQ"
}
},
"node": {
"stats": {
"events": {
"duration_in_millis": 334,
"filtered": 138,
"in": 618,
"out": 138
},
"jvm": {
"gc": {
"collectors": {
"old": {
"collection_count": 0,
"collection_time_in_millis": 0
},
"young": {
"collection_count": 13,
"collection_time_in_millis": 177
}
}
},
"mem": {
"heap_max_in_bytes": 10527703038,
"heap_used_in_bytes": 234688352,
"heap_used_percent": 2
},
"uptime_in_millis": 21450
},
"logstash": {
"ephemeral_id": "17681d23-bd67-4c40-b6b1-63e97b560856",
"host": "170bc3698b89",
"http_address": "0.0.0.0:9600",
"name": "170bc3698b89",
"pipeline": {
"batch_size": 125,
"workers": 10
},
"snapshot": false,
"status": "green",
"uuid": "a4224a67-aae8-4bce-8660-079d068b2e72",
"version": "8.5.0"
},
"os": {
"cgroup": {
"cpu": {
"cfs_quota_micros": -1,
"control_group": "/",
"stat": {
"number_of_elapsed_periods": 0,
"number_of_times_throttled": 0,
"time_throttled_nanos": 0
}
},
"cpuacct": {
"control_group": "/",
"usage_nanos": 55911664431
}
},
"cpu": {
"load_average": {
"15m": 2.28,
"1m": 2.85,
"5m": 2.62
},
"percent": 0
}
},
"pipelines": [
{
"ephemeral_id": "453a2361-82d8-4d88-b7a4-063c3293cd4a",
"events": {
"duration_in_millis": 0,
"filtered": 0,
"in": 476,
"out": 0,
"queue_push_duration_in_millis": 59
},
"hash": "d83c53e142e85177df0f039e5b9f4575b858e9cfdd51c2c60b1a9e8d5f9b1aaa",
"id": "pipeline-with-persisted-queue",
"queue": {
"capacity": {
"max_queue_size_in_bytes": 1073741824,
"max_unread_events": 0,
"page_capacity_in_bytes": 67108864,
"queue_size_in_bytes": 132880
},
"data": {
"free_space_in_bytes": 51709984768,
"path": "/usr/share/logstash/data/queue/pipeline-with-persisted-queue",
"storage_type": "overlay"
},
"events": 0,
"events_count": 0,
"max_queue_size_in_bytes": 1073741824,
"queue_size_in_bytes": 132880,
"type": "persisted"
},
"reloads": {
"failures": 0,
"successes": 0
},
"vertices": [
{
"events_out": 475,
"id": "dfc132c40b9f5dbc970604f191cf87ee04b102b6f4be5a235436973dc7ea6368",
"pipeline_ephemeral_id": "453a2361-82d8-4d88-b7a4-063c3293cd4a",
"queue_push_duration_in_millis": 59
},
{
"duration_in_millis": 0,
"events_in": 375,
"events_out": 0,
"id": "e24d45cc4f3bb9981356480856120ed5f68127abbc3af7f47e7bca32460e5019",
"pipeline_ephemeral_id": "453a2361-82d8-4d88-b7a4-063c3293cd4a"
},
{
"cluster_uuid": "0toa26-cTzmqx0WD40-4XQ",
"duration_in_millis": 1,
"events_in": 0,
"events_out": 0,
"id": "9ba6577aa5c41a5ebcaae010b9a0ef44015ae68c624596ed924417d1701abc21",
"pipeline_ephemeral_id": "453a2361-82d8-4d88-b7a4-063c3293cd4a"
}
]
},
{
"ephemeral_id": "7114cd7d-8d91-4afc-a986-32487c3edcbe",
"events": {
"duration_in_millis": 191,
"filtered": 91,
"in": 95,
"out": 91,
"queue_push_duration_in_millis": 4
},
"hash": "0542fa70daa36dc3e858ea099f125cc8c9e451ebbfe8ea8867e52f9764da0a35",
"id": "pipeline-with-memory-queue",
"queue": {
"events_count": 0,
"max_queue_size_in_bytes": 0,
"queue_size_in_bytes": 0,
"type": "memory"
},
"reloads": {
"failures": 0,
"successes": 0
},
"vertices": [
{
"events_out": 95,
"id": "4c5941552cdaa72ebc285557c697a7150c359ee3eacf9b5664c4b1048e26153b",
"pipeline_ephemeral_id": "7114cd7d-8d91-4afc-a986-32487c3edcbe",
"queue_push_duration_in_millis": 4
},
{
"cluster_uuid": "0toa26-cTzmqx0WD40-4XQ",
"duration_in_millis": 193,
"events_in": 91,
"events_out": 91,
"id": "635a080aacc8700059852859da284a9cb92cb78a6d7112fbf55e441e51b6658a",
"long_counters": [
{
"name": "bulk_requests.successes",
"value": 12
},
{
"name": "bulk_requests.responses.200",
"value": 12
},
{
"name": "documents.successes",
"value": 91
}
],
"pipeline_ephemeral_id": "7114cd7d-8d91-4afc-a986-32487c3edcbe"
}
]
}
],
"process": {
"cpu": {
"percent": 4
},
"max_file_descriptors": 1048576,
"open_file_descriptors": 89
},
"queue": {
"events_count": 0
},
"reloads": {
"failures": 0,
"successes": 0
},
"timestamp": "2023-03-02T15:57:57.016Z"
}
}
},
"metricset": {
"name": "node_stats",
"period": 10000
},
"service": {
"address": "http://elastic-package-service_logstash_1:9600/_node/stats",
"hostname": "170bc3698b89",
"id": "",
"name": "logstash",
"type": "logstash",
"version": "8.5.0"
}
}
Exported fields
| Field | Description | Type |
|---|---|---|
| @timestamp | Date/time when the event originated. This is the date/time extracted from the event, typically representing when the event was generated by the source. If the event source has no original timestamp, this value is typically populated by the first time the event was received by the pipeline. Required field for all events. | date |
| data_stream.dataset | Data stream dataset. | constant_keyword |
| data_stream.namespace | Data stream namespace. | constant_keyword |
| data_stream.type | Data stream type. | constant_keyword |
| host.hostname | Hostname of the host. It normally contains what the hostname command returns on the host machine. |
keyword |
| logstash.node.jvm.version | Version | keyword |
| logstash.node.state.pipeline.hash | keyword | |
| logstash.node.state.pipeline.id | keyword | |
| logstash.node.stats.events.duration_in_millis | long | |
| logstash.node.stats.events.filtered | Filtered events counter. | long |
| logstash.node.stats.events.in | Incoming events counter. | long |
| logstash.node.stats.events.out | Outgoing events counter. | long |
| logstash.node.stats.jvm.mem.heap_max_in_bytes | long | |
| logstash.node.stats.jvm.mem.heap_used_in_bytes | long | |
| logstash.node.stats.jvm.uptime_in_millis | long | |
| logstash.node.stats.logstash.uuid | keyword | |
| logstash.node.stats.logstash.version | keyword | |
| logstash.node.stats.os.cgroup.cpu.stat.number_of_elapsed_periods | long | |
| logstash.node.stats.os.cgroup.cpu.stat.number_of_times_throttled | long | |
| logstash.node.stats.os.cgroup.cpu.stat.time_throttled_nanos | long | |
| logstash.node.stats.os.cgroup.cpuacct.usage_nanos | long | |
| logstash.node.stats.os.cpu.load_average.15m | long | |
| logstash.node.stats.os.cpu.load_average.1m | long | |
| logstash.node.stats.os.cpu.load_average.5m | long | |
| logstash.node.stats.pipelines.events.duration_in_millis | long | |
| logstash.node.stats.pipelines.events.out | long | |
| logstash.node.stats.pipelines.hash | keyword | |
| logstash.node.stats.pipelines.id | keyword | |
| logstash.node.stats.pipelines.queue.events_count | long | |
| logstash.node.stats.pipelines.queue.max_queue_size_in_bytes | long | |
| logstash.node.stats.pipelines.queue.queue_size_in_bytes | long | |
| logstash.node.stats.pipelines.queue.type | keyword | |
| logstash.node.stats.pipelines.vertices.duration_in_millis | long | |
| logstash.node.stats.pipelines.vertices.events_in | long | |
| logstash.node.stats.pipelines.vertices.events_out | events_out | long |
| logstash.node.stats.pipelines.vertices.id | id | keyword |
| logstash.node.stats.pipelines.vertices.pipeline_ephemeral_id | pipeline_ephemeral_id | keyword |
| logstash.node.stats.pipelines.vertices.queue_push_duration_in_millis | queue_push_duration_in_millis | float |
| logstash.node.stats.process.cpu.percent | double | |
| logstash.node.stats.queue.events_count | long | |
| logstash_stats.pipelines | nested | |
| process.pid | Process id. | long |
| service.version | Version of the service the data was collected from. This allows to look at a data set only for a specific version of a service. | keyword |
Example
{
    "@timestamp": "2023-03-02T15:57:03.999Z",
    "agent": {
        "ephemeral_id": "16f2dd63-454b-4699-a8c8-2a748bd044b8",
        "id": "3cc85092-54dc-4b58-8726-5e9458167f42",
        "name": "docker-fleet-agent",
        "type": "metricbeat",
        "version": "8.5.0"
    },
    "data_stream": {
        "dataset": "logstash.stack_monitoring.node",
        "namespace": "ep",
        "type": "metrics"
    },
    "ecs": {
        "version": "8.0.0"
    },
    "elastic_agent": {
        "id": "3cc85092-54dc-4b58-8726-5e9458167f42",
        "snapshot": false,
        "version": "8.5.0"
    },
    "event": {
        "agent_id_status": "verified",
        "dataset": "logstash.stack_monitoring.node",
        "duration": 69490100,
        "ingested": "2023-03-02T15:57:05Z",
        "module": "logstash"
    },
    "host": {
        "architecture": "x86_64",
        "containerized": true,
        "hostname": "docker-fleet-agent",
        "id": "66392b0697b84641af8006d87aeb89f1",
        "ip": [
            "192.168.224.7"
        ],
        "mac": [
            "02-42-C0-A8-E0-07"
        ],
        "name": "docker-fleet-agent",
        "os": {
            "codename": "focal",
            "family": "debian",
            "kernel": "5.10.47-linuxkit",
            "name": "Ubuntu",
            "platform": "ubuntu",
            "type": "linux",
            "version": "20.04.5 LTS (Focal Fossa)"
        }
    },
    "logstash": {
        "cluster": {
            "id": "0toa26-cTzmqx0WD40-4XQ"
        },
        "elasticsearch": {
            "cluster": {
                "id": "0toa26-cTzmqx0WD40-4XQ"
            }
        },
        "node": {
            "host": "45730b5f8c3d",
            "id": "2e17cd45-ecb8-4358-a420-b867f2e32b7a",
            "jvm": {
                "version": "17.0.4"
            },
            "state": {
                "pipeline": {
                    "batch_size": 125,
                    "ephemeral_id": "472cf082-aa15-41ca-9ed1-62d03afbadd0",
                    "hash": "d83c53e142e85177df0f039e5b9f4575b858e9cfdd51c2c60b1a9e8d5f9b1aaa",
                    "id": "pipeline-with-persisted-queue",
                    "representation": {
                        "graph": {
                            "edges": [
                                {
                                    "from": "dfc132c40b9f5dbc970604f191cf87ee04b102b6f4be5a235436973dc7ea6368",
                                    "id": "9ed824e4f189b461c111ae27c17644c3c5f6d7c3c2bb213cbc7cc067cbd68fe6",
                                    "to": "__QUEUE__",
                                    "type": "plain"
                                },
                                {
                                    "from": "__QUEUE__",
                                    "id": "cb33f8fb7611e31a2c1751b74cdedf5b8cdb96ea46b812a2541e2db4f13dca10",
                                    "to": "e24d45cc4f3bb9981356480856120ed5f68127abbc3af7f47e7bca32460e5019",
                                    "type": "plain"
                                },
                                {
                                    "from": "e24d45cc4f3bb9981356480856120ed5f68127abbc3af7f47e7bca32460e5019",
                                    "id": "63ef166c45b87a40f31e0a6def175f10460b6b0ed656e70968eb52b1c454ab16",
                                    "to": "9ba6577aa5c41a5ebcaae010b9a0ef44015ae68c624596ed924417d1701abc21",
                                    "type": "plain"
                                }
                            ],
                            "vertices": [
                                {
                                    "config_name": "java_generator",
                                    "explicit_id": false,
                                    "id": "dfc132c40b9f5dbc970604f191cf87ee04b102b6f4be5a235436973dc7ea6368",
                                    "meta": {
                                        "source": {
                                            "column": 3,
                                            "id": "/usr/share/logstash/pipeline/persisted-queue.conf",
                                            "line": 2,
                                            "protocol": "file"
                                        }
                                    },
                                    "plugin_type": "input",
                                    "type": "plugin"
                                },
                                {
                                    "explicit_id": false,
                                    "id": "__QUEUE__",
                                    "meta": null,
                                    "type": "queue"
                                },
                                {
                                    "config_name": "sleep",
                                    "explicit_id": false,
                                    "id": "e24d45cc4f3bb9981356480856120ed5f68127abbc3af7f47e7bca32460e5019",
                                    "meta": {
                                        "source": {
                                            "column": 3,
                                            "id": "/usr/share/logstash/pipeline/persisted-queue.conf",
                                            "line": 8,
                                            "protocol": "file"
                                        }
                                    },
                                    "plugin_type": "filter",
                                    "type": "plugin"
                                },
                                {
                                    "config_name": "elasticsearch",
                                    "explicit_id": false,
                                    "id": "9ba6577aa5c41a5ebcaae010b9a0ef44015ae68c624596ed924417d1701abc21",
                                    "meta": {
                                        "source": {
                                            "column": 3,
                                            "id": "/usr/share/logstash/pipeline/persisted-queue.conf",
                                            "line": 15,
                                            "protocol": "file"
                                        }
                                    },
                                    "plugin_type": "output",
                                    "type": "plugin"
                                }
                            ]
                        },
                        "hash": "d83c53e142e85177df0f039e5b9f4575b858e9cfdd51c2c60b1a9e8d5f9b1aaa",
                        "type": "lir",
                        "version": "0.0.0"
                    },
                    "workers": 10
                }
            },
            "version": "8.5.0"
        }
    },
    "metricset": {
        "name": "node",
        "period": 10000
    },
    "process": {
        "pid": 1
    },
    "service": {
        "address": "http://elastic-package-service_logstash_1:9600/_node",
        "hostname": "45730b5f8c3d",
        "id": "2e17cd45-ecb8-4358-a420-b867f2e32b7a",
        "name": "logstash",
        "type": "logstash",
        "version": "8.5.0"
    }
}
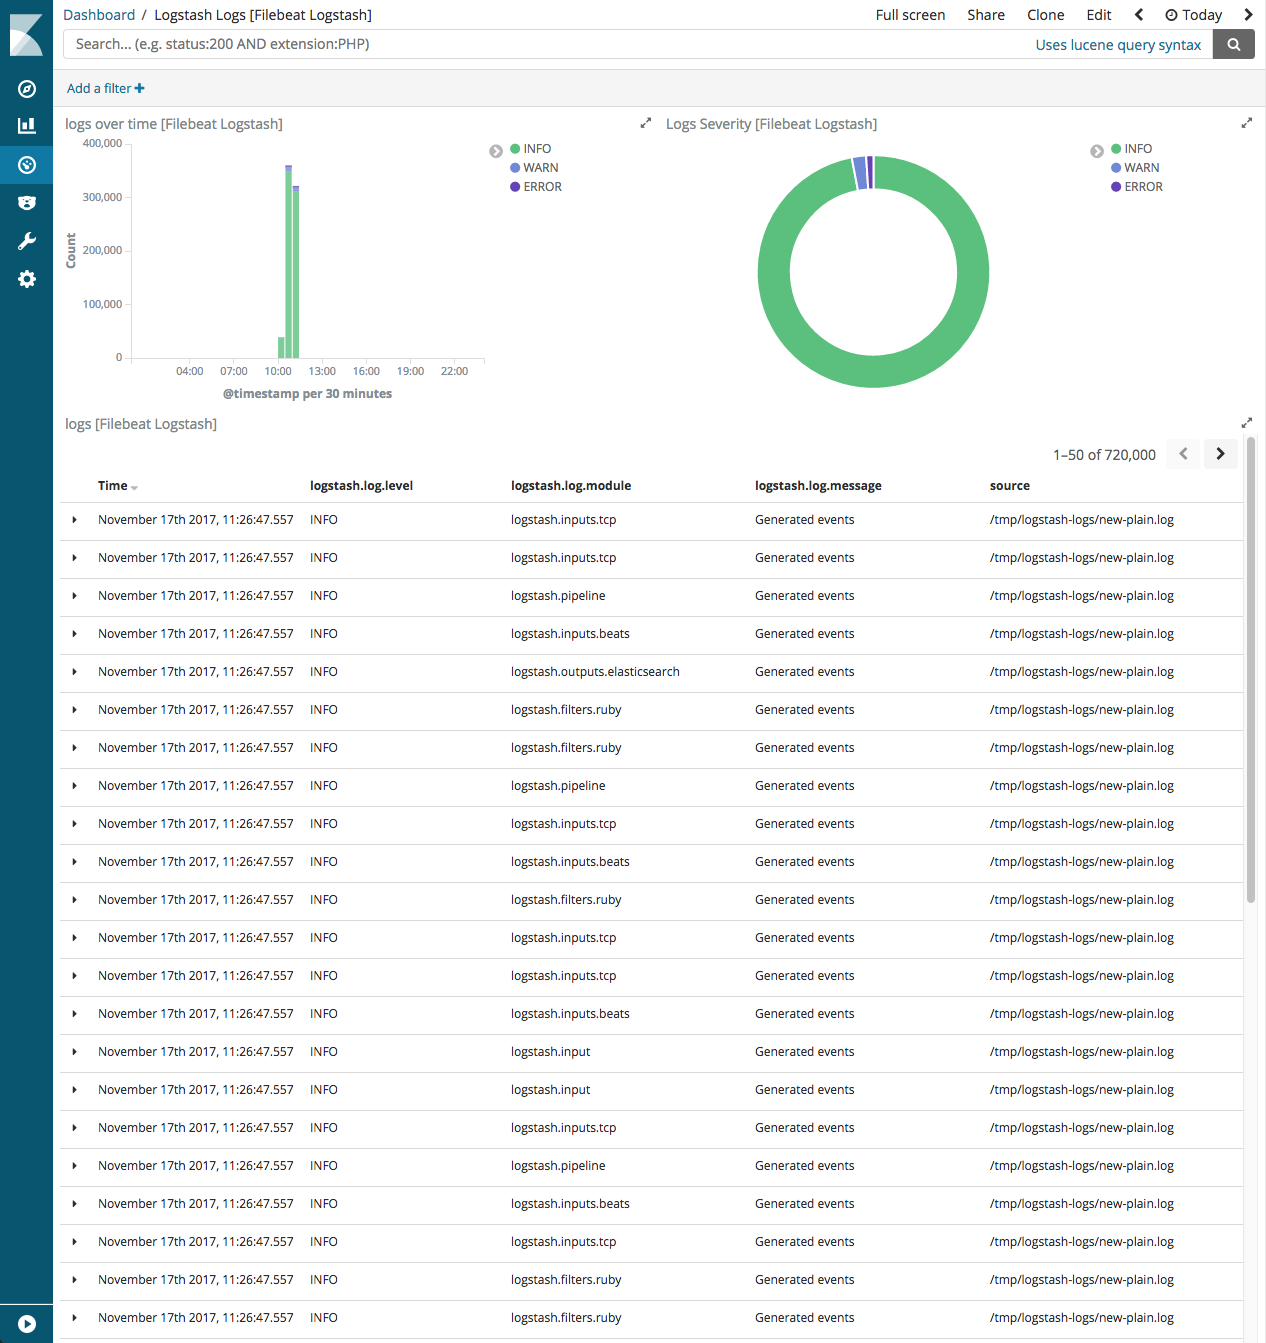
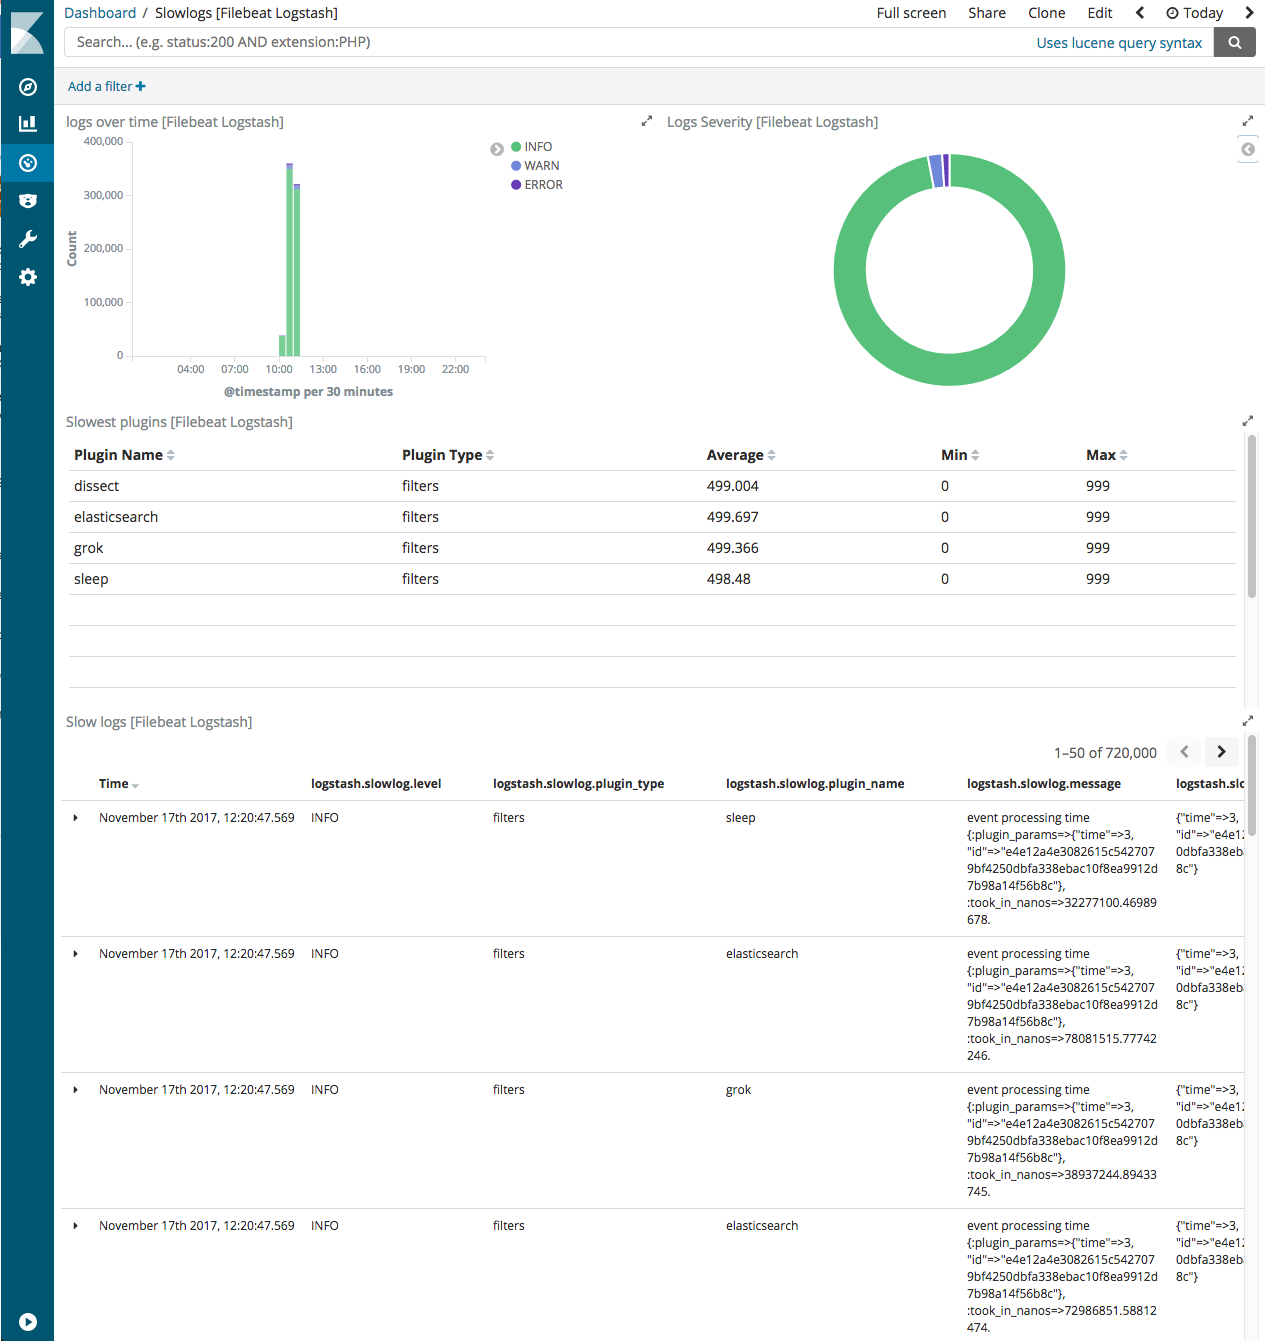
This integration includes one or more Kibana dashboards that visualizes the data collected by the integration. The screenshots below illustrate how the ingested data is displayed.
Changelog
| Version | Details | Minimum Kibana version |
|---|---|---|
| 2.11.3 | Bug fix (View pull request) Fix "No embeddable factory found for type DASHBOARD_MARKDOWN" error in the "[Metrics Logstash] Logstash Single Pipeline View" dashboard on stack version 8.19 by replacing the unsupported DASHBOARD_MARKDOWN panel type with a visualization markdown panel. |
9.0.0 8.17.0 |
| 2.11.2 | Bug fix (View pull request) Broken links panel |
9.0.0 8.17.0 |
| 2.11.1 | Bug fix (View pull request) Fix status colour mappings in Node Health and Pipeline Health dashboards so that red/yellow/green/unknown statuses render with correct colours using the Borealis palette. |
9.0.0 8.17.0 |
| 2.11.0 | Enhancement (View pull request) Update existing batch graphs with 50th and 90th percentiles during last minute. Replace average lifetime metric with last one minute, for both batch's byte size and value, to be coherent with the other graphed percentiles.. Note that these metrics will only show results for Logstash versions 9.4.0 or later. |
9.0.0 8.17.0 |
| 2.10.1 | Bug fix (View pull request) Fixes navigation of batch metrics when the integration is used to monitor an older version of Logstash that doesn't expose. |
9.0.0 8.17.0 |
| 2.10.0 | Enhancement (View pull request) Enable TSDB for the node_cel and health_report metrics data streams. Fix incorrect metric_type in node_cel, pipeline, and plugins data streams. |
9.0.0 8.17.0 |
| 2.9.0 | Enhancement (View pull request) Adds visualizations for monitoring batch event count and byte size. Note that these metrics will only show results for Logstash versions 9.2.0 or later. |
9.0.0 8.17.0 |
| 2.8.0 | Enhancement (View pull request) Adds a dashboard for monitoring current and peak connections in the elastic_agent or beats input plugins. These metrics are available only in Logstash versions 8.18.7, 8.19.4, 9.0.7, 9.1.4, or later. Older versions do not expose them. |
9.0.0 8.17.0 |
| 2.7.4 | Bug fix (View pull request) Fixes incorrect calculations of time spent per event metrics. The calculation now reflects the "maximum time spent per event within the selected Kibana date range". The updated metrics are, Pipelines Overview dashboard → Max time taken per event (ms), Logstash Single Pipeline View dashboard → Max time spent pushing per event, Max time spent filtering per event, Max time spent per event |
9.0.0 8.17.0 |
| 2.7.3 | Bug fix (View pull request) Use Links panel in dashboards. |
9.0.0 8.17.0 |
| 2.7.2 | Bug fix (View pull request) Aligns log and slow logs file names with Logstash default. |
9.0.0 8.17.0 |
| 2.7.1 | Enhancement (View pull request) Fixes the Logstash Health Report data stream to conditionally parse the pipeline state and flow fields. |
9.0.0 8.17.0 |
| 2.7.0 | Enhancement (View pull request) Add support for Kibana 9.0 |
9.0.0 8.17.0 |
| 2.6.2 | Bug fix (View pull request) Updated SSL description to be uniform and to include links to documentation. |
8.17.0 |
| 2.6.1 | Enhancement (View pull request) Bump patch version to fix release of integration |
8.17.0 |
| 2.6.0 | Enhancement (View pull request) Add data and dashboards from Logstash Health Report |
— |
| 2.5.0 | Enhancement (View pull request) Allow the usage of deprecated log input and support for stack 9.0 |
8.10.1 |
| 2.4.12 | Enhancement (View pull request) Update documentation for GA of agent based monitoring |
8.10.1 |
| 2.4.11 | Bug fix (View pull request) Guard against missing elements in codec payload |
8.10.1 |
| 2.4.10 | Enhancement (View pull request) Add Pipeline information to Pipelines View page |
8.10.1 |
| 2.4.9 | Enhancement (View pull request) Add pipeline level worker utilization graphs, and remove incorrect flow metrics information |
8.10.1 |
| 2.4.8 | Bug fix (View pull request) Add guard against empty graph returned by Logstash API |
8.10.1 |
| 2.4.7 | Bug fix (View pull request) Add the cluster UUID to the node datastream |
8.10.1 |
| 2.4.6 | Bug fix (View pull request) Fix support for conditions in Logstash cel inputs |
8.10.1 |
| 2.4.5 | Enhancement (View pull request) Add plugin_id parsing for plain format logs |
8.10.1 |
| 2.4.4 | Bug fix (View pull request) Fix type checking issue with latest version of beats/cel-go |
8.10.1 |
| 2.4.3 | Bug fix (View pull request) Add missing queue.capacity.* mappings |
8.10.1 |
| 2.4.2 | Enhancement (View pull request) Add link to Logstash monitoring docs |
8.10.1 |
| 2.4.1 | Bug fix (View pull request) Add missing host.ip field mapping |
8.10.1 |
| 2.4.0 | Enhancement (View pull request) Make Stack Monitoring metrics GA |
8.10.1 |
| 2.3.6 | Enhancement (View pull request) Add Plugin drilldown |
8.10.1 |
| 2.3.5 | Enhancement (View pull request) Update manifest format version to 3.0.0 for logstash integration package |
8.10.1 |
| 2.3.4 | Enhancement (View pull request) Introduce Logstash pipelines plugin retrieval and dashboards |
8.10.1 |
| 2.3.3 | Enhancement (View pull request) Introduce Logstash node dashboards into integration package |
8.7.1 |
| 2.3.2 | Bug fix (View pull request) Add missing event fields field mapping |
8.5.0 |
| 2.3.1 | Bug fix (View pull request) Add explicit mapping for event timestamp fields |
8.5.0 |
| 2.3.0 | Enhancement (View pull request) GA release |
8.5.0 |
| 2.3.0-preview1 | Enhancement (View pull request) Add ability to set condition for logs and metrics. |
— |
| 2.2.3-preview1 | Bug fix (View pull request) Clarify that the metrics collected power the Stack Monitoring application |
— |
| 2.2.2-preview1 | Bug fix (View pull request) Add missing node_stats cpu aliases |
— |
| 2.2.1-preview1 | Enhancement (View pull request) Add period variable to define polling frequency |
— |
| 2.2.0-preview1 | Enhancement (View pull request) Add ssl configuration option for metricsets |
— |
| 2.1.1-preview1 | Bug fix (View pull request) Fix mappings of type nested |
— |
| 2.1.0-preview1 | Enhancement (View pull request) Suffix stack_monitoring to the datasetsBug fix (View pull request) Align metrics mappings with metricbeat |
— |
| 1.1.0 | Bug fix (View pull request) Make experimental package stop breaking stack version ^8.0.0 by fixing compatible version range |
— |
| 1.0.2 | Bug fix (View pull request) Revert package to experimental |
— |
| 1.0.1 | Enhancement (View pull request) Uniform with guidelines |
— |
| 1.0.0 | Enhancement (View pull request) initial release |
7.15.0 |