Grafana Integration
Elastic Cloud Serverless projects are autoscaled environments, fully managed by Elastic and available on Elastic Cloud. Availability This functionality is in technical preview and is ready for evaluation. Use with caution in production; it is not recommended for mission-critical workloads. Elastic will work to fix any issues, but features in technical preview are not subject to the support SLA of official GA features. Specific Support terms apply. Elastic Cloud Serverless projects are autoscaled environments, fully managed by Elastic and available on Elastic Cloud. Availability This functionality is in technical preview and is ready for evaluation. Use with caution in production; it is not recommended for mission-critical workloads. Elastic will work to fix any issues, but features in technical preview are not subject to the support SLA of official GA features. Specific Support terms apply. The Elastic Stack includes Elastic's core products such as Elasticsearch, Kibana, Logstash, and Beats. Availability This functionality is in technical preview and is ready for evaluation. Use with caution in production; it is not recommended for mission-critical workloads. Elastic will work to fix any issues, but features in technical preview are not subject to the support SLA of official GA features. Specific Support terms apply. Unless stated otherwise on the page, this functionality is available when your Elastic Stack is deployed on Elastic Cloud Hosted, Elastic Cloud Enterprise, Elastic Cloud on Kubernetes, and self-managed environments. This documentation corresponds to the latest patch available for each minor version. If you're not using the latest patch, check the release notes for changes.
Serverless Observability
Preview
Preview
Serverless Security
Preview
Preview
Stack
Preview
9.0+
Preview since 9.0
| Version | 0.1.0 Availability Preview This functionality is in technical preview and is ready for evaluation. Use with caution in production; it is not recommended for mission-critical workloads. Elastic will work to fix any issues, but features in technical preview are not subject to the support SLA of official GA features. Specific Support terms apply. (View all) |
| Subscription level What's this? |
Basic |
| Developed by What's this? |
Community |
| Ingestion method(s) | File, Prometheus |
| Minimum Kibana version(s) | 9.0.0 8.16.0 |
To use pre-release integrations, go to the Integrations page in Kibana, scroll down, and toggle on the Display beta integrations option.
The Grafana integration collects metrics and logs from Grafana instances using Elastic Agent.
This integration has been tested with Grafana versions 10.x, 11.x, and 12.x.
The metrics data stream scrapes Prometheus metrics from Grafana's /metrics endpoint. It collects application-level metrics (HTTP performance, alerting, datasource requests, database connections, instance stats) and Go runtime metrics (CPU, memory, goroutines, file descriptors).
Grafana must have metrics enabled (GF_METRICS_ENABLED=true or [metrics] enabled = true in grafana.ini). Metrics are enabled by default.
Example
{
    "@timestamp": "2026-02-16T21:00:00.000Z",
    "data_stream": {
        "type": "metrics",
        "dataset": "grafana.metrics",
        "namespace": "default"
    },
    "event": {
        "kind": "metric",
        "module": "grafana",
        "dataset": "grafana.metrics"
    },
    "grafana": {
        "stat": {
            "dashboards": {
                "total": 35
            },
            "users": {
                "total": 1,
                "active": 1
            },
            "datasources": {
                "total": 5
            },
            "alert_rules": {
                "total": 0
            },
            "orgs": {
                "total": 1
            },
            "folders": {
                "total": 8
            },
            "admins": {
                "total": 1
            },
            "editors": {
                "total": 1
            },
            "viewers": {
                "total": 0
            }
        },
        "alerting": {
            "active_alerts": 0,
            "active_configurations": 1,
            "ticker": {
                "interval_seconds": 10
            }
        },
        "database": {
            "connections": {
                "open": 2,
                "in_use": 0,
                "idle": 2,
                "max_open": 0
            }
        },
        "api": {
            "login": {
                "post": {
                    "total": 1
                }
            }
        },
        "authentication": {
            "attempts": 850
        },
        "build_info": {
            "_value": 1
        },
        "process": {
            "cpu": {
                "seconds": {
                    "total": 94.98
                }
            },
            "memory": {
                "resident_bytes": 282255360,
                "virtual_bytes": 1800351744
            },
            "open_fds": 19,
            "max_fds": 10000
        },
        "go": {
            "goroutines": 388,
            "threads": 17,
            "memstats": {
                "heap_alloc_bytes": 58324944,
                "alloc_bytes": 58324944,
                "sys_bytes": 138340632
            },
            "gc": {
                "duration": {
                    "count": 180,
                    "seconds": 0.025293074
                }
            }
        }
    },
    "service": {
        "address": "grafana:3000",
        "name": "grafana"
    },
    "host": {
        "name": "grafana-host"
    }
}
ECS Field Reference
Refer to the following document for detailed information on ECS fields.
Exported fields
| Field | Description | Type | Unit | Metric Type |
|---|---|---|---|---|
| @timestamp | Event timestamp. | date | ||
| cloud.account.id | Cloud account ID. | keyword | ||
| cloud.availability_zone | Cloud availability zone. | keyword | ||
| cloud.image.id | Image ID for the cloud instance. | keyword | ||
| cloud.instance.id | Cloud instance ID. | keyword | ||
| cloud.provider | Cloud provider name. | keyword | ||
| cloud.region | Cloud region. | keyword | ||
| container.id | Container ID. | keyword | ||
| data_stream.dataset | Data stream dataset. | constant_keyword | ||
| data_stream.namespace | Data stream namespace. | constant_keyword | ||
| data_stream.type | Data stream type. | constant_keyword | ||
| event.dataset | Event dataset. | constant_keyword | ||
| event.module | Event module. | constant_keyword | ||
| grafana.alerting.active_alerts | Number of active alerts. | long | gauge | |
| grafana.alerting.active_configurations | Number of active alerting configurations. | long | gauge | |
| grafana.alerting.alerts | Number of alerts by state. | long | gauge | |
| grafana.alerting.alerts_invalid.total | Total invalid alerts received. | long | counter | |
| grafana.alerting.alerts_received.total | Total alerts received. | long | counter | |
| grafana.alerting.execution_time.count | Alert execution time observation count. | long | counter | |
| grafana.alerting.execution_time.milliseconds | Alert execution time sum in milliseconds. | double | counter | |
| grafana.alerting.notification.failed.total | Alert notifications failed by type. | long | counter | |
| grafana.alerting.notification.sent.total | Alert notifications sent by type. | long | counter | |
| grafana.alerting.notification_latency.count | Alert notification latency count. | long | counter | |
| grafana.alerting.notification_latency.seconds | Alert notification latency sum in seconds. | double | counter | |
| grafana.alerting.result.total | Alert execution results by state. | long | counter | |
| grafana.alerting.schedule.alert_rules | Number of alert rules scheduled. | long | gauge | |
| grafana.alerting.scheduler.behind_seconds | How far behind the alerting scheduler is in seconds. | double | gauge | |
| grafana.alerting.silences | Number of silences by state. | long | gauge | |
| grafana.alerting.ticker.interval_seconds | Alerting ticker interval in seconds. | double | gauge | |
| grafana.api.dashboard.get.count | Dashboard GET request count. | long | counter | |
| grafana.api.dashboard.get.milliseconds | Dashboard GET request duration quantile in milliseconds. | double | gauge | |
| grafana.api.dashboard.get.sum | Dashboard GET request duration sum in milliseconds. | double | counter | |
| grafana.api.dashboard.insert.total | Total dashboard inserts. | long | counter | |
| grafana.api.dashboard.save.count | Dashboard save request count. | long | counter | |
| grafana.api.dashboard.save.milliseconds | Dashboard save duration quantile in milliseconds. | double | gauge | |
| grafana.api.dashboard.save.sum | Dashboard save duration sum in milliseconds. | double | counter | |
| grafana.api.dashboard.search.count | Dashboard search request count. | long | counter | |
| grafana.api.dashboard.search.milliseconds | Dashboard search duration quantile in milliseconds. | double | gauge | |
| grafana.api.dashboard.search.sum | Dashboard search duration sum in milliseconds. | double | counter | |
| grafana.api.dashboard.snapshot.create.total | Total dashboard snapshots created. | long | counter | |
| grafana.api.dashboard.snapshot.get.total | Total dashboard snapshot retrievals. | long | counter | |
| grafana.api.dataproxy.request.count | Data proxy request count. | long | counter | |
| grafana.api.dataproxy.request.milliseconds | Data proxy request duration quantile in milliseconds. | double | gauge | |
| grafana.api.dataproxy.request.sum | Data proxy request duration sum in milliseconds. | double | counter | |
| grafana.api.login.oauth.total | Total OAuth login attempts. | long | counter | |
| grafana.api.login.post.total | Total POST login attempts. | long | counter | |
| grafana.api.response.status.total | Total API responses by status code. | long | counter | |
| grafana.authentication.attempts | Total authentication attempts. | long | counter | |
| grafana.authentication.failed.total | Total failed authentications. | long | counter | |
| grafana.authentication.successful.total | Total successful authentications. | long | counter | |
| grafana.authentication.user_requests | Authenticated user requests. | long | counter | |
| grafana.build_info._value | Build info metric value (always 1). | double | gauge | |
| grafana.build_info.edition | Grafana edition (oss or enterprise). | keyword | ||
| grafana.build_info.timestamp | Build timestamp. | double | gauge | |
| grafana.build_info.version | Grafana version from build info. | keyword | ||
| grafana.database.connections.idle | Idle database connections. | long | gauge | |
| grafana.database.connections.in_use | In-use database connections. | long | gauge | |
| grafana.database.connections.max_idle_closed | Total connections closed due to max idle limit. | long | counter | |
| grafana.database.connections.max_idle_closed_seconds | Total time of max idle closed connections. | double | counter | |
| grafana.database.connections.max_lifetime_closed | Total connections closed due to max lifetime. | long | counter | |
| grafana.database.connections.max_open | Maximum open database connections allowed. | long | gauge | |
| grafana.database.connections.open | Open database connections. | long | gauge | |
| grafana.database.connections.wait_count | Total connection wait count. | long | counter | |
| grafana.database.connections.wait_duration_seconds | Total time blocked waiting for a connection in seconds. | double | counter | |
| grafana.datasource.query_by_id.total | Total datasource queries by ID. | long | counter | |
| grafana.datasource.request.total | Total datasource requests. | long | counter | |
| grafana.emails.sent.failed | Total emails failed to send. | long | counter | |
| grafana.emails.sent.total | Total emails sent. | long | counter | |
| grafana.environment_info._value | Environment info metric value (always 1). | double | gauge | |
| grafana.frontend.boot.fcp.count | First Contentful Paint observation count. | long | counter | |
| grafana.frontend.boot.fcp.seconds | First Contentful Paint time sum in seconds. | double | counter | |
| grafana.frontend.boot.load_time.count | Frontend boot load time observation count. | long | counter | |
| grafana.frontend.boot.load_time.seconds | Frontend boot load time sum in seconds. | double | counter | |
| grafana.go.gc.duration.count | GC pause count. | long | counter | |
| grafana.go.gc.duration.seconds | GC pause duration sum in seconds. | double | counter | |
| grafana.go.goroutines | Number of goroutines. | long | gauge | |
| grafana.go.memstats.alloc_bytes | Bytes allocated and in use. | long | byte | gauge |
| grafana.go.memstats.alloc_bytes_total | Total bytes allocated even if freed. | long | byte | counter |
| grafana.go.memstats.buck_hash_sys_bytes | Bytes used by profiling bucket hash table. | long | byte | gauge |
| grafana.go.memstats.frees_total | Total number of heap object frees. | long | counter | |
| grafana.go.memstats.gc_sys_bytes | Bytes used for GC metadata. | long | byte | gauge |
| grafana.go.memstats.heap_alloc_bytes | Heap bytes allocated and in use. | long | byte | gauge |
| grafana.go.memstats.heap_idle_bytes | Heap bytes waiting to be used. | long | byte | gauge |
| grafana.go.memstats.heap_inuse_bytes | Heap bytes in use by spans. | long | byte | gauge |
| grafana.go.memstats.heap_objects | Number of allocated heap objects. | long | gauge | |
| grafana.go.memstats.heap_released_bytes | Heap bytes released to the OS. | long | byte | gauge |
| grafana.go.memstats.heap_sys_bytes | Heap bytes obtained from the OS. | long | byte | gauge |
| grafana.go.memstats.last_gc_time_seconds | Last GC time in seconds since epoch. | double | gauge | |
| grafana.go.memstats.mallocs_total | Total number of heap object allocations. | long | counter | |
| grafana.go.memstats.mcache_inuse_bytes | MCache structures in use. | long | byte | gauge |
| grafana.go.memstats.mcache_sys_bytes | MCache structures obtained from OS. | long | byte | gauge |
| grafana.go.memstats.mspan_inuse_bytes | MSpan structures in use. | long | byte | gauge |
| grafana.go.memstats.mspan_sys_bytes | MSpan structures obtained from OS. | long | byte | gauge |
| grafana.go.memstats.next_gc_bytes | Target heap size for next GC cycle. | long | byte | gauge |
| grafana.go.memstats.other_sys_bytes | Other system bytes. | long | byte | gauge |
| grafana.go.memstats.stack_inuse_bytes | Stack bytes in use. | long | byte | gauge |
| grafana.go.memstats.stack_sys_bytes | Stack bytes obtained from the OS. | long | byte | gauge |
| grafana.go.memstats.sys_bytes | Total bytes of memory obtained from the OS. | long | byte | gauge |
| grafana.go.threads | Number of OS threads created. | long | gauge | |
| grafana.http.request.count | HTTP request count by handler, method, and status code. | long | counter | |
| grafana.http.request.duration.seconds | HTTP request duration sum in seconds. | double | counter | |
| grafana.http.request.in_flight | Number of HTTP requests currently in flight. | long | gauge | |
| grafana.http.response.size.bytes | HTTP response size sum in bytes. | double | counter | |
| grafana.http.response.size.count | HTTP response count by handler. | long | counter | |
| grafana.instance.id | Unique Grafana instance identifier. | keyword | ||
| grafana.instance.start_total | Total instance starts. | long | counter | |
| grafana.live.channels | Number of live channels. | long | gauge | |
| grafana.live.clients | Number of live clients. | long | gauge | |
| grafana.live.subscriptions | Number of live subscriptions. | long | gauge | |
| grafana.live.users | Number of live users. | long | gauge | |
| grafana.page.response.status.total | Total page responses by status code. | long | counter | |
| grafana.process.cpu.seconds.total | Total user and system CPU time in seconds. | double | counter | |
| grafana.process.max_fds | Maximum number of file descriptors. | long | gauge | |
| grafana.process.memory.resident_bytes | Resident memory size in bytes. | long | byte | gauge |
| grafana.process.memory.virtual_bytes | Virtual memory size in bytes. | long | byte | gauge |
| grafana.process.network.receive_bytes | Network bytes received. | long | byte | counter |
| grafana.process.network.transmit_bytes | Network bytes transmitted. | long | byte | counter |
| grafana.process.open_fds | Number of open file descriptors. | long | gauge | |
| grafana.process.start_time_seconds | Process start time in seconds since epoch. | double | gauge | |
| grafana.proxy.response.status.total | Total proxy responses by status code. | long | counter | |
| grafana.public_dashboard.request_count | Public dashboard request count. | long | counter | |
| grafana.rendering.queue_size | Rendering queue size. | long | gauge | |
| grafana.stat.active_admins.total | Active admin users. | long | gauge | |
| grafana.stat.active_editors.total | Active editor users. | long | gauge | |
| grafana.stat.active_viewers.total | Active viewer users. | long | gauge | |
| grafana.stat.admins.total | Total admin users. | long | gauge | |
| grafana.stat.alert_rules.total | Total alert rules. | long | gauge | |
| grafana.stat.annotations.total | Total annotations. | long | gauge | |
| grafana.stat.correlations.total | Total correlations. | long | gauge | |
| grafana.stat.dashboard_versions.total | Total dashboard versions. | long | gauge | |
| grafana.stat.dashboards.total | Total number of dashboards. | long | gauge | |
| grafana.stat.data_keys.total | Total data keys. | long | gauge | |
| grafana.stat.datasources.total | Total datasources. | long | gauge | |
| grafana.stat.editors.total | Total editor users. | long | gauge | |
| grafana.stat.folders.total | Total folders. | long | gauge | |
| grafana.stat.library_panels.total | Total library panels. | long | gauge | |
| grafana.stat.orgs.total | Total organizations. | long | gauge | |
| grafana.stat.playlists.total | Total playlists. | long | gauge | |
| grafana.stat.public_dashboards.total | Total public dashboards. | long | gauge | |
| grafana.stat.repositories.total | Total repositories. | long | gauge | |
| grafana.stat.rule_groups.total | Total rule groups. | long | gauge | |
| grafana.stat.service_accounts.total | Total service accounts. | long | gauge | |
| grafana.stat.teams.total | Total teams. | long | gauge | |
| grafana.stat.users.active | Active users. | long | gauge | |
| grafana.stat.users.total | Total users. | long | gauge | |
| grafana.stat.viewers.total | Total viewer users. | long | gauge | |
| host.containerized | Whether the host is a container. | boolean | ||
| host.name | Host name. | keyword | ||
| host.os.build | OS build information. | keyword | ||
| host.os.codename | OS codename, if any. | keyword | ||
| prometheus.labels.* | Prometheus metric labels. | keyword |
The logs data stream collects Grafana server logs from file. Both JSON and logfmt (the default) formats are supported. To use JSON logging, set format = json under [log.file] in grafana.ini or set the GF_LOG_FILE_FORMAT=json environment variable.
Example
{
    "@timestamp": "2026-02-16T20:59:08.907Z",
    "data_stream": {
        "type": "logs",
        "dataset": "grafana.logs",
        "namespace": "default"
    },
    "event": {
        "kind": "event",
        "module": "grafana",
        "dataset": "grafana.logs",
        "severity": 6,
        "duration": 9376553
    },
    "log": {
        "level": "info",
        "logger": "context"
    },
    "message": "Request Completed",
    "http": {
        "request": {
            "method": "GET"
        },
        "response": {
            "status_code": -1,
            "body": {
                "bytes": 0
            }
        }
    },
    "url": {
        "path": "/api/live/ws"
    },
    "client": {
        "ip": "172.30.0.1"
    },
    "user": {
        "name": "admin"
    },
    "grafana": {
        "log": {
            "orgId": 1,
            "handler": "/api/live/ws"
        }
    },
    "host": {
        "name": "grafana-host"
    }
}
ECS Field Reference
Refer to the following document for detailed information on ECS fields.
Exported fields
| Field | Description | Type |
|---|---|---|
| @timestamp | Event timestamp. | date |
| cloud.account.id | Cloud account ID. | keyword |
| cloud.availability_zone | Cloud availability zone. | keyword |
| cloud.image.id | Image ID for the cloud instance. | keyword |
| cloud.instance.id | Cloud instance ID. | keyword |
| cloud.provider | Cloud provider name. | keyword |
| cloud.region | Cloud region. | keyword |
| container.id | Container ID. | keyword |
| data_stream.dataset | Data stream dataset. | constant_keyword |
| data_stream.namespace | Data stream namespace. | constant_keyword |
| data_stream.type | Data stream type. | constant_keyword |
| event.dataset | Event dataset. | constant_keyword |
| event.module | Event module. | constant_keyword |
| grafana.log.handler | Request handler name. | keyword |
| grafana.log.orgId | Organization ID in context. | long |
| grafana.log.subUrl | Grafana sub-URL prefix. | keyword |
| host.containerized | Whether the host is a container. | boolean |
| host.name | Host name. | keyword |
| host.os.build | OS build information. | keyword |
| host.os.codename | OS codename, if any. | keyword |
| input.type | Type of Filebeat input. | keyword |
| log.offset | Log offset. | long |
- Add the Grafana integration in Fleet.
- Configure the Grafana Hosts to point at your Grafana instance(s), for example
http://grafana:3000. - For logs, set the Log Paths to the location of your Grafana log file(s), for example
/var/log/grafana/grafana.log. - If your
/metricsendpoint requires authentication, provide the Username and Password.
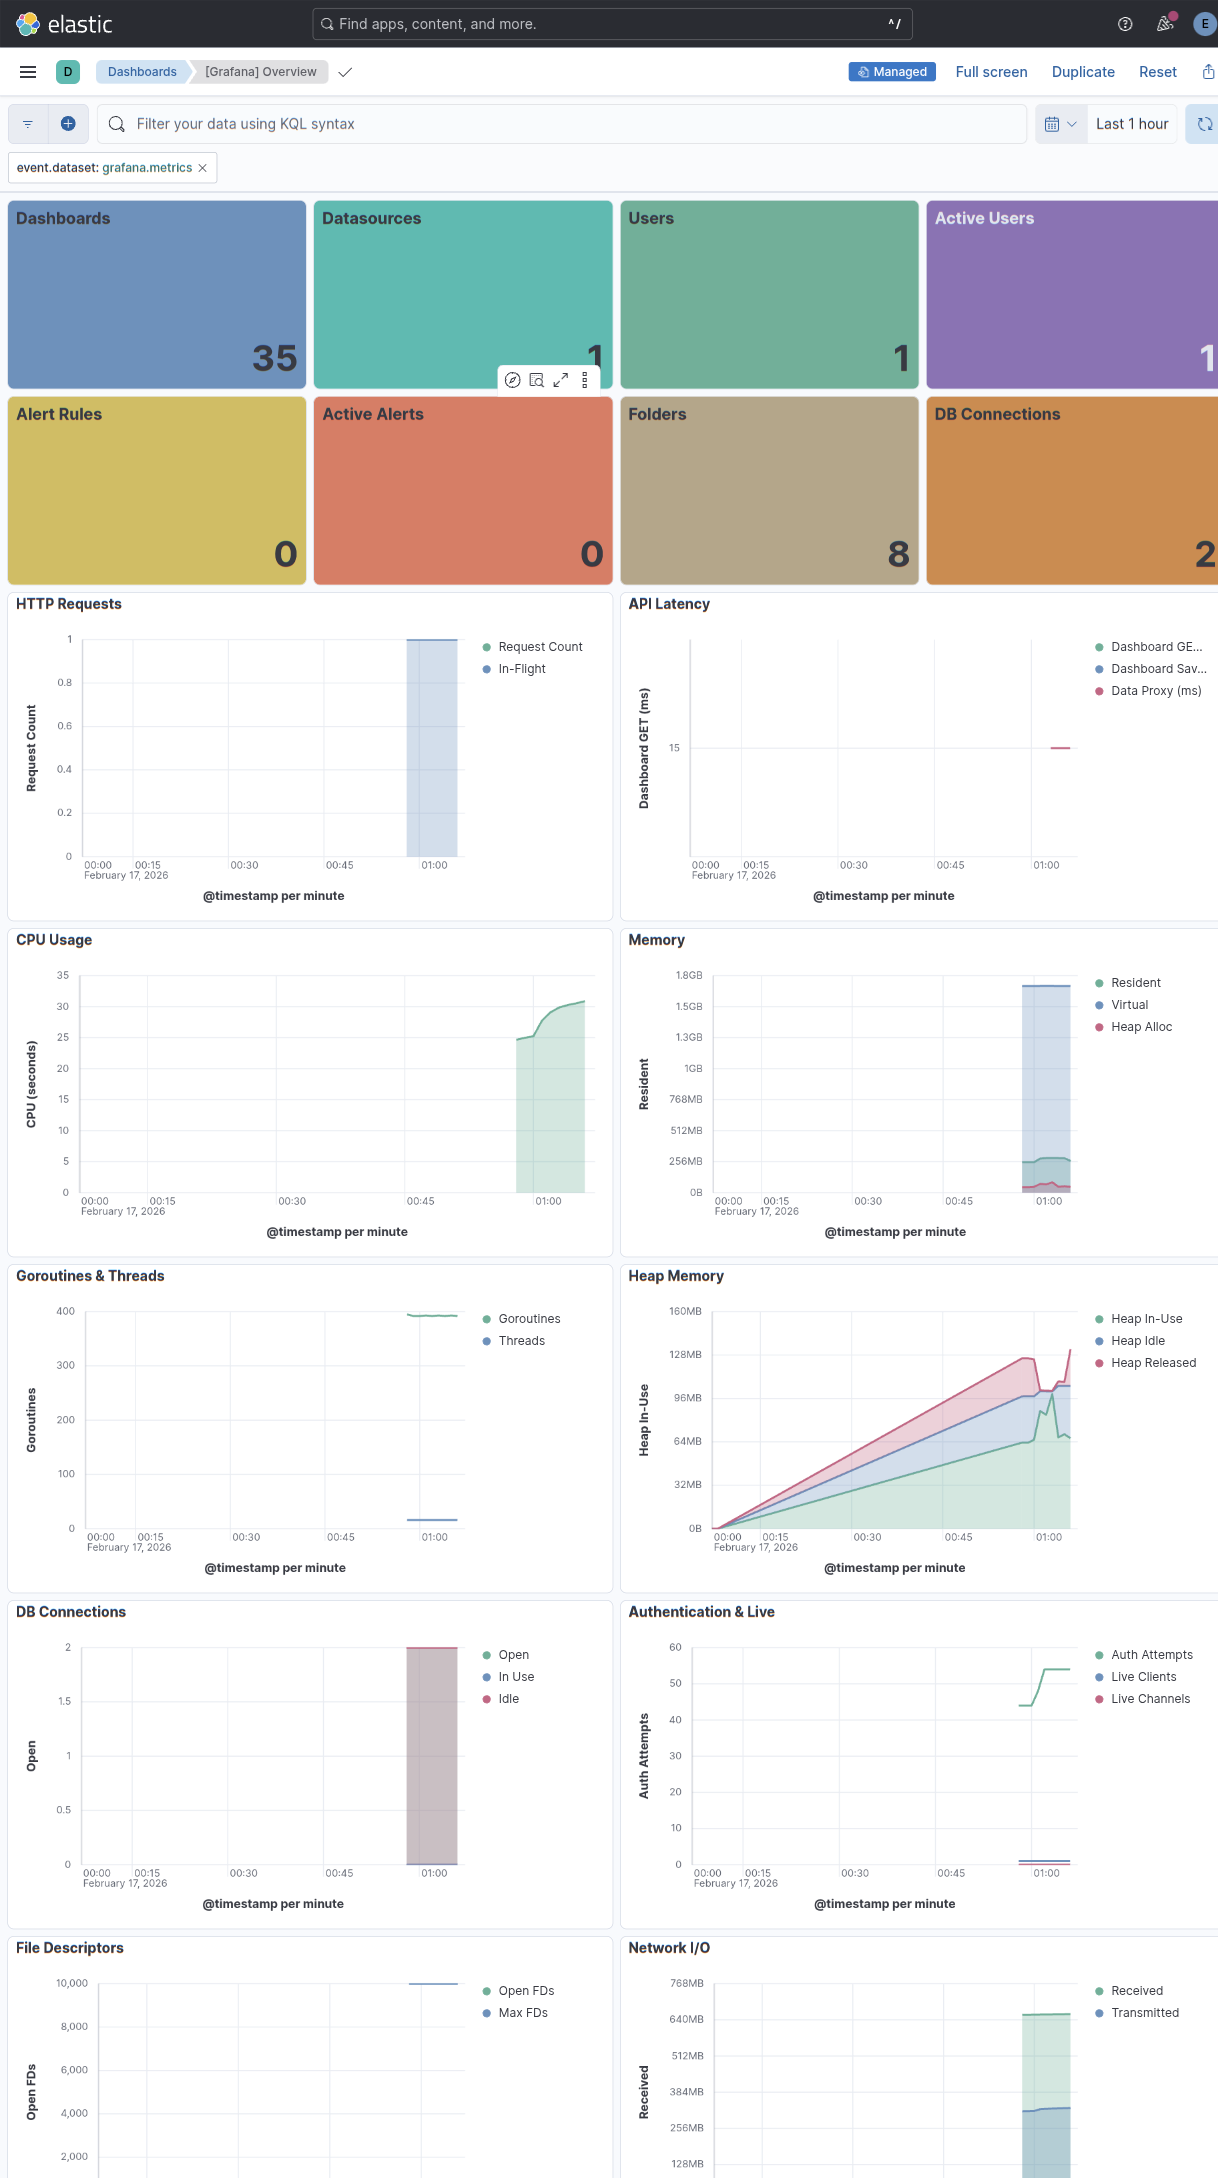
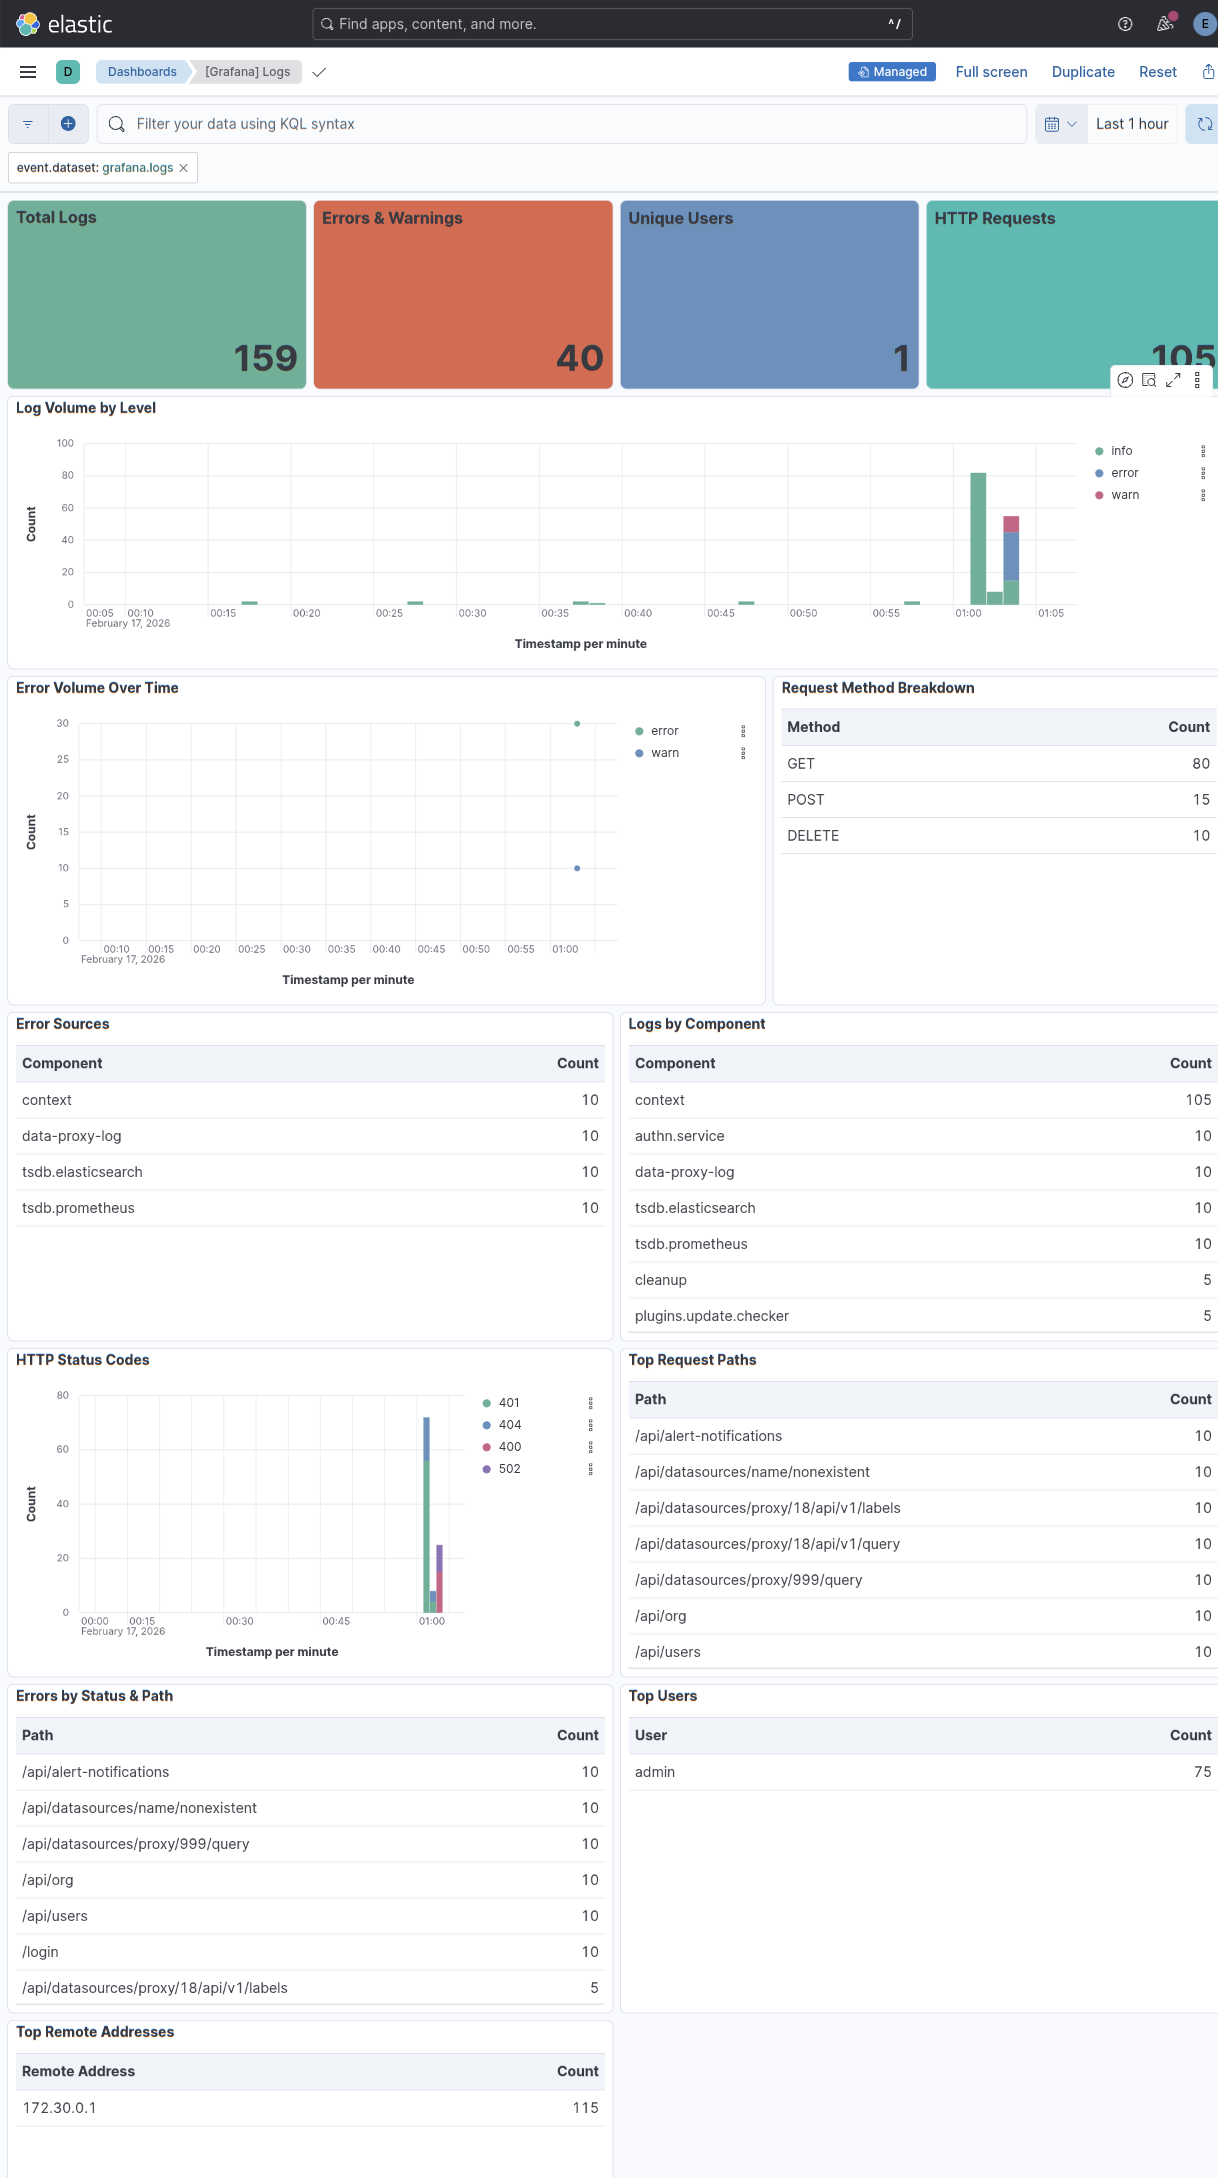
The integration includes two dashboards:
- [Grafana] Overview — Instance stats, CPU, memory, goroutines, file descriptors, database connections, and alerting status.
- [Grafana] Logs — Log volume by level, top error messages, component breakdown, HTTP status codes, and request paths.
This integration includes one or more Kibana dashboards that visualizes the data collected by the integration. The screenshots below illustrate how the ingested data is displayed.
Changelog
| Version | Details | Minimum Kibana version |
|---|---|---|
| 0.1.0 | Enhancement (View pull request) Initial release with metrics and logs data streams. |
9.0.0 8.16.0 |