GreyNoise
Elastic Cloud Serverless projects are autoscaled environments, fully managed by Elastic and available on Elastic Cloud. Availability This functionality is in technical preview and is ready for evaluation. Use with caution in production; it is not recommended for mission-critical workloads. Elastic will work to fix any issues, but features in technical preview are not subject to the support SLA of official GA features. Specific Support terms apply. The Elastic Stack includes Elastic's core products such as Elasticsearch, Kibana, Logstash, and Beats. Availability This functionality is in technical preview and is ready for evaluation. Use with caution in production; it is not recommended for mission-critical workloads. Elastic will work to fix any issues, but features in technical preview are not subject to the support SLA of official GA features. Specific Support terms apply. Unless stated otherwise on the page, this functionality is available when your Elastic Stack is deployed on Elastic Cloud Hosted, Elastic Cloud Enterprise, Elastic Cloud on Kubernetes, and self-managed environments. This documentation corresponds to the latest patch available for each minor version. If you're not using the latest patch, check the release notes for changes.
Serverless Security
Preview
Preview
Stack
Preview
9.1+
Preview since 9.1
| Version | 0.12.0 Availability Preview This functionality is in technical preview and is ready for evaluation. Use with caution in production; it is not recommended for mission-critical workloads. Elastic will work to fix any issues, but features in technical preview are not subject to the support SLA of official GA features. Specific Support terms apply. (View all) |
| Managed integration release status | GA |
| Subscription level What's this? |
Basic |
| Developed by What's this? |
Community |
| Ingestion method(s) | API |
| Minimum Kibana version(s) | 9.1.0 8.19.0 |
You can use this integration as an Elastic Managed integration on Elastic Cloud Hosted deployments running this version or later.
To use pre-release integrations, go to the Integrations page in Kibana, scroll down, and toggle on the Display beta integrations option.
GreyNoise is a cybersecurity platform that helps security teams filter out "internet noise" — background internet scanning activity that's not necessarily targeted or malicious. It collects, analyzes, and labels massive amounts of data from internet-wide scans, typically originating from bots, security researchers, or compromised systems.
Customers must have access to the Enterprise API to fetch data from GreyNoise. You can verify your API key access here.
Elastic Managed integrations are only supported on Elastic Cloud Serverless and Elastic Cloud Hosted deployments. An Elastic Managed integration lets you ingest data from a cloud source while avoiding the orchestration, management, and maintenance associated with standard ingest infrastructure. Elastic runs the collector for you, so you can focus on your data instead of the infrastructure that collects it.
For more information, refer to Elastic Managed integrations and the Elastic Managed integrations FAQ.
Elastic Agent must be installed. For more details, check the Elastic Agent installation instructions.
- After logging in to GreyNoise, navigate to your account page.
- Click "View API Key" to display and copy your unique API key.
- In Kibana, go to Management > Integrations.
- In the "Search for integrations" search bar, type GreyNoise.
- Click the GreyNoise integration from the search results.
- Click the Add GreyNoise button to add the integration.
- While adding the integration, provide the following details to collect logs via REST API:
- API Key
- Interval
- (Optional) Query for custom query filtering
- Click Save and Continue to save the integration.
The "last_seen" field should not be included in the query as it is predefined with a fixed value of "1d".
To keep the collected data up to date, Transforms are used.
You can view transforms by navigating to Management > Stack Management > Transforms.
Here, you can see continuously running transforms and view the latest transformed GreyNoise data in the Discover section.
The labels.is_transform_source field indicates log origin:
- False for transformed index
- True for source index
Currently, one transform is running for the IP datastream:
| Transform Name | Description |
|---|---|
IP Transform (ID: logs-ti_greynoise.ip) |
Keeps IP entity type data up to date |
For example:
- The query
event.module: ti_greynoise and labels.is_transform_source: trueshows logs from the source index - The query
event.module: ti_greynoise and labels.is_transform_source: falseshows logs from the transformed index
A retention policy removes data older than the default retention period. For more details, refer to the Retention Policy Documentation.
In this integration, the IP data stream has a default retention period of 7 days.
Detection Rules match your Elastic environment data with GreyNoise data, generating an alert when a match is found.
Follow Steps to Create Detection Rule below to create indicator match detection rule in Elastic.
- Navigate to Security > Rules > Detection Rules and click Create New Rule.
- Select Indicator Match as the rule type and do following changes.
- In Define Rule section:
- Index Pattern: Add the index pattern relevant to your data. Keeping this specific ensures optimal performance.
- Custom Query: Must include
NOT event.module : "ti_greynoise"to exclude GreyNoise events. - Indicator index patterns: Use
logs-ti_greynoise_latest.ip*. - Indicator index query: Refine indcator index with something like
@timestamp >= "now-7d/d". - Indicator Mapping:
- Field: Map to the field in your Elastic environment containing IPs.
- Indicator Index Field: threat.indicator.ip
- Required fields (Optional): Add
threat.indicator.ip. - Related integrations (Optional): Add
GreyNoise.
- In About Rule section:
- Name: e.g
GreyNoise Custom IP IOC Correlation. - Description: e.g
This rule is triggered when IP Address IOC's collected from the GreyNoise Integration have a match against IP Address that were found in the customer environment.. - Default Severity: e.g
critical. - Tags: Add
GreyNoise(used for filter Alerts generated by this rule by rule transforms). - Max alerts per run: Default is 100; configurable up to 1000.
- Indicator prefix override: Set to
greynoise.ipto enrich alerts with GreyNoise data.
- Name: e.g
- In Schedule Rules section:
- Set Runs Every - Defines how frequently the rule runs.
- Additional Lookback Time - Specifies how far back to check for matches.
To further restrict GreyNoise threat intelligence data used for matching, you can add KQL filters in Indicator index query section such as:
NOT greynoise.ip.internet_scanner_intelligence.classification : "benign"
You can also use the plus (+) filter button in Kibana to refine the GreyNoise threat intel dataset before matching it against your source index.
Once the rule is saved and enabled, alerts will appear in the Security > Alerts section when matches are detected.
The following transform and its associated pipelines are used to filter relevant data from alerts. Follow Steps to enable rule transforms to enable these transforms and populate Threat Intelligence dashboard.
| Transform Name | Description |
|---|---|
Detected IOC Transform (ID: logs-ti_greynoise.rule, Pipeline: ti_greynoise-correlation_detection_rule-pipeline) |
Filters and extracts necessary information from Detected IOCs. |
- Navigate to Stack Management > Transforms in Kibana.
- Locate the transform you want to enable by searching for its Transform ID.
- Click the three dots next to the transform, then select Edit.
- Under the Destination configuration section, set the Ingest Pipeline:
- Rule transform in the GreyNoise integration has a corresponding ingest pipeline.
- Refer to the Transforms table above for the appropriate pipeline name associated with transform.
- Prefix the pipeline name with the integration version.
For example:
Text {package_version}-ti_greynoise-correlation_detection_rule-pipeline - Click Update to save the changes.
- Click the three dots again next to the transform and select Start to activate it.
- When the integration is updated, the rule transform will be stopped.
- After updating integration, you must reconfigure the rule transform by adding the pipeline with the updated integration version.
- If you experience latency issues during data collection, consider increasing the
HTTP Client Timeoutconfiguration parameter. - If server-side errors occur, consider reducing the
Page Sizeconfiguration parameter. Note: Avoid setting thePage Sizetoo low, as this may increase the number of API requests, potentially causing processing issues. - If events are not appearing in the transformed index, check if transforms are running without errors. For issues, refer to Troubleshooting transforms.
- If detection rules take longer to run, ensure you have specified index patterns and applied queries to make your source events more specific. Note: More events in index patterns means more time needed for detection rules to run.
- Ensure that relevant fields are correctly mapped in the Indicator Mapping section. Verify that fields in the specified index pattern are properly mapped, and ensure entity-specific fields (e.g., IP fields to IP fields) are accurately configured.
- If any transform is not in a Healthy state, try resetting it:
- Click the three dots next to the transform, then select Reset.
- After resetting, restart the transform.
- If dashboards are not updating after an integration upgrade, verify that the rule transform is running with the correct ingest pipeline.
- Reconfigure the rule transform to use the updated pipeline name, including the integration version.
For example:
Text {updated_package_version}-ti_greynoise-correlation_detection_rule-pipeline
- Reconfigure the rule transform to use the updated pipeline name, including the integration version.
For example:
This is the IP dataset. It uses the GNQL Endpoint to fetch data from GreyNoise with "last_seen:1d". It uses version v3 of the API to collect indicators. Currently, the Triage and Business Services Intelligence Modules are being collected through this data stream.
Example
{
    "@timestamp": "2025-08-25T12:04:07.311Z",
    "agent": {
        "ephemeral_id": "df2440cf-2988-4c8e-a9d8-732bf683e75d",
        "id": "4fa94654-7250-428e-af26-eb9bea157680",
        "name": "elastic-agent-47174",
        "type": "filebeat",
        "version": "8.17.0"
    },
    "data_stream": {
        "dataset": "ti_greynoise.ip",
        "namespace": "68551",
        "type": "logs"
    },
    "ecs": {
        "version": "8.17.0"
    },
    "elastic_agent": {
        "id": "4fa94654-7250-428e-af26-eb9bea157680",
        "snapshot": false,
        "version": "8.17.0"
    },
    "event": {
        "agent_id_status": "verified",
        "category": [
            "threat"
        ],
        "dataset": "ti_greynoise.ip",
        "ingested": "2025-08-25T12:04:10Z",
        "kind": "enrichment",
        "original": "{\"business_service_intelligence\":{\"category\":\"public_dns\",\"description\":\"Google's global domain name system (DNS) resolution service.\",\"explanation\":\"Public DNS services are used as alternatives to ISP's name servers. You may see devices on your network communicating with Google Public DNS over port 53/TCP or 53/UDP to resolve DNS lookups.\",\"found\":true,\"last_updated\":\"2021-11-24T11:42:37Z\",\"name\":\"Google Public DNS\",\"reference\":\"https://developers.google.com/speed/public-dns/docs/isp#alternative\",\"trust_level\":\"1\"},\"internet_scanner_intelligence\":{\"actor\":\"unknown\",\"bot\":false,\"classification\":\"malicious\",\"cves\":[],\"first_seen\":\"\",\"found\":true,\"last_seen\":\"2025-04-22\",\"metadata\":{\"asn\":\"AS269415\",\"carrier\":\"\",\"category\":\"isp\",\"datacenter\":\"\",\"destination_asns\":[],\"destination_cities\":[],\"destination_countries\":[\"Iran\",\"Kazakhstan\"],\"destination_country_codes\":[\"IR\",\"KZ\"],\"domain\":\"clicknetfibra.net.br\",\"latitude\":0,\"longitude\":0,\"mobile\":false,\"organization\":\"CLICKNET FIBRA LTDA\",\"os\":\"\",\"rdns\":\"speedtest.clicknetfibra.net.br\",\"rdns_parent\":\"clicknetfibra.net.br\",\"rdns_validated\":false,\"region\":\"Mato Grosso do Sul\",\"sensor_count\":0,\"sensor_hits\":0,\"single_destination\":false,\"source_city\":\"Dourados\",\"source_country\":\"Brazil\",\"source_country_code\":\"BR\"},\"source\":{\"bytes\":0},\"spoofable\":true,\"ssh\":{\"key\":[]},\"tags\":[],\"tls\":{\"cipher\":[],\"ja4\":[]},\"tor\":false,\"vpn\":false,\"vpn_service\":\"\"},\"ip\":\"1.128.0.0\",\"last_seen_timestamp\":\"2025-04-22 00:26:29\"}",
        "type": [
            "indicator"
        ]
    },
    "greynoise": {
        "ip": {
            "business_service_intelligence": {
                "category": "public_dns",
                "description": "Google's global domain name system (DNS) resolution service.",
                "explanation": "Public DNS services are used as alternatives to ISP's name servers. You may see devices on your network communicating with Google Public DNS over port 53/TCP or 53/UDP to resolve DNS lookups.",
                "found": true,
                "last_updated": "2021-11-24T11:42:37.000Z",
                "name": "Google Public DNS",
                "reference": "https://developers.google.com/speed/public-dns/docs/isp#alternative",
                "trust_level": "1"
            },
            "indicator": {
                "ip": "1.128.0.0"
            },
            "internet_scanner_intelligence": {
                "actor": "unknown",
                "bot": false,
                "classification": "malicious",
                "found": true,
                "last_seen": "2025-04-22T00:00:00.000Z",
                "metadata": {
                    "asn": "AS269415",
                    "category": "isp",
                    "mobile": false,
                    "organization": "CLICKNET FIBRA LTDA",
                    "rdns": "speedtest.clicknetfibra.net.br",
                    "region": "Mato Grosso do Sul",
                    "source_city": "Dourados",
                    "source_country": "Brazil",
                    "source_country_code": "BR"
                },
                "spoofable": true,
                "tor": false,
                "vpn": false
            }
        }
    },
    "input": {
        "type": "cel"
    },
    "observer": {
        "product": "Threat Intelligence",
        "vendor": "GreyNoise"
    },
    "organization": {
        "name": "unknown"
    },
    "related": {
        "ip": [
            "1.128.0.0"
        ]
    },
    "tags": [
        "preserve_original_event",
        "forwarded",
        "greynoise-ip"
    ],
    "threat": {
        "feed": {
            "description": "Threat feed from the GreyNoise cybersecurity platform",
            "name": "GreyNoise IP",
            "reference": "https://docs.greynoise.io/docs/using-greynoise-as-an-indicator-feed"
        },
        "indicator": {
            "as": {
                "number": 269415,
                "organization": {
                    "name": "CLICKNET FIBRA LTDA"
                }
            },
            "description": "1.128.0.0 IP has been observed mass scanning the internet by GreyNoise with a classification of malicious",
            "geo": {
                "city_name": "Dourados",
                "country_iso_code": "BR",
                "country_name": "Brazil",
                "region_name": "Mato Grosso do Sul"
            },
            "ip": "1.128.0.0",
            "name": "1.128.0.0",
            "provider": "GreyNoise",
            "reference": "https://www.greynoise.io/ip/1.128.0.0",
            "type": "ipv4-addr",
            "url": {
                "full": "https://developers.google.com/speed/public-dns/docs/isp#alternative"
            }
        }
    }
}
Exported fields
| Field | Description | Type |
|---|---|---|
| @timestamp | Event timestamp. | date |
| data_stream.dataset | Data stream dataset. | constant_keyword |
| data_stream.namespace | Data stream namespace. | constant_keyword |
| data_stream.type | Data stream type. | constant_keyword |
| event.dataset | Event dataset. | constant_keyword |
| event.module | Event module. | constant_keyword |
| greynoise.ip.business_service_intelligence.category | Business Services category the provider belongs to, identifying the type of service provided. | keyword |
| greynoise.ip.business_service_intelligence.description | A description of the provider and what they do. | keyword |
| greynoise.ip.business_service_intelligence.explanation | An explanation of the category type and what may be expected from this provider and category. | keyword |
| greynoise.ip.business_service_intelligence.found | Indicates if an IP is part of the Business Services dataset or not. | boolean |
| greynoise.ip.business_service_intelligence.last_updated | Date and time when this record was last updated from its source. | date |
| greynoise.ip.business_service_intelligence.name | The name of the provider and/or service. | keyword |
| greynoise.ip.business_service_intelligence.reference | Reference URL for information about this provider and/or service. | keyword |
| greynoise.ip.business_service_intelligence.trust_level | Defines the trust level assigned to this IP/provider. | keyword |
| greynoise.ip.indicator.ip | IP address observed on the GreyNoise sensor network. | ip |
| greynoise.ip.internet_scanner_intelligence.actor | Confirmed owner or operator of the IP address. | keyword |
| greynoise.ip.internet_scanner_intelligence.bot | Indicates whether the IP is associated with known bot activity. | boolean |
| greynoise.ip.internet_scanner_intelligence.classification | Classification of the IP address. Possible values: benign, unknown, malicious, suspicious. | keyword |
| greynoise.ip.internet_scanner_intelligence.found | Indicates if the IP was observed scanning the GreyNoise sensor network. Also referred to as 'noise'. | boolean |
| greynoise.ip.internet_scanner_intelligence.last_seen | Date when the IP was most recently observed on the GreyNoise sensor network (YYYY-MM-DD format). | date |
| greynoise.ip.internet_scanner_intelligence.last_seen_timestamp | Time when the IP was most recently observed on the GreyNoise sensor network. | date |
| greynoise.ip.internet_scanner_intelligence.metadata.asn | ASN (Autonomous System Number) associated with the IP address. | keyword |
| greynoise.ip.internet_scanner_intelligence.metadata.category | Category of the IP address such as hosting or ISP. | keyword |
| greynoise.ip.internet_scanner_intelligence.metadata.mobile | Defines if the IP is part of a known cellular network. | boolean |
| greynoise.ip.internet_scanner_intelligence.metadata.organization | Organization associated with the IP address. | keyword |
| greynoise.ip.internet_scanner_intelligence.metadata.rdns | rDNS (reverse DNS lookup) value for the IP address. | keyword |
| greynoise.ip.internet_scanner_intelligence.metadata.region | Region (state or province) where the IP address is registered or operates. | keyword |
| greynoise.ip.internet_scanner_intelligence.metadata.source_city | City where the IP address is registered or operates. | keyword |
| greynoise.ip.internet_scanner_intelligence.metadata.source_country | Country where the IP address is registered or operates. | keyword |
| greynoise.ip.internet_scanner_intelligence.metadata.source_country_code | Country code of the IP address based on ISO 3166-1 alpha-2. | keyword |
| greynoise.ip.internet_scanner_intelligence.spoofable | Indicates whether the IP completed a three-way handshake with the GreyNoise sensor network. If false, the traffic may be spoofed. | boolean |
| greynoise.ip.internet_scanner_intelligence.tag.names | Tags describing the observed scanning behavior of the IP address. | keyword |
| greynoise.ip.internet_scanner_intelligence.tor | Indicates whether the IP is a known Tor exit node. | boolean |
| greynoise.ip.internet_scanner_intelligence.vpn | Indicates if the IP is associated with a known VPN service. | boolean |
| greynoise.ip.internet_scanner_intelligence.vpn_service | Name of the VPN service associated with the IP (if applicable). | keyword |
| input.type | Type of filebeat input. | keyword |
| labels.is_transform_source | Distinguishes between documents that are a source for a transform and documents that are an output of a transform, to facilitate easier filtering. | constant_keyword |
| log.offset | Log offset. | long |
| threat.enrichments | A list of associated indicators objects enriching the event, and the context of that association/enrichment. | nested |
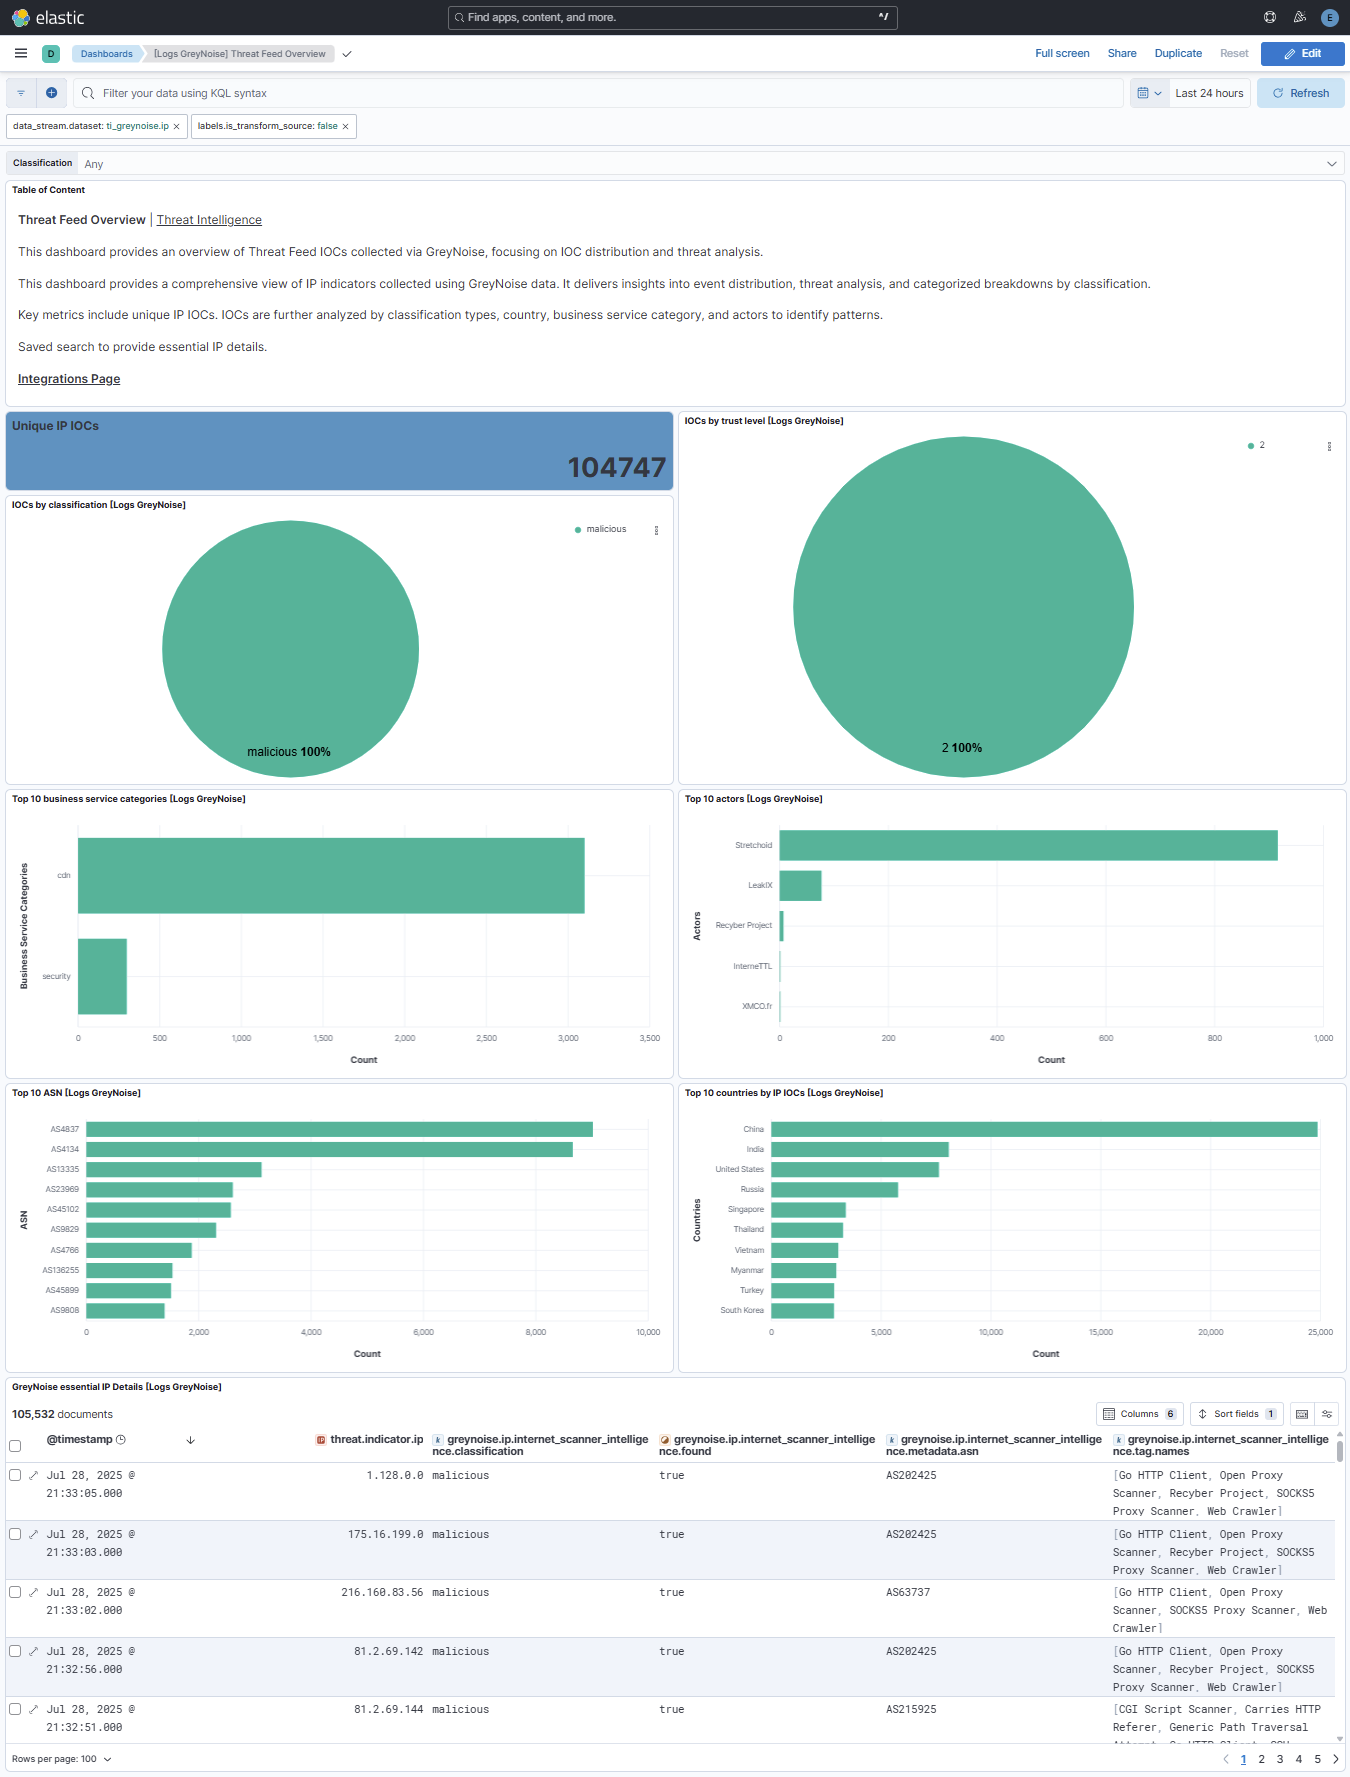
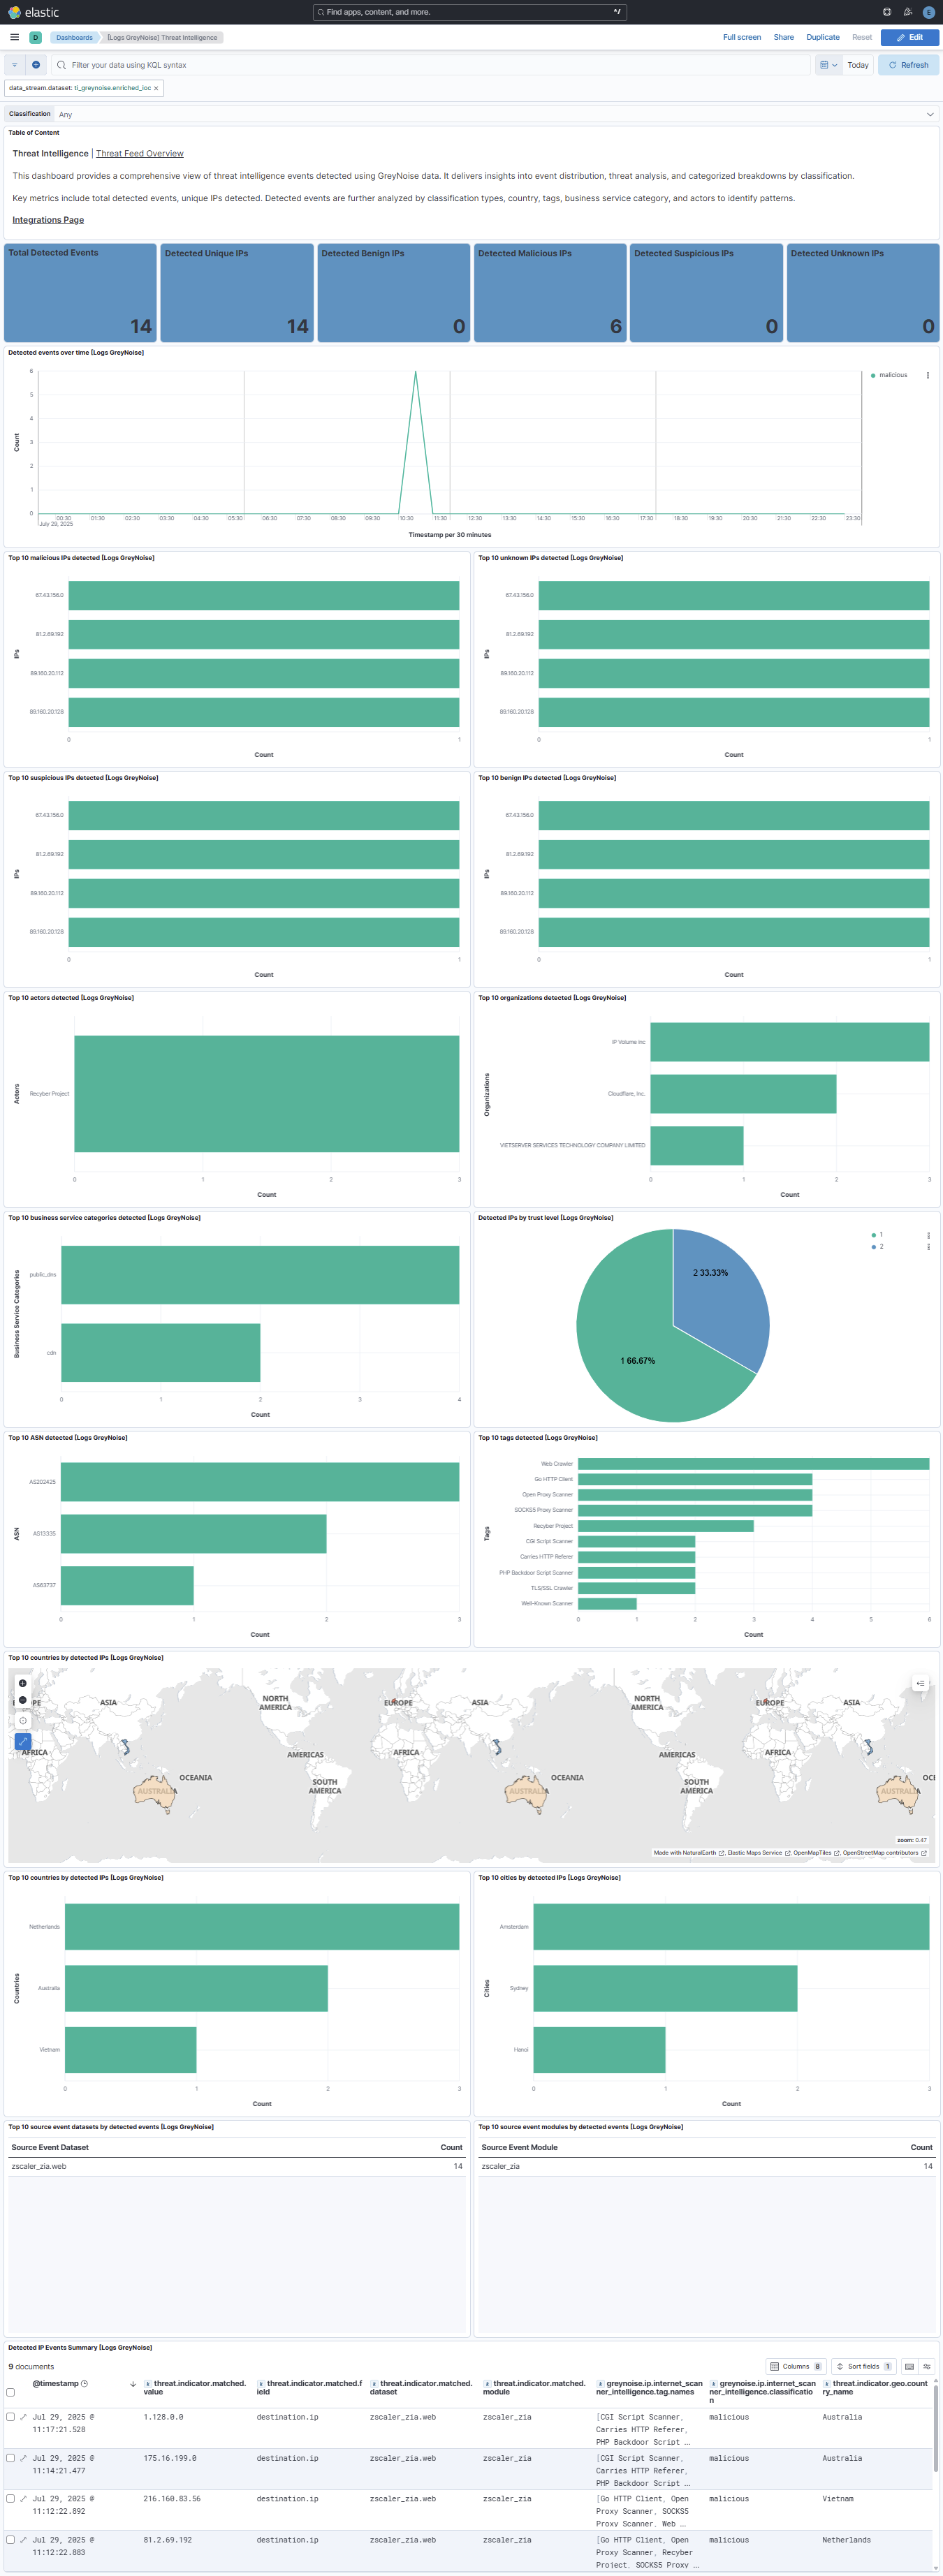
This integration includes one or more Kibana dashboards that visualizes the data collected by the integration. The screenshots below illustrate how the ingested data is displayed.
Changelog
| Version | Details | Minimum Kibana version |
|---|---|---|
| 0.12.0 | Enhancement (View pull request) Update Elastic Managed integration documentation to the current wording and docs links. |
9.1.0 8.19.0 |
| 0.11.1 | Bug fix (View pull request) Statically map event.ingested in transform destination indices so detection rules using it as the timestamp override do not report empty destination indices as missing the field. |
9.1.0 8.19.0 |
| 0.11.0 | Enhancement (View pull request) Remove redundant ECS field definitions and the catch-all dynamic template from the transforms, relying on the ecs@mappings component template. |
9.1.0 8.19.0 |
| 0.10.0 | Enhancement (View pull request) Add tags to ingest pipeline processors and add preserve_original_event to pipeline-level on_failure handlers. |
9.0.0 8.17.0 |
| 0.9.3 | Enhancement (View pull request) Set agentless deployment mode release field to ga. |
9.0.0 8.17.0 |
| 0.9.2 | Bug fix (View pull request) Fix transform destination to use keyword for data_stream.namespace, allowing multi-namespace deployments. |
9.0.0 8.17.0 |
| 0.9.1 | Bug fix (View pull request) Use the ECS definition for threat.enrichments. |
9.0.0 8.17.0 |
| 0.9.0 | Enhancement (View pull request) Use new release field for agentless deployment mode to establish as beta. |
9.0.0 8.17.0 |
| 0.8.1 | Bug fix (View pull request) Change page_size/batch_size variable type from text to integer for Fleet input validation. |
9.0.0 8.17.0 |
| 0.8.0 | Enhancement (View pull request) Use num_failure_retries instead of unattended mode for transform failure recovery. |
9.0.0 8.17.0 |
| 0.7.3 | Bug fix (View pull request) Remove duplicate security-solution-default tag references |
9.0.0 8.17.0 |
| 0.7.2 | Bug fix (View pull request) Remove duplicated field definitions in transform. |
9.0.0 8.17.0 |
| 0.7.1 | Bug fix (View pull request) Downgrade the format_version to the minimum version that supports all the necessary features for the package. |
9.0.0 8.17.0 |
| 0.7.0 | Enhancement (View pull request) Add note on filtering GreyNoise data in detection rules and section on updating the integration in README. |
9.0.0 8.17.0 |
| 0.6.0 | Enhancement (View pull request) Improve documentation |
9.0.0 8.17.0 |
| 0.5.0 | Enhancement (View pull request) Update GNQL endpoint to mitigate timeout. |
9.0.0 8.17.0 |
| 0.4.0 | Enhancement (View pull request) Add Transform Pipeline. |
9.0.0 8.17.0 |
| 0.3.0 | Enhancement (View pull request) Enable Agentless deployment. |
9.0.0 8.17.0 |
| 0.2.0 | Enhancement (View pull request) Use terminate processor instead of fail processor to handle agent errors. |
8.17.0 |
| 0.1.0 | Enhancement (View pull request) GreyNoise integration package with "ip" data stream. |
8.17.0 |