Broadcom ProxySG Integration for Elastic
Elastic Cloud Serverless projects are autoscaled environments, fully managed by Elastic and available on Elastic Cloud. Availability This functionality is in technical preview and is ready for evaluation. Use with caution in production; it is not recommended for mission-critical workloads. Elastic will work to fix any issues, but features in technical preview are not subject to the support SLA of official GA features. Specific Support terms apply. Elastic Cloud Serverless projects are autoscaled environments, fully managed by Elastic and available on Elastic Cloud. Availability This functionality is in technical preview and is ready for evaluation. Use with caution in production; it is not recommended for mission-critical workloads. Elastic will work to fix any issues, but features in technical preview are not subject to the support SLA of official GA features. Specific Support terms apply. The Elastic Stack includes Elastic's core products such as Elasticsearch, Kibana, Logstash, and Beats. Availability This functionality is in technical preview and is ready for evaluation. Use with caution in production; it is not recommended for mission-critical workloads. Elastic will work to fix any issues, but features in technical preview are not subject to the support SLA of official GA features. Specific Support terms apply. Unless stated otherwise on the page, this functionality is available when your Elastic Stack is deployed on Elastic Cloud Hosted, Elastic Cloud Enterprise, Elastic Cloud on Kubernetes, and self-managed environments. This documentation corresponds to the latest patch available for each minor version. If you're not using the latest patch, check the release notes for changes.
Serverless Observability
Preview
Preview
Serverless Security
Preview
Preview
Stack
Preview
9.0+
Preview since 9.0
| Version | 0.8.1 Availability Preview This functionality is in technical preview and is ready for evaluation. Use with caution in production; it is not recommended for mission-critical workloads. Elastic will work to fix any issues, but features in technical preview are not subject to the support SLA of official GA features. Specific Support terms apply. (View all) |
| Subscription level What's this? |
Basic |
| Developed by What's this? |
Elastic |
| Ingestion method(s) | File, Network Protocol |
| Minimum Kibana version(s) | 9.0.0 8.13.0 |
To use pre-release integrations, go to the Integrations page in Kibana, scroll down, and toggle on the Display beta integrations option.
The Broadcom ProxySG integration for Elastic allows you to ingest and analyze web traffic data from your Broadcom ProxySG (formerly Symantec) appliances. By collecting and centralizing these logs, you gain deep visibility into user activity, security threats, and network performance across your infrastructure.
This integration is compatible with Broadcom ProxySG and Edge SWG appliances. It has been specifically tested and documented for ProxySG / Edge SWG version 7.3 and later.
The integration currently supports the following log formats as defined in the appliance configuration:
mainbcreportermain_v1bcreporterssl_v1ssl
This integration is compatible with Elastic Stack version 8.11.0 or later.
This integration collects ProxySG access logs by acting as a receiver for data sent from the appliance or by reading logs from a file. You can deploy an Elastic Agent and configure it to collect data through several methods:
- File collection: Use this method when logs are uploaded from the ProxySG appliance to a central logging server where the Elastic Agent is running.
- TCP: Use this method for reliable real-time log transmissions, ensuring delivery for sensitive security audits.
- UDP: Use this method to capture real-time syslog-style transmissions from the appliance, which is suitable for high-velocity environments, and where possible log message loss is acceptable.
Once the logs are ingested, the integration parses the data into the Elastic Common Schema (ECS), making it ready for analysis in Kibana dashboards or for use with Elastic Security.
This integration collects ProxySG access logs, which contain detailed records of web traffic passing through your ProxySG appliance. These logs include:
- Request and response details: URLs, HTTP methods, status codes, content types, and bytes transferred.
- Client information: Source IP addresses, user identities (when authenticated), and user agent strings.
- Timing data: Request timestamps, response times, and connection durations.
- Security context: SSL/TLS inspection results, certificate details, and threat categories.
- Policy decisions: Actions taken (allowed, denied, or observed), matched policy rules, and URL categories.
- Caching metrics: Cache hit or miss status and origin server response information.
Integrating your Broadcom ProxySG logs with the Elastic Stack provides several benefits for monitoring and securing your network:
- Security monitoring: You can use the logs to detect unauthorized access attempts or suspicious traffic patterns in real time.
- Network traffic analysis: You'll be able to visualize and analyze your network traffic patterns using Kibana dashboards to identify performance issues or optimize resources.
- Compliance and auditing: You can maintain a searchable history of access logs to meet your organization's regulatory requirements for data retention and auditing.
- Incident response: You'll accelerate your investigations by correlating ProxySG data with other security and observability data sources within Elastic.
To use this integration, you need:
- An Elastic Agent installed and enrolled in Fleet on a host that can receive network traffic from your Broadcom ProxySG appliance.
- The required TCP or UDP ports open in the host's local firewall to receive log data, when using the network data collection methods.ß
You'll need the following from your Broadcom ProxySG environment:
- Administrative credentials for the ProxySG Management Console with permissions to modify access logging and upload client settings.
- Network connectivity between the ProxySG appliance and the Elastic Agent host on the configured ports.
- A supported log configuration on the appliance.
- Permission to install or modify policies in the Visual Policy Manager (VPM) to ensure traffic is written to the access log.
- A destination server for FTP, SFTP, or SCP that the Elastic Agent can access locally if you're using the file upload method.
You'll need to install the Elastic Agent on a host that can receive syslog data or access the log files from your Broadcom ProxySG appliance. For detailed instructions, refer to the Elastic Agent installation guide. You can only install one Elastic Agent per host.
You'll use the Elastic Agent to stream data from your syslog or log file receiver and ship it to Elastic. Once there, the integration's ingest pipelines will process your events.
You'll need to configure your ProxySG appliance to send logs to the host where your Elastic Agent is running. You can choose between syslog collection or file upload.
To send logs using syslog, follow these steps:
- Log in to your ProxySG Management Console.
- Navigate to Configuration > Access Logging > Logs > General.
- Select the log object you want to collect and ensure the Log Format is set to a supported format.
- Navigate to Configuration > Access Logging > Logs > Upload Client.
- Select the same log object from the list.
- Change the Client type to
Custom Client. - Click Settings and configure the following:
- Primary Host: Enter the IP address of your Elastic Agent.
- Port: Enter
514for UDP or601for TCP (replace with your actual port if different). - Protocol: Select
UDPorTCPdepending on your transport preference.
- Click OK, then click Apply.
- Navigate to the Upload Schedule tab.
- Select the log object and set the Upload type to
Continuously. - Optionally, set the Wait time before upload to
5seconds for near real-time delivery. - Click Apply.
To upload logs as files, follow these steps:
- Log in to your ProxySG Management Console.
- Navigate to Configuration > Access Logging > Logs > Upload Client.
- Select the log object you want to collect.
- Set the Client type to
FTP Client,SFTP Client, orSCP Clientdepending on your logging server. - Click Settings and enter the destination server details where your Elastic Agent can access the files.
- Under Save the log file as, select
text file. - Navigate to the Upload Schedule tab and set the Upload type to
PeriodicallyorContinuously. - Click Apply.
You'll also need to ensure your policies are configured to log traffic:
- Launch the Visual Policy Manager (VPM) from your ProxySG Console.
- Create or edit a Web Access Layer.
- Locate or create a rule for the traffic you want to monitor.
- Right-click the Action column and select Set > New > Modify Access Logging.
- Select the log object (for example,
main) you configured in the previous steps. - Click OK, then click Install Policy.
For more information, refer to these Broadcom resources:
- Sending Access Logs to a Syslog server - Broadcom Knowledge Base
- Configure access logging on ProxySG to an FTP server - Broadcom Knowledge Base
You'll need to add the integration to an Elastic Agent policy in Kibana.
- In Kibana, navigate to Management > Integrations.
- Search for Broadcom ProxySG and select it.
- Click Add Broadcom ProxySG.
- Configure the integration settings based on the input method that matches your ProxySG setup.
Use this input if your ProxySG uploads files to a server that the Elastic Agent can access.
| Setting | Description |
|---|---|
| Paths | The file pattern matching the location of your log files (for example, /var/log/proxysg-log.log). |
| Preserve original event | If you want to keep a raw copy of the event in the event.original field, toggle this to true. |
| Access Log Format | The log configuration type. Supported formats include main, ssl, bcreportermain_v1, and bcreporterssl_v1. |
Under Advanced options, you'll find these settings:
| Setting | Description |
|---|---|
| Tags | Custom tags to append to your events (for example, proxysg-access-log). |
| Custom Filestream Options | Specify custom configuration for the Filestream input. |
| Processors | Add processors to reduce or enhance your events before they're parsed. |
Use this input if you configured ProxySG to send logs using UDP syslog.
| Setting | Description |
|---|---|
| Listen Address | The bind address to listen for UDP connections. Use 0.0.0.0 to bind to all available interfaces. |
| Listen Port | The UDP port number to listen on (for example, 514). |
| Preserve original event | If you want to keep a raw copy of the event in the event.original field, toggle this to true. |
| Access Log Format | The log configuration type. Supported formats include main, ssl, bcreportermain_v1, and bcreporterssl_v1. |
Under Advanced options, you'll find these settings:
| Setting | Description |
|---|---|
| Tags | Custom tags to append to your events. |
| Custom UDP Options | Specify custom configuration like read_buffer or max_message_size. |
| Processors | Add processors to execute in the agent before logs are parsed. |
Use this input if you configured ProxySG to send logs using TCP syslog.
| Setting | Description |
|---|---|
| Listen Address | The bind address to listen for TCP connections. Use 0.0.0.0 to bind to all available interfaces. |
| Listen Port | The TCP port number to listen on (for example, 601). |
| Preserve original event | If you want to keep a raw copy of the event in the event.original field, toggle this to true. |
| Access Log Format | The log configuration type. Supported formats include main, ssl, bcreportermain_v1, and bcreporterssl_v1. |
Under Advanced options, you'll find these settings:
| Setting | Description |
|---|---|
| Tags | Custom tags to append to your events. |
| Custom TCP Options | Specify custom configuration for the TCP input. |
| SSL Configuration | Configure encrypted transmission using certificate and key paths. |
| Processors | Add processors to execute in the agent before logs are parsed. |
After you've finished configuring your input, click Save and continue to add the integration to your agent policy.
You'll want to verify that your data is flowing correctly from the ProxySG appliance to Elasticsearch.
You can generate logs by performing these actions:
- Generate Web Traffic: Browse several public websites from a workstation using the ProxySG as a gateway.
- Trigger Policy Events: Try to access a URL category that's restricted by your policy to generate "denied" or "blocked" entries.
- Force Log Upload: In the Management Console, navigate to Access Logging > Logs > [Your Log] > Upload Now and click the button to manually trigger a log push.
You can verify the incoming data by following these steps:
- Navigate to Analytics > Discover.
- Select the
logs-*data view. - Enter the KQL filter:
data_stream.dataset : "proxysg.log" - Confirm that logs appear and verify that fields like
event.dataset,source.ip, andmessageare correctly populated. - Navigate to Analytics > Dashboards and search for "ProxySG" to see if the pre-built dashboards are showing your data.
For help with Elastic ingest tools, check Common problems.
If you encounter issues with the Broadcom ProxySG integration, review these common problems and solutions:
- Log format mismatch: Ensure the ProxySG appliance is explicitly using a format supported by the integration. If a custom format is defined on the appliance, the Elastic Agent will fail to parse the fields correctly. Check the settings in Configuration > Access Logging > Logs > General.
- Upload schedule delay: If data appears delayed, check the Upload Schedule on the ProxySG. Ensure it's set to
Continuouslyrather thanPeriodicallyorOn-Demand. - Custom client port conflict: If you're using the syslog method, ensure no other service on the Elastic Agent host is using the configured TCP or UDP port. You can use
netstat -anoorss -tulnto verify port availability. - VPM policy not applied: If no logs are appearing, verify that the Modify Access Logging action is correctly applied to the relevant rules in the Visual Policy Manager and that the policy has been successfully installed.
- Parsing failures: If logs appear in Kibana but contain a
_grokparsefailureor_jsonparseerrortag, verify that the raw message in theevent.originalfield matches the expected structure of the configured ProxySG format. - Timezone mismatch: If logs appear to be delayed or from the future, check that the ProxySG appliance and the Elastic Agent host are synchronized using NTP and that timezone offsets are correctly handled in the integration settings.
For more information on architectures that can be used for scaling this integration, check the Ingest Architectures documentation.
To ensure optimal performance in high-volume environments, consider the following:
- Transport and collection: For real-time requirements, TCP is the recommended transport protocol to ensure delivery reliability using the
ProxySG logs (via TCP)input. You can use UDP for high-velocity environments where occasional packet loss is acceptable for reduced overhead. When you use theProxySG Access logs(filestream) method, make sure the disk I/O on the logging server can handle the write and read operations of the incoming log files. - Data volume management: In high-traffic environments, you should use the ProxySG's Web Access Policy to filter out unnecessary logs—such as specific health checks or trusted internal traffic—at the source before you send them to the Elastic Agent. This significantly reduces the processing load on both the appliance and the Elastic Stack ingest pipelines.
- Elastic Agent scaling: If you're working in high-throughput environments exceeding 10,000 events per second, deploy multiple Elastic Agents behind a network load balancer to distribute the Syslog (TCP/UDP) ingestion load. Make sure the host machine for the Agent has enough CPU resources to handle the concurrent parsing of the ProxySG logs across multiple data streams.
This reference section provides technical details about the inputs and data streams used by this integration.
These inputs can be used with this integration:
filestream
For more details about the Filestream input settings, check the Filebeat documentation.
To collect logs via Filestream, select Collect logs via Filestream and configure the following parameters:
- Filestream paths: The full path to the related log file.
tcp
For more details about the TCP input settings, check the Filebeat documentation.
To collect logs via TCP, select Collect logs via TCP and configure the following parameters:
Required Settings:
- Host
- Port
Common Optional Settings:
- Max Message Size - Maximum size of incoming messages
- Max Connections - Maximum number of concurrent connections
- Timeout - How long to wait for data before closing idle connections
- Line Delimiter - Character(s) that separate log messages
To enable encrypted connections, configure the following SSL settings:
SSL Settings:
- Enable SSL - Toggle to enable SSL/TLS encryption
- Certificate - Path to the SSL certificate file (
.crtor.pem) - Certificate Key - Path to the private key file (
.key) - Certificate Authorities - Path to CA certificate file for client certificate validation (optional)
- Client Authentication - Require client certificates (
none,optional, orrequired) - Supported Protocols - TLS versions to support (e.g.,
TLSv1.2,TLSv1.3)
Example SSL Configuration:
ssl.enabled: true
ssl.certificate: "/path/to/server.crt"
ssl.key: "/path/to/server.key"
ssl.certificate_authorities: ["/path/to/ca.crt"]
ssl.client_authentication: "optional"
udp
For more details about the UDP input settings, check the Filebeat documentation.
To collect logs via UDP, select Collect logs via UDP and configure the following parameters:
Required Settings:
- Host
- Port
Common Optional Settings:
- Max Message Size - Maximum size of UDP packets to accept (default: 10KB, max: 64KB)
- Read Buffer - UDP socket read buffer size for handling bursts of messages
- Read Timeout - How long to wait for incoming packets before checking for shutdown
The following resources provide additional information about Broadcom ProxySG log formats and configuration:
- Sending Access Logs to a Syslog server - Broadcom Knowledge Base
- Configure access logging on ProxySG to an FTP server - Broadcom Knowledge Base
- Broadcom ProxySG Log Formats Documentation
The Broadcom ProxySG integration collects the following data stream:
The log data stream provides events from Broadcom ProxySG of the following types: access logs, SSL session logs, and security policy events. It supports logs in the main, ssl, bcreportermain_v1, and bcreporterssl_v1 formats.
Exported fields
| Field | Description | Type |
|---|---|---|
| @timestamp | Event timestamp. | date |
| client.bytes | Count of bytes sent by the client. | long |
| data_stream.dataset | Data stream dataset. | constant_keyword |
| data_stream.namespace | Data stream namespace. | constant_keyword |
| data_stream.type | Data stream type. | constant_keyword |
| input.type | Type of input. | keyword |
| log.file.device_id | Log file device ID. | keyword |
| log.file.inode | Log file inode. | keyword |
| log.offset | Log offset. | long |
| log.source.address | Source address for the log. | keyword |
| proxysg.client.ip | keyword | |
| proxysg.client_to_server.auth_group | keyword | |
| proxysg.client_to_server.auth_groups | keyword | |
| proxysg.client_to_server.bytes | keyword | |
| proxysg.client_to_server.categories | keyword | |
| proxysg.client_to_server.certificate_subject | keyword | |
| proxysg.client_to_server.connection_negotiated_cipher | keyword | |
| proxysg.client_to_server.connection_negotiated_cipher_size | keyword | |
| proxysg.client_to_server.connection_negotiated_ssl_version | keyword | |
| proxysg.client_to_server.host | keyword | |
| proxysg.client_to_server.icap_error_details | keyword | |
| proxysg.client_to_server.icap_status | keyword | |
| proxysg.client_to_server.method | keyword | |
| proxysg.client_to_server.ocsp_error | keyword | |
| proxysg.client_to_server.referer | keyword | |
| proxysg.client_to_server.rs_content_type | keyword | |
| proxysg.client_to_server.threat_id | keyword | |
| proxysg.client_to_server.threat_risk | keyword | |
| proxysg.client_to_server.threat_source | keyword | |
| proxysg.client_to_server.uri_extension | keyword | |
| proxysg.client_to_server.uri_path | keyword | |
| proxysg.client_to_server.uri_port | long | |
| proxysg.client_to_server.uri_query | keyword | |
| proxysg.client_to_server.uri_scheme | keyword | |
| proxysg.client_to_server.user_agent | keyword | |
| proxysg.client_to_server.userdn | keyword | |
| proxysg.client_to_server.username | keyword | |
| proxysg.client_to_server.x_requested_with | keyword | |
| proxysg.remote.ip | keyword | |
| proxysg.remote.supplier_country | keyword | |
| proxysg.remote_to_server.certificate_hostection_negotname | keyword | |
| proxysg.remote_to_server.certificate_hostection_negotnamecategory | keyword | |
| proxysg.remote_to_server.certificate_hostname | keyword | |
| proxysg.remote_to_server.certificate_hostname_category | keyword | |
| proxysg.remote_to_server.certificate_hostname_threat_risk | keyword | |
| proxysg.remote_to_server.certificate_observed_errors | keyword | |
| proxysg.remote_to_server.certificate_validate_status | keyword | |
| proxysg.remote_to_server.connection_negotiated_cipher | keyword | |
| proxysg.remote_to_server.connection_negotiated_cipher_size | keyword | |
| proxysg.remote_to_server.connection_negotiated_cipher_strength | keyword | |
| proxysg.remote_to_server.connection_negotiated_ssl_version | keyword | |
| proxysg.remote_to_server.content_type | keyword | |
| proxysg.remote_to_server.icap_error_details | keyword | |
| proxysg.remote_to_server.icap_status | keyword | |
| proxysg.remote_to_server.ocsp_error | keyword | |
| proxysg.remote_to_server.threat_id | keyword | |
| proxysg.remote_to_server.threat_source | keyword | |
| proxysg.server.action | keyword | |
| proxysg.server.hierarchy | keyword | |
| proxysg.server.ip | keyword | |
| proxysg.server.sitename | keyword | |
| proxysg.server.supplier_country | keyword | |
| proxysg.server.supplier_failures | keyword | |
| proxysg.server.supplier_ip | keyword | |
| proxysg.server.supplier_name | keyword | |
| proxysg.server_to_client.bytes | keyword | |
| proxysg.server_to_client.filter_result | keyword | |
| proxysg.server_to_client.status | keyword | |
| proxysg.time_taken | long | |
| proxysg.x_bluecoat.access_security_policy_action | keyword | |
| proxysg.x_bluecoat.access_security_policy_reason | keyword | |
| proxysg.x_bluecoat.access_type | keyword | |
| proxysg.x_bluecoat.appliance_name | keyword | |
| proxysg.x_bluecoat.application_groups | keyword | |
| proxysg.x_bluecoat.application_name | keyword | |
| proxysg.x_bluecoat.application_operation | keyword | |
| proxysg.x_bluecoat.location_id | keyword | |
| proxysg.x_bluecoat.location_name | keyword | |
| proxysg.x_bluecoat.placeholder | keyword | |
| proxysg.x_bluecoat.reference_id | keyword | |
| proxysg.x_bluecoat.request_tenant_id | keyword | |
| proxysg.x_bluecoat.transaction_uuid | keyword | |
| proxysg.x_client_agent_sw | keyword | |
| proxysg.x_client_agent_type | keyword | |
| proxysg.x_client_device_id | keyword | |
| proxysg.x_client_device_name | keyword | |
| proxysg.x_client_device_type | keyword | |
| proxysg.x_client_os | keyword | |
| proxysg.x_client_security_posture_details | keyword | |
| proxysg.x_client_security_posture_risk_score | keyword | |
| proxysg.x_cloud_rs | keyword | |
| proxysg.x_cs_certificate_subject | keyword | |
| proxysg.x_cs_client_ip_country | keyword | |
| proxysg.x_cs_connection_negotiated_cipher | keyword | |
| proxysg.x_cs_connection_negotiated_cipher_size | keyword | |
| proxysg.x_cs_connection_negotiated_ssl_version | keyword | |
| proxysg.x_cs_ocsp_error | keyword | |
| proxysg.x_data_leak_detected | keyword | |
| proxysg.x_exception_id | keyword | |
| proxysg.x_icap_reqmod_header_x_icap_metadata | keyword | |
| proxysg.x_icap_respmod_header_x_icap_metadata | keyword | |
| proxysg.x_random_ipv6 | keyword | |
| proxysg.x_rs_certificate_hostname | keyword | |
| proxysg.x_rs_certificate_hostname_categories | keyword | |
| proxysg.x_rs_certificate_hostname_threat_risk | keyword | |
| proxysg.x_rs_certificate_observed_errors | keyword | |
| proxysg.x_rs_certificate_signature_algorithm | keyword | |
| proxysg.x_rs_certificate_validate_status | keyword | |
| proxysg.x_rs_connection_negotiated_cipher | keyword | |
| proxysg.x_rs_connection_negotiated_cipher_size | keyword | |
| proxysg.x_rs_connection_negotiated_ssl_version | keyword | |
| proxysg.x_rs_ocsp_error | keyword | |
| proxysg.x_sc_connection_issuer_keyring | keyword | |
| proxysg.x_sc_connection_issuer_keyring_alias | keyword | |
| proxysg.x_virus_id | keyword | |
| server.bytes | Count of bytes sent by the server. | long |
Example
{
    "@timestamp": "2024-03-22T16:16:01Z",
    "agent": {
        "ephemeral_id": "c62f5fcb-3497-49a3-988a-a076cc2b9dd6",
        "id": "d4460588-94a9-4ddb-8a40-c80a3b7db55a",
        "name": "docker-fleet-agent",
        "type": "filebeat",
        "version": "8.14.1"
    },
    "client": {
        "bytes": 969,
        "ip": "10.82.255.36",
        "user": {
            "name": "aeinstein"
        }
    },
    "data_stream": {
        "dataset": "proxysg.log",
        "namespace": "55535",
        "type": "logs"
    },
    "ecs": {
        "version": "8.17.0"
    },
    "elastic_agent": {
        "id": "d4460588-94a9-4ddb-8a40-c80a3b7db55a",
        "snapshot": false,
        "version": "8.14.1"
    },
    "event": {
        "agent_id_status": "verified",
        "dataset": "proxysg.log",
        "duration": 48000000,
        "ingested": "2024-09-12T22:16:57Z",
        "original": "2024-03-22 16:16:01 48 10.82.255.36 302 TCP_NC_MISS 1242 969 GET https pixel.tapad.com 443 /idsync/ex/push ?partner_id=2499&partner_device_id=aeb66687-eabe-442e-b11e-79494b740d0d-640ba437-5553&partner_url=https%3A%2F%2Fa.vidoomy.com%2Fapi%2Frtbserver%2Fpbscookie%3Fuid%3Daeb66687-eabe-442e-b11e-79494b740d0d-640ba437-5553%26vid%3D280fa751e99651c4193ef92f6dab0f92%26dspid%3DCEN aeinstein - - pixel.tapad.com - https://vid.vidoomy.com/ OBSERVED \"FastwebRes_CallCntr;Web Ads/Analytics\" - 142.182.19.21 34.111.113.62 \"Mozilla/5.0 (Windows NT 10.0; Win64; x64) AppleWebKit/537.36 (KHTML, like Gecko) Chrome/122.0.0.0 Safari/537.36\" sha256WithRSAEncryption",
        "timezone": "+00:00"
    },
    "http": {
        "request": {
            "method": "GET",
            "referrer": "-"
        },
        "response": {
            "status_code": 302
        }
    },
    "input": {
        "type": "udp"
    },
    "log": {
        "source": {
            "address": "172.19.0.6:47495"
        },
        "syslog": {
            "appname": "serverd",
            "facility": {
                "code": 1,
                "name": "user-level"
            },
            "hostname": "srvr",
            "priority": 13,
            "severity": {
                "code": 5,
                "name": "Notice"
            },
            "version": "1"
        }
    },
    "observer": {
        "product": "ProxySG",
        "vendor": "Broadcom"
    },
    "proxysg": {
        "client": {
            "ip": "10.82.255.36"
        },
        "client_to_server": {
            "auth_group": "-",
            "bytes": "969",
            "categories": "FastwebRes_CallCntr;Web Ads/Analytics",
            "host": "pixel.tapad.com",
            "method": "GET",
            "referer": "-",
            "uri_path": "/idsync/ex/push",
            "uri_port": 443,
            "uri_query": "?partner_id=2499&partner_device_id=aeb66687-eabe-442e-b11e-79494b740d0d-640ba437-5553&partner_url=https%3A%2F%2Fa.vidoomy.com%2Fapi%2Frtbserver%2Fpbscookie%3Fuid%3Daeb66687-eabe-442e-b11e-79494b740d0d-640ba437-5553%26vid%3D280fa751e99651c4193ef92f6dab0f92%26dspid%3DCEN",
            "uri_scheme": "https",
            "user_agent": "https://vid.vidoomy.com/",
            "username": "aeinstein"
        },
        "remote_to_server": {
            "content_type": "pixel.tapad.com"
        },
        "server": {
            "action": "TCP_NC_MISS",
            "ip": "142.182.19.21",
            "supplier_name": "-"
        },
        "server_to_client": {
            "bytes": "1242",
            "filter_result": "OBSERVED",
            "status": "302"
        },
        "time_taken": 48,
        "x_virus_id": "-"
    },
    "server": {
        "bytes": 1242,
        "ip": "142.182.19.21"
    },
    "tags": [
        "preserve_original_event",
        "forwarded"
    ],
    "url": {
        "domain": "pixel.tapad.com",
        "path": "/idsync/ex/push",
        "port": 443,
        "query": "?partner_id=2499&partner_device_id=aeb66687-eabe-442e-b11e-79494b740d0d-640ba437-5553&partner_url=https%3A%2F%2Fa.vidoomy.com%2Fapi%2Frtbserver%2Fpbscookie%3Fuid%3Daeb66687-eabe-442e-b11e-79494b740d0d-640ba437-5553%26vid%3D280fa751e99651c4193ef92f6dab0f92%26dspid%3DCEN",
        "registered_domain": "tapad.com",
        "scheme": "https",
        "subdomain": "pixel",
        "top_level_domain": "com"
    },
    "user_agent": {
        "device": {
            "name": "Generic Feature Phone"
        },
        "name": "Other",
        "original": "https://vid.vidoomy.com/"
    }
}
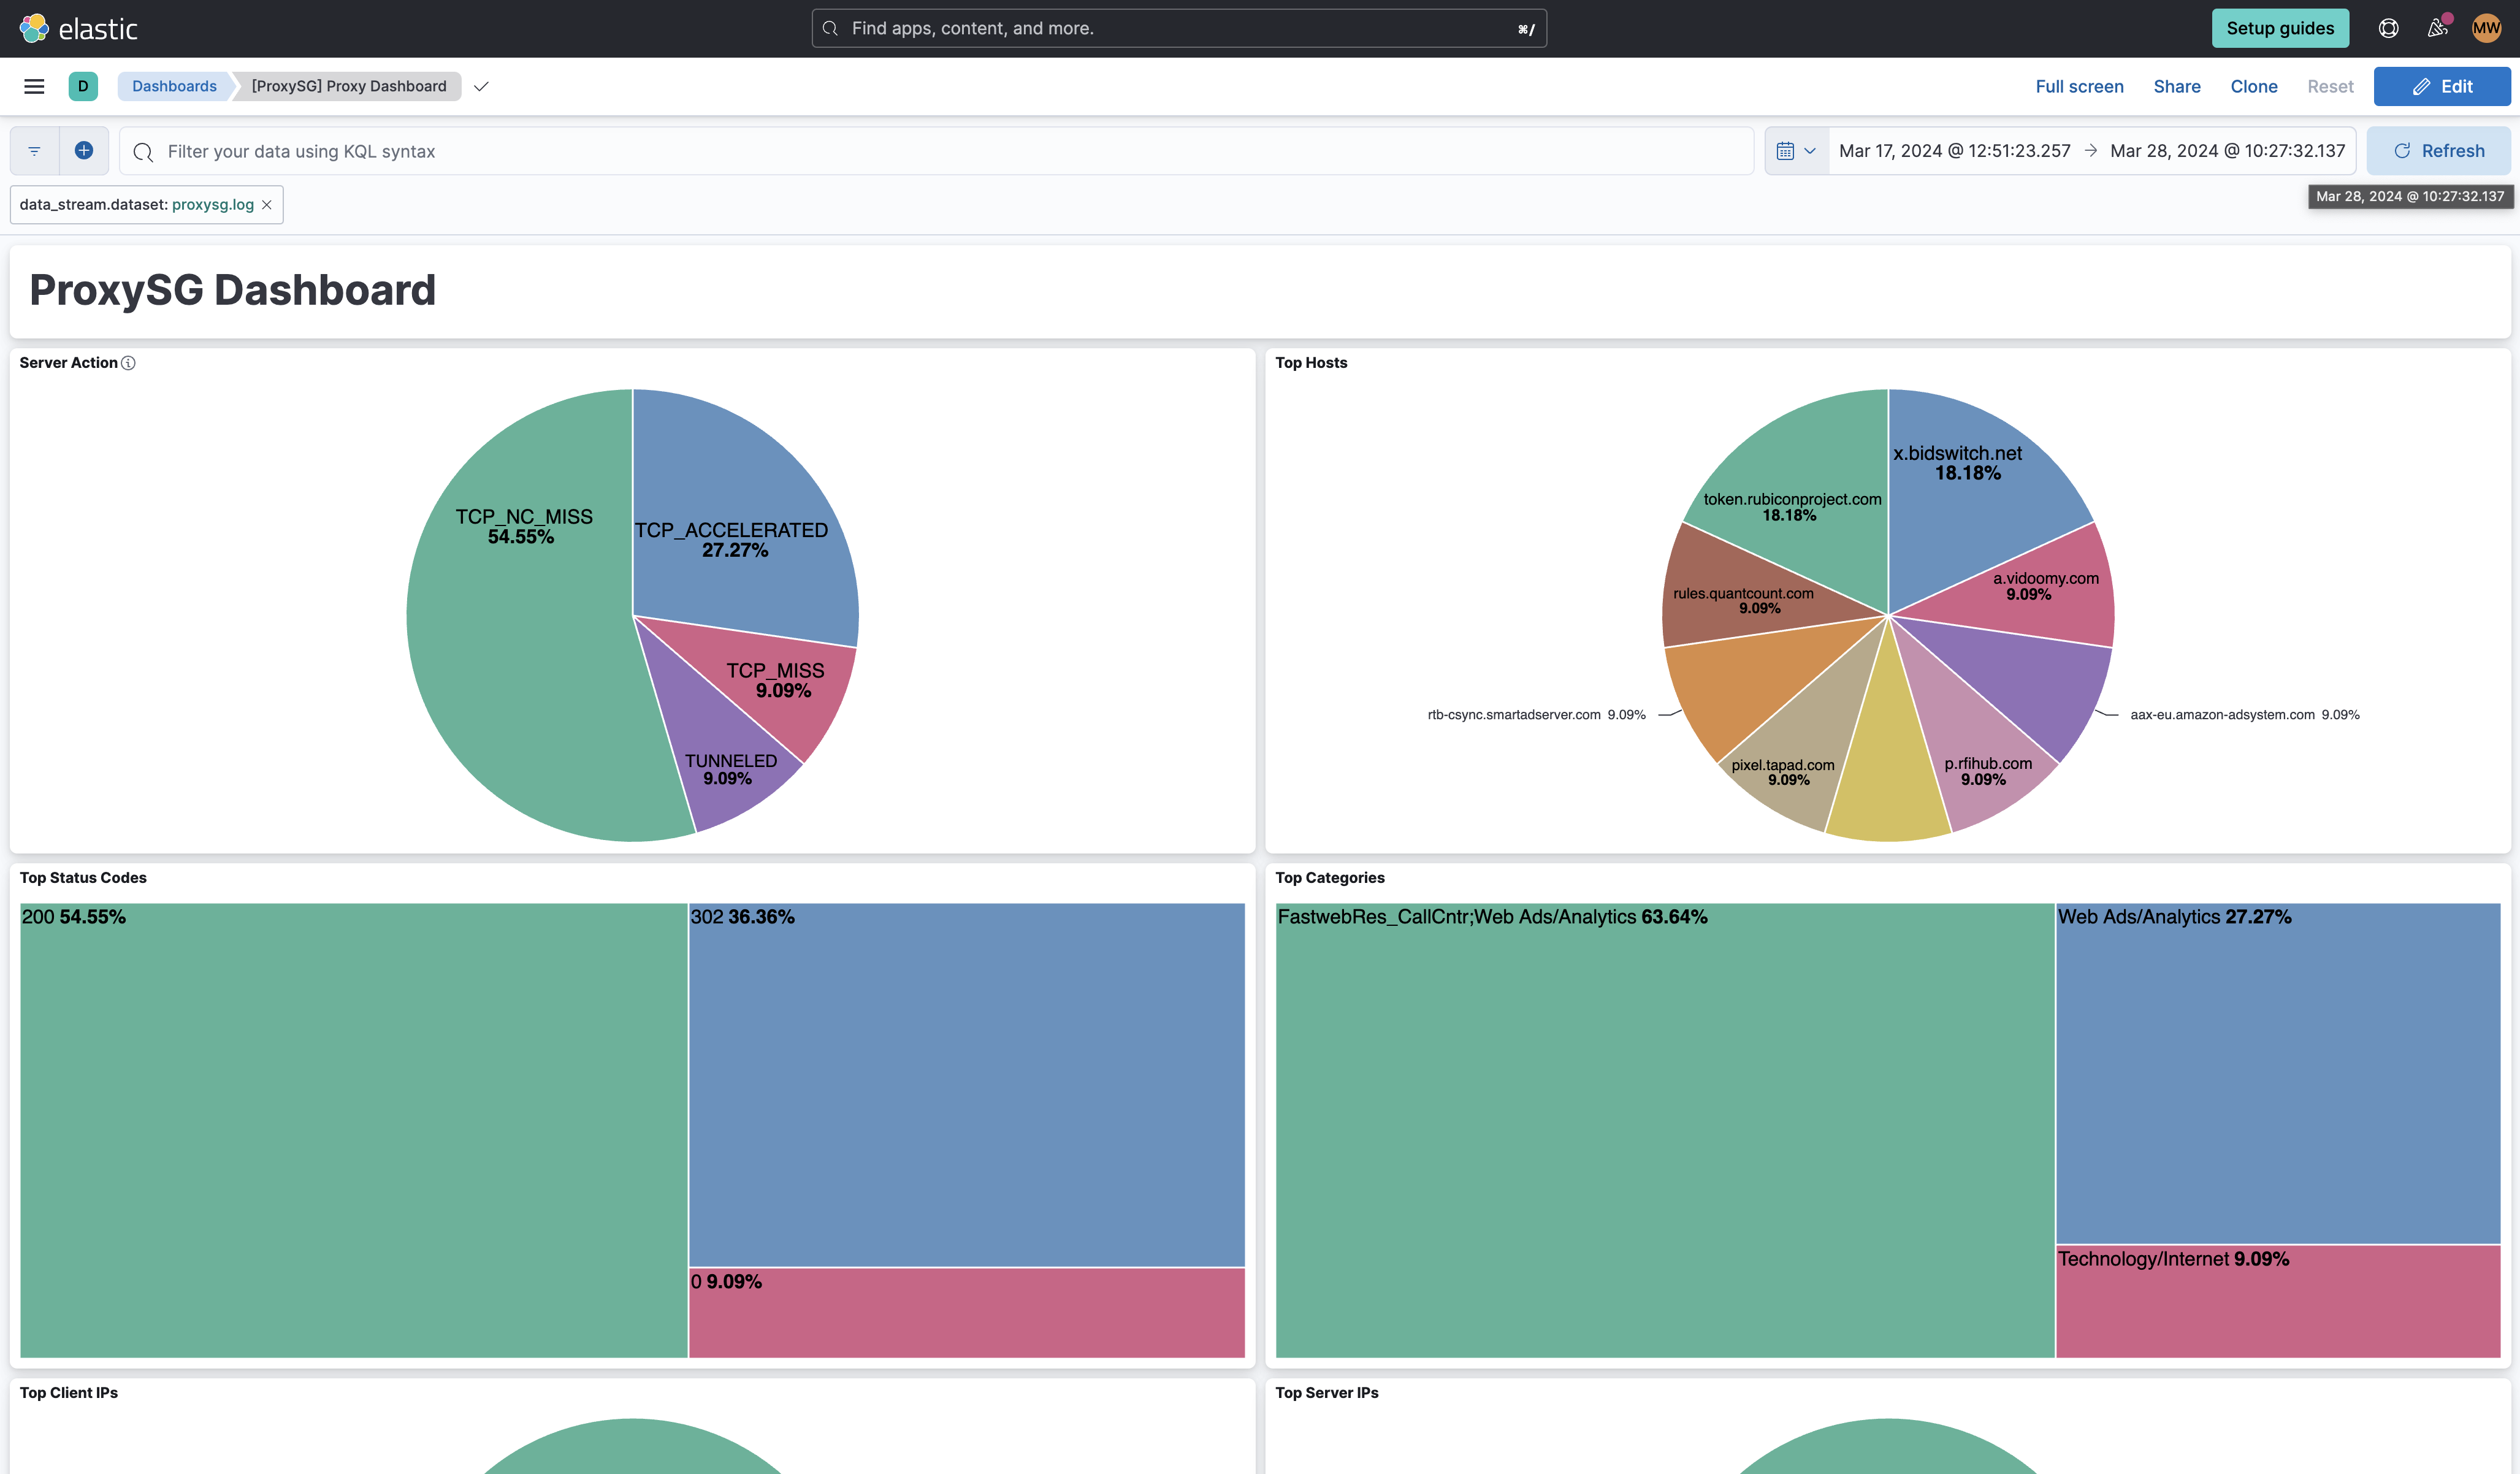
This integration includes one or more Kibana dashboards that visualizes the data collected by the integration. The screenshots below illustrate how the ingested data is displayed.
Changelog
| Version | Details | Minimum Kibana version |
|---|---|---|
| 0.8.1 | Bug fix (View pull request) Remove top level note from docs |
9.0.0 8.13.0 |
| 0.8.0 | Enhancement (View pull request) Update integration documentation. |
9.0.0 8.13.0 |
| 0.7.0 | Enhancement (View pull request) Preserve event.original on pipeline error. |
9.0.0 8.13.0 |
| 0.6.3 | Enhancement (View pull request) Generate processor tags and normalize error handler. |
9.0.0 8.13.0 |
| 0.6.2 | Bug fix (View pull request) Updated the ECS field mapping. |
9.0.0 8.13.0 |
| 0.6.1 | Enhancement (View pull request) Changed owners. |
9.0.0 8.13.0 |
| 0.6.0 | Enhancement (View pull request) Support stack version 9.0. |
9.0.0 8.13.0 |
| 0.5.1 | Bug fix (View pull request) Updated SSL description to be uniform and to include links to documentation. |
8.13.0 |
| 0.5.0 | Enhancement (View pull request) ECS version updated to 8.17.0. |
8.13.0 |
| 0.4.0 | Enhancement (View pull request) Add configuration for custom filestream options. Ensure filestream fingerprint is disabled in system test. |
8.13.0 |
| 0.3.1 | Bug fix (View pull request) Add format config to all inputs |
8.13.0 |
| 0.3.0 | Enhancement (View pull request) Do not do syslog parsing by default in TCP and UCP inputs |
8.13.0 |
| 0.2.0 | Enhancement (View pull request) Add support for 'bcreportermain_v1', 'bcreporterssl_v1' and 'ssl' formats |
8.13.0 |
| 0.1.0 | Enhancement (View pull request) Initial creation of the integration. |
8.13.0 |