IIS (Internet Information Services) integration
Elastic Cloud Serverless projects are autoscaled environments, fully managed by Elastic and available on Elastic Cloud. Availability This functionality is generally available and ready for production usage. Elastic Cloud Serverless projects are autoscaled environments, fully managed by Elastic and available on Elastic Cloud. Availability This functionality is generally available and ready for production usage. The Elastic Stack includes Elastic's core products such as Elasticsearch, Kibana, Logstash, and Beats. Availability This functionality is generally available and ready for production usage. Unless stated otherwise on the page, this functionality is available when your Elastic Stack is deployed on Elastic Cloud Hosted, Elastic Cloud Enterprise, Elastic Cloud on Kubernetes, and self-managed environments. This documentation corresponds to the latest patch available for each minor version. If you're not using the latest patch, check the release notes for changes.
Serverless Observability
Generally available
Serverless Security
Generally available
Stack
9.0+
Generally available since 9.0
| Version | 1.24.9 (View all) |
| Subscription level What's this? |
Basic |
| Developed by What's this? |
Elastic |
| Ingestion method(s) | File, Windows Performance Counters |
| Minimum Kibana version(s) | 9.0.0 8.13.0 |
The IIS (Internet Information Services) integration allows you to monitor your IIS Web servers. IIS is a secure, reliable, and scalable Web server that provides an easy to manage platform for developing and hosting Web applications and services.
Use the IIS integration to collect data. Then visualize that data in Kibana, create alerts to notify you if something goes wrong, and reference metrics and logs when troubleshooting an issue.
For example, you could:
- Use IIS System/Process counters like the overall server and CPU usage for the IIS Worker Process and memory to understand how much memory is currently being used and how much is available.
- Use IIS performance counters like Web Service: Bytes Received/Sec and Web Service: Bytes Sent/Sec to track to identify potential spikes in traffic.
- Use IIS Web Service Cache counters to monitor user mode cache and output cache.
The IIS integration collects two types of data streams: logs and metrics.
Logs help you keep a record of events happening on your IIS Web servers.
Log data streams collected by the IIS integration include access and error.
Find more details in Logs.
Metrics give you insight into the state of your IIS Web servers.
Metric data streams collected by the IIS integration include webserver, website, and application_pool.
Find more details in Metrics.
You need Elasticsearch for storing and searching your data and Kibana for visualizing and managing it. You can use our hosted Elasticsearch Service on Elastic Cloud, which is recommended, or self-manage the Elastic Stack on your hardware.
For step-by-step instructions on how to set up an integration, see the Getting started guide.
For more information on configuring IIS logging, refer to the Microsoft documentation.
The IIS module has been tested with logs from version 7.5, 8 and version 10.
This data stream will collect and parse access IIS logs. The supported log format is W3C. The W3C log format is customizable with different fields.
The IIS ships logs with few fields by default and if the user is interested in customizing the selection, the IIS Manager provides ability to add new fields for logging.
IIS integration automatically ships certain field combinations into Elasticsearch using ingest pipelines. Please ensure that the IIS log format configuration matches one of the formats below:
- Fields: date time s-ip cs-method cs-uri-stem cs-uri-query s-port cs-username c-ip cs(User-Agent) cs(Referer) sc-status sc-substatus sc-win32-status time-taken
- Fields: date time s-sitename cs-method cs-uri-stem cs-uri-query s-port cs-username c-ip cs(User-Agent) cs(cookie) cs(Referer) cs-host sc-status sc-substatus sc-win32-status time-taken

- Fields: date time s-sitename s-ip cs-method cs-uri-stem cs-uri-query s-port cs-username c-ip cs-version cs(User-Agent) cs(cookie) cs(Referer) sc-status sc-substatus sc-win32-status sc-bytes, cs-bytes time-taken

- Fields: date time s-sitename s-computername s-ip cs-method cs-uri-stem cs-uri-query s-port cs-username c-ip cs-version cs(User-Agent) cs(cookie) cs(Referer) cs-host sc-status sc-substatus sc-win32-status sc-bytes, cs-bytes time-taken

- Fields: date time s-ip cs-method cs-uri-stem cs-uri-query s-port cs-username c-ip cs(User-Agent) sc-status sc-substatus sc-win32-status time-taken

- Fields: date time s-ip cs-method cs-uri-stem cs-uri-query s-port cs-username c-ip cs(User-Agent) sc-status sc-substatus sc-win32-status sc-bytes, cs-bytes time-taken

- Fields: date time s-ip cs-method cs-uri-stem cs-uri-query s-port cs-username c-ip cs(User-Agent) cs(cookie) cs(Referer) sc-status sc-substatus sc-win32-status sc-bytes, cs-bytes time-taken

- Fields: date time s-computername s-ip cs-method cs-uri-stem cs-uri-query s-port cs-username c-ip cs(User-Agent) sc-status sc-substatus sc-win32-status sc-bytes, cs-bytes time-taken
X-Forwarded-For is an optional field which can be added with the above log formats.
If the provided log format doesn't match with any of the above formats, then create a custom ingest pipeline processor in Kibana to process the logs.
Example
{
    "@timestamp": "2018-11-19T15:24:54.000Z",
    "agent": {
        "ephemeral_id": "3f65b650-b6a3-4694-83b3-0c324a60809d",
        "id": "db17f9fb-5bcb-4116-a009-79a1bb7d4820",
        "name": "DESKTOP-RFOOE09",
        "type": "filebeat",
        "version": "8.0.0"
    },
    "destination": {
        "address": "127.0.0.1",
        "ip": "127.0.0.1",
        "port": 80
    },
    "ecs": {
        "version": "8.11.0"
    },
    "event": {
        "category": [
            "web",
            "network"
        ],
        "created": "2020-07-08T11:40:14.112Z",
        "duration": 725000000,
        "kind": "event",
        "outcome": "failure",
        "type": [
            "connection"
        ]
    },
    "http": {
        "request": {
            "method": "GET"
        },
        "response": {
            "status_code": 401
        }
    },
    "iis": {
        "access": {
            "sub_status": 3,
            "win32_status": 5
        }
    },
    "related": {
        "ip": [
            "127.0.0.1",
            "127.0.0.1"
        ]
    },
    "source": {
        "address": "127.0.0.1",
        "ip": "127.0.0.1"
    },
    "temp": {},
    "url": {
        "path": "/"
    },
    "user_agent": {
        "device": {
            "name": "Other"
        },
        "name": "Chrome",
        "original": "Mozilla/5.0 (Windows NT 10.0; Win64; x64) AppleWebKit/537.36 (KHTML, like Gecko) Chrome/70.0.3538.102 Safari/537.36",
        "os": {
            "full": "Windows 10",
            "name": "Windows",
            "version": "10"
        },
        "version": "70.0.3538.102"
    }
}
The fields reported are:
ECS Field Reference
Please refer to the following document for detailed information on ECS fields.
Exported fields
| Field | Description | Type |
|---|---|---|
| @timestamp | Event timestamp. | date |
| cloud.image.id | Image ID for the cloud instance. | keyword |
| data_stream.dataset | Data stream dataset. | constant_keyword |
| data_stream.namespace | Data stream namespace. | constant_keyword |
| data_stream.type | Data stream type. | constant_keyword |
| event.dataset | Event dataset | constant_keyword |
| event.module | Event module | constant_keyword |
| host.containerized | If the host is a container. | boolean |
| host.os.build | OS build information. | keyword |
| host.os.codename | OS codename, if any. | keyword |
| iis.access.cookie | The content of the cookie sent or received, if any. | keyword |
| iis.access.server_name | The name of the server on which the log file entry was generated. | keyword |
| iis.access.site_name | The site name and instance number. | keyword |
| iis.access.sub_status | The HTTP substatus code. | long |
| iis.access.win32_status | The Windows status code. | long |
This data stream will collect and parse error IIS logs.
Example
{
    "@timestamp": "2020-06-30T13:56:46.000Z",
    "agent": {
        "ephemeral_id": "3f65b650-b6a3-4694-83b3-0c324a60809d",
        "id": "db17f9fb-5bcb-4116-a009-79a1bb7d4820",
        "name": "DESKTOP-RFOOE09",
        "type": "filebeat",
        "version": "8.0.0"
    },
    "destination": {
        "address": "::1%0",
        "ip": "::1",
        "port": 80
    },
    "ecs": {
        "version": "8.11.0"
    },
    "event": {
        "category": [
            "web",
            "network"
        ],
        "created": "2020-07-08T11:40:13.768Z",
        "kind": "event",
        "type": [
            "connection"
        ]
    },
    "iis": {
        "error": {
            "reason_phrase": "Timer_ConnectionIdle"
        }
    },
    "related": {
        "ip": [
            "::1",
            "::1"
        ]
    },
    "source": {
        "address": "::1%0",
        "ip": "::1",
        "port": 59827
    }
}
The fields reported are:
ECS Field Reference
Please refer to the following document for detailed information on ECS fields.
Exported fields
| Field | Description | Type |
|---|---|---|
| @timestamp | Event timestamp. | date |
| cloud.image.id | Image ID for the cloud instance. | keyword |
| data_stream.dataset | Data stream dataset. | constant_keyword |
| data_stream.namespace | Data stream namespace. | constant_keyword |
| data_stream.type | Data stream type. | constant_keyword |
| event.dataset | Event dataset | constant_keyword |
| event.module | Event module | constant_keyword |
| host.containerized | If the host is a container. | boolean |
| host.os.build | OS build information. | keyword |
| host.os.codename | OS codename, if any. | keyword |
| iis.error.queue_name | The IIS application pool name. | keyword |
| iis.error.reason_phrase | The HTTP reason phrase. | keyword |
The webserver data stream allows users to retrieve aggregated metrics for the entire web server.
Example
{
    "@timestamp": "2020-07-08T11:42:12.102Z",
    "agent": {
        "ephemeral_id": "8ade3582-e6ab-4664-ba27-52b3d46953e3",
        "id": "3b73ebb6-c6ea-4354-b1f3-240ac1aa072c",
        "name": "DESKTOP-RFOOE09",
        "type": "metricbeat",
        "version": "8.0.0"
    },
    "ecs": {
        "version": "8.11.0"
    },
    "event": {
        "dataset": "iis.webserver",
        "duration": 1205854900,
        "module": "iis"
    },
    "iis": {
        "webserver": {
            "asp_net": {
                "application_restarts": 0,
                "request_wait_time": 0
            },
            "asp_net_application": {
                "pipeline_instance_count": 2,
                "requests_executing": 0,
                "requests_in_application_queue": 0
            },
            "cache": {
                "current_file_cache_memory_usage": 696,
                "current_files_cached": 2,
                "current_uris_cached": 1,
                "file_cache_hits": 18,
                "file_cache_misses": 70,
                "maximum_file_cache_memory_usage": 99453,
                "output_cache_current_items": 0,
                "output_cache_current_memory_usage": 0,
                "output_cache_total_hits": 0,
                "output_cache_total_misses": 76,
                "total_files_cached": 15,
                "total_uris_cached": 10,
                "uri_cache_hits": 14,
                "uri_cache_misses": 62
            },
            "network": {
                "anonymous_users_per_sec": 0,
                "bytes_received_per_sec": 0,
                "bytes_sent_per_sec": 0,
                "current_anonymous_users": 0,
                "current_connections": 2,
                "current_non_anonymous_users": 0,
                "delete_requests_per_sec": 0,
                "get_requests_per_sec": 0,
                "maximum_connections": 6,
                "post_requests_per_sec": 0,
                "service_uptime": 1721919,
                "total_anonymous_users": 52,
                "total_bytes_received": 33151,
                "total_bytes_sent": 903338,
                "total_connection_attempts": 23,
                "total_delete_requests": 0,
                "total_get_requests": 52,
                "total_non_anonymous_users": 0,
                "total_post_requests": 0
            },
            "process": {
                "io_read_operations_per_sec": 5.7271735422265,
                "io_write_operations_per_sec": 5.7271735422265,
                "page_faults_per_sec": 1.0738450391674688,
                "private_bytes": 106692608,
                "virtual_bytes": 2222663852032,
                "worker_process_count": 2
            }
        }
    },
    "metricset": {
        "name": "webserver",
        "period": 10000
    },
    "service": {
        "type": "iis"
    }
}
The fields reported are:
ECS Field Reference
Please refer to the following document for detailed information on ECS fields.
Exported fields
| Field | Description | Type | Unit | Metric Type |
|---|---|---|---|---|
| @timestamp | Event timestamp. | date | ||
| agent.id | keyword | |||
| cloud.account.id | The cloud account or organization id used to identify different entities in a multi-tenant environment. Examples: AWS account id, Google Cloud ORG Id, or other unique identifier. | keyword | ||
| cloud.availability_zone | Availability zone in which this host is running. | keyword | ||
| cloud.image.id | Image ID for the cloud instance. | keyword | ||
| cloud.instance.id | Instance ID of the host machine. | keyword | ||
| cloud.provider | Name of the cloud provider. Example values are aws, azure, gcp, or digitalocean. | keyword | ||
| cloud.region | Region in which this host is running. | keyword | ||
| container.id | Unique container id. | keyword | ||
| data_stream.dataset | Data stream dataset. | constant_keyword | ||
| data_stream.namespace | Data stream namespace. | constant_keyword | ||
| data_stream.type | Data stream type. | constant_keyword | ||
| event.dataset | Event dataset | constant_keyword | ||
| event.module | Event module | constant_keyword | ||
| host.containerized | If the host is a container. | boolean | ||
| host.name | Name of the host. It can contain what hostname returns on Unix systems, the fully qualified domain name, or a name specified by the user. The sender decides which value to use. |
keyword | ||
| host.os.build | OS build information. | keyword | ||
| host.os.codename | OS codename, if any. | keyword | ||
| iis.webserver.asp_net.application_restarts | Number of applications restarts. | float | gauge | |
| iis.webserver.asp_net.request_wait_time | Request wait time. | long | ||
| iis.webserver.asp_net_application.errors_total_per_sec | Total number of errors per sec. | float | gauge | |
| iis.webserver.asp_net_application.pipeline_instance_count | The pipeline instance count. | float | gauge | |
| iis.webserver.asp_net_application.requests_executing | Number of requests executing. | float | gauge | |
| iis.webserver.asp_net_application.requests_in_application_queue | Number of requests in the application queue. | float | ||
| iis.webserver.asp_net_application.requests_per_sec | Number of requests per sec. | float | gauge | |
| iis.webserver.cache.current_file_cache_memory_usage | The current file cache memory usage size. | float | ||
| iis.webserver.cache.current_files_cached | The number of current files cached. | float | ||
| iis.webserver.cache.current_uris_cached | The number of current uris cached. | float | ||
| iis.webserver.cache.file_cache_hits | The number of file cache hits. | float | ||
| iis.webserver.cache.file_cache_misses | The number of file cache misses. | float | ||
| iis.webserver.cache.maximum_file_cache_memory_usage | The max file cache size. | float | ||
| iis.webserver.cache.output_cache_current_items | The number of output cache current items. | float | ||
| iis.webserver.cache.output_cache_current_memory_usage | The output cache memory usage size. | float | ||
| iis.webserver.cache.output_cache_total_hits | The output cache total hits count. | float | ||
| iis.webserver.cache.output_cache_total_misses | The output cache total misses count. | float | ||
| iis.webserver.cache.total_files_cached | the total number of files cached. | float | ||
| iis.webserver.cache.total_uris_cached | The total number of URIs cached. | float | ||
| iis.webserver.cache.uri_cache_hits | The number of URIs cached hits. | float | ||
| iis.webserver.cache.uri_cache_misses | The number of URIs cache misses. | float | ||
| iis.webserver.network.anonymous_users_per_sec | The number of anonymous users per sec. | float | gauge | |
| iis.webserver.network.bytes_received_per_sec | The size of bytes received per sec. | float | byte | gauge |
| iis.webserver.network.bytes_sent_per_sec | The size of bytes sent per sec. | float | byte | gauge |
| iis.webserver.network.current_anonymous_users | The number of current anonymous users. | float | ||
| iis.webserver.network.current_connections | The number of current connections. | float | ||
| iis.webserver.network.current_non_anonymous_users | The number of current non anonymous users. | float | ||
| iis.webserver.network.delete_requests_per_sec | Number of DELETE requests per sec. | float | gauge | |
| iis.webserver.network.get_requests_per_sec | Number of GET requests per sec. | float | gauge | |
| iis.webserver.network.maximum_connections | Number of maximum connections. | float | counter | |
| iis.webserver.network.post_requests_per_sec | Number of POST requests per sec. | float | gauge | |
| iis.webserver.network.service_uptime | Service uptime. | float | ||
| iis.webserver.network.total_anonymous_users | Total number of anonymous users. | float | counter | |
| iis.webserver.network.total_bytes_received | Total size of bytes received. | float | byte | counter |
| iis.webserver.network.total_bytes_sent | Total size of bytes sent. | float | byte | counter |
| iis.webserver.network.total_connection_attempts | The total number of connection attempts. | float | ||
| iis.webserver.network.total_delete_requests | The total number of DELETE requests. | float | counter | |
| iis.webserver.network.total_get_requests | The total number of GET requests. | float | counter | |
| iis.webserver.network.total_non_anonymous_users | The total number of non anonymous users. | float | counter | |
| iis.webserver.network.total_post_requests | The total number of POST requests. | float | counter | |
| iis.webserver.process.cpu_usage_perc | The CPU usage percentage. | float | percent | gauge |
| iis.webserver.process.handle_count | The number of handles. | float | ||
| iis.webserver.process.io_read_operations_per_sec | IO read operations per sec. | float | gauge | |
| iis.webserver.process.io_write_operations_per_sec | IO write operations per sec. | float | gauge | |
| iis.webserver.process.page_faults_per_sec | Memory page faults. | float | gauge | |
| iis.webserver.process.private_bytes | Memory private bytes. | float | byte | gauge |
| iis.webserver.process.thread_count | The number of threads. | long | ||
| iis.webserver.process.virtual_bytes | Memory virtual bytes. | float | byte | gauge |
| iis.webserver.process.worker_process_count | Number of worker processes running. | float | ||
| iis.webserver.process.working_set | Memory working set. | float | ||
| service.address | Address where data about this service was collected from. This should be a URI, network address (ipv4:port or [ipv6]:port) or a resource path (sockets). | keyword |
This data stream will collect metrics of specific sites, users can configure which websites they want to monitor, else, all are considered.
Example
{
    "@timestamp": "2020-07-08T11:40:22.114Z",
    "agent": {
        "ephemeral_id": "8ade3582-e6ab-4664-ba27-52b3d46953e3",
        "id": "3b73ebb6-c6ea-4354-b1f3-240ac1aa072c",
        "name": "DESKTOP-RFOOE09",
        "type": "metricbeat",
        "version": "8.0.0"
    },
    "ecs": {
        "version": "8.11.0"
    },
    "event": {
        "dataset": "iis.website",
        "duration": 5008200,
        "module": "iis"
    },
    "iis": {
        "website": {
            "name": "test2.local",
            "network": {
                "current_connections": 0,
                "maximum_connections": 4,
                "service_uptime": 1721807,
                "total_bytes_received": 4250,
                "total_bytes_sent": 135739,
                "total_connection_attempts": 7,
                "total_delete_requests": 0,
                "total_get_requests": 11,
                "total_post_requests": 0,
                "total_put_requests": 0
            }
        }
    },
    "metricset": {
        "name": "website",
        "period": 10000
    },
    "service": {
        "type": "iis"
    }
}
The fields reported are:
ECS Field Reference
Please refer to the following document for detailed information on ECS fields.
Exported fields
| Field | Description | Type | Unit | Metric Type |
|---|---|---|---|---|
| @timestamp | Event timestamp. | date | ||
| agent.id | keyword | |||
| cloud.account.id | The cloud account or organization id used to identify different entities in a multi-tenant environment. Examples: AWS account id, Google Cloud ORG Id, or other unique identifier. | keyword | ||
| cloud.availability_zone | Availability zone in which this host is running. | keyword | ||
| cloud.image.id | Image ID for the cloud instance. | keyword | ||
| cloud.instance.id | Instance ID of the host machine. | keyword | ||
| cloud.provider | Name of the cloud provider. Example values are aws, azure, gcp, or digitalocean. | keyword | ||
| cloud.region | Region in which this host is running. | keyword | ||
| container.id | Unique container id. | keyword | ||
| data_stream.dataset | Data stream dataset. | constant_keyword | ||
| data_stream.namespace | Data stream namespace. | constant_keyword | ||
| data_stream.type | Data stream type. | constant_keyword | ||
| event.dataset | Event dataset | constant_keyword | ||
| event.module | Event module | constant_keyword | ||
| host.containerized | If the host is a container. | boolean | ||
| host.name | Name of the host. It can contain what hostname returns on Unix systems, the fully qualified domain name, or a name specified by the user. The sender decides which value to use. |
keyword | ||
| host.os.build | OS build information. | keyword | ||
| host.os.codename | OS codename, if any. | keyword | ||
| iis.website.name | website name | keyword | ||
| iis.website.network.bytes_received_per_sec | The bytes received per sec size. | float | byte | gauge |
| iis.website.network.bytes_sent_per_sec | The bytes sent per sec size. | float | byte | gauge |
| iis.website.network.current_connections | The number of current connections. | float | ||
| iis.website.network.delete_requests_per_sec | The number of DELETE requests per sec. | float | gauge | |
| iis.website.network.get_requests_per_sec | The number of GET requests per sec. | float | gauge | |
| iis.website.network.maximum_connections | The number of maximum connections. | float | ||
| iis.website.network.post_requests_per_sec | The number of POST requests per sec. | float | gauge | |
| iis.website.network.put_requests_per_sec | The number of PUT requests per sec. | float | gauge | |
| iis.website.network.service_uptime | The service uptime. | float | ||
| iis.website.network.total_bytes_received | The total number of bytes received. | float | byte | counter |
| iis.website.network.total_bytes_sent | The total number of bytes sent. | float | byte | counter |
| iis.website.network.total_connection_attempts | The total number of connection attempts. | float | counter | |
| iis.website.network.total_delete_requests | The total number of DELETE requests. | float | counter | |
| iis.website.network.total_get_requests | The total number of GET requests. | float | counter | |
| iis.website.network.total_post_requests | The total number of POST requests. | float | counter | |
| iis.website.network.total_put_requests | The total number of PUT requests. | float | counter | |
| service.address | Address where data about this service was collected from. This should be a URI, network address (ipv4:port or [ipv6]:port) or a resource path (sockets). | keyword |
This data stream will collect metrics of specific application pools, users can configure which websites they want to monitor, else, all are considered.
Example
{
    "@timestamp": "2020-07-08T11:41:31.048Z",
    "agent": {
        "ephemeral_id": "8ade3582-e6ab-4664-ba27-52b3d46953e3",
        "id": "3b73ebb6-c6ea-4354-b1f3-240ac1aa072c",
        "name": "DESKTOP-RFOOE09",
        "type": "metricbeat",
        "version": "8.0.0"
    },
    "ecs": {
        "version": "8.11.0"
    },
    "event": {
        "dataset": "iis.application_pool",
        "duration": 397142600,
        "module": "iis"
    },
    "iis": {
        "application_pool": {
            "name": "DefaultAppPool",
            "net_clr": {
                "total_exceptions_thrown": 0,
                "finallys_per_sec": 0,
                "exceptions_thrown_per_sec": 0,
                "locks_and_threads": {
                    "current_queue_length": 0,
                    "contention_rate_per_sec": 0
                },
                "memory": {
                    "gen_2_heap_size": 0,
                    "large_object_heap_size": 0,
                    "gen_1_heap_size": 0,
                    "gen_1_collections": 0,
                    "gen_0_heap_size": 0,
                    "bytes_in_all_heaps": 0,
                    "total_committed_bytes": 0,
                    "gen_0_collections": 0,
                    "gen_2_collections": 0,
                    "allocated_bytes_per_sec": 0,
                    "time_in_gc_perc": 0
                },
                "filters_per_sec": 0,
                "throw_to_catch_depth_per_sec": 0
            },
            "process": {
                "handle_count": 466,
                "private_bytes": 71516160,
                "thread_count": 30
            }
        }
    },
    "metricset": {
        "name": "application_pool",
        "period": 10000
    },
    "service": {
        "type": "iis"
    }
}
The fields reported are:
ECS Field Reference
Please refer to the following document for detailed information on ECS fields.
Exported fields
| Field | Description | Type | Unit | Metric Type |
|---|---|---|---|---|
| @timestamp | Event timestamp. | date | ||
| agent.id | keyword | |||
| cloud.account.id | The cloud account or organization id used to identify different entities in a multi-tenant environment. Examples: AWS account id, Google Cloud ORG Id, or other unique identifier. | keyword | ||
| cloud.availability_zone | Availability zone in which this host is running. | keyword | ||
| cloud.image.id | Image ID for the cloud instance. | keyword | ||
| cloud.instance.id | Instance ID of the host machine. | keyword | ||
| cloud.provider | Name of the cloud provider. Example values are aws, azure, gcp, or digitalocean. | keyword | ||
| cloud.region | Region in which this host is running. | keyword | ||
| container.id | Unique container id. | keyword | ||
| data_stream.dataset | Data stream dataset. | constant_keyword | ||
| data_stream.namespace | Data stream namespace. | constant_keyword | ||
| data_stream.type | Data stream type. | constant_keyword | ||
| event.dataset | Event dataset | constant_keyword | ||
| event.module | Event module | constant_keyword | ||
| host.containerized | If the host is a container. | boolean | ||
| host.name | Name of the host. It can contain what hostname returns on Unix systems, the fully qualified domain name, or a name specified by the user. The sender decides which value to use. |
keyword | ||
| host.os.build | OS build information. | keyword | ||
| host.os.codename | OS codename, if any. | keyword | ||
| iis.application_pool.name | application pool name | keyword | ||
| iis.application_pool.net_clr.exceptions_thrown_per_sec | Number of Exceptions Thrown / sec. | float | ||
| iis.application_pool.net_clr.filters_per_sec | Number of filters per sec. | float | gauge | |
| iis.application_pool.net_clr.finallys_per_sec | The number of finallys per sec. | float | gauge | |
| iis.application_pool.net_clr.locks_and_threads.contention_rate_per_sec | Contention Rate / sec. | float | ||
| iis.application_pool.net_clr.locks_and_threads.current_queue_length | Current Queue Length. | float | ||
| iis.application_pool.net_clr.memory.allocated_bytes_per_sec | Allocated Bytes/sec. | float | byte | |
| iis.application_pool.net_clr.memory.bytes_in_all_heaps | Number of bytes in all heaps. | float | byte | |
| iis.application_pool.net_clr.memory.gen_0_collections | Number of Gen 0 Collections. | float | ||
| iis.application_pool.net_clr.memory.gen_0_heap_size | Gen 0 heap size. | float | ||
| iis.application_pool.net_clr.memory.gen_1_collections | Number of Gen 1 Collections. | float | ||
| iis.application_pool.net_clr.memory.gen_1_heap_size | Gen 1 heap size. | float | ||
| iis.application_pool.net_clr.memory.gen_2_collections | Number of Gen 2 Collections. | float | ||
| iis.application_pool.net_clr.memory.gen_2_heap_size | Gen 2 heap size. | float | ||
| iis.application_pool.net_clr.memory.large_object_heap_size | Large Object Heap size. | float | ||
| iis.application_pool.net_clr.memory.time_in_gc_perc | % Time in GC. | float | ||
| iis.application_pool.net_clr.memory.total_committed_bytes | Number of total committed bytes. | float | byte | |
| iis.application_pool.net_clr.throw_to_catch_depth_per_sec | Throw to catch depth count per sec. | float | gauge | |
| iis.application_pool.net_clr.total_exceptions_thrown | Total number of exceptions thrown. | long | counter | |
| iis.application_pool.process.cpu_usage_perc | The CPU usage percentage. | float | percent | gauge |
| iis.application_pool.process.handle_count | The number of handles. | long | ||
| iis.application_pool.process.io_read_operations_per_sec | IO read operations per sec. | float | gauge | |
| iis.application_pool.process.io_write_operations_per_sec | IO write operations per sec. | float | gauge | |
| iis.application_pool.process.page_faults_per_sec | Memory page faults. | float | gauge | |
| iis.application_pool.process.private_bytes | Memory private bytes. | float | byte | gauge |
| iis.application_pool.process.thread_count | The number of threads. | long | counter | |
| iis.application_pool.process.virtual_bytes | Memory virtual bytes. | float | byte | gauge |
| iis.application_pool.process.working_set | Memory working set. | float | ||
| service.address | Address where data about this service was collected from. This should be a URI, network address (ipv4:port or [ipv6]:port) or a resource path (sockets). | keyword |
To ensure net_clr metrics appear, it is necessary to install ASP.NET. Follow the steps below to install ASP.NET on your IIS server.
- Select the IIS server:
- Open the IIS Manager.
- Select the server node in the left-hand Connections pane.
- Click on
Manage:- In the right-hand Actions pane, click on
Manage.
- In the right-hand Actions pane, click on
- Select
Add Roles and Features:- This will open the Add Roles and Features Wizard.
- On
Server Roles, select the following options:- Navigate to
Web Server (IIS) > Web Server > Application Development. - Check the boxes for:
.NET ExtensibilityASP.NETFor more detailed instructions, please refer to the official documentation.
- Navigate to
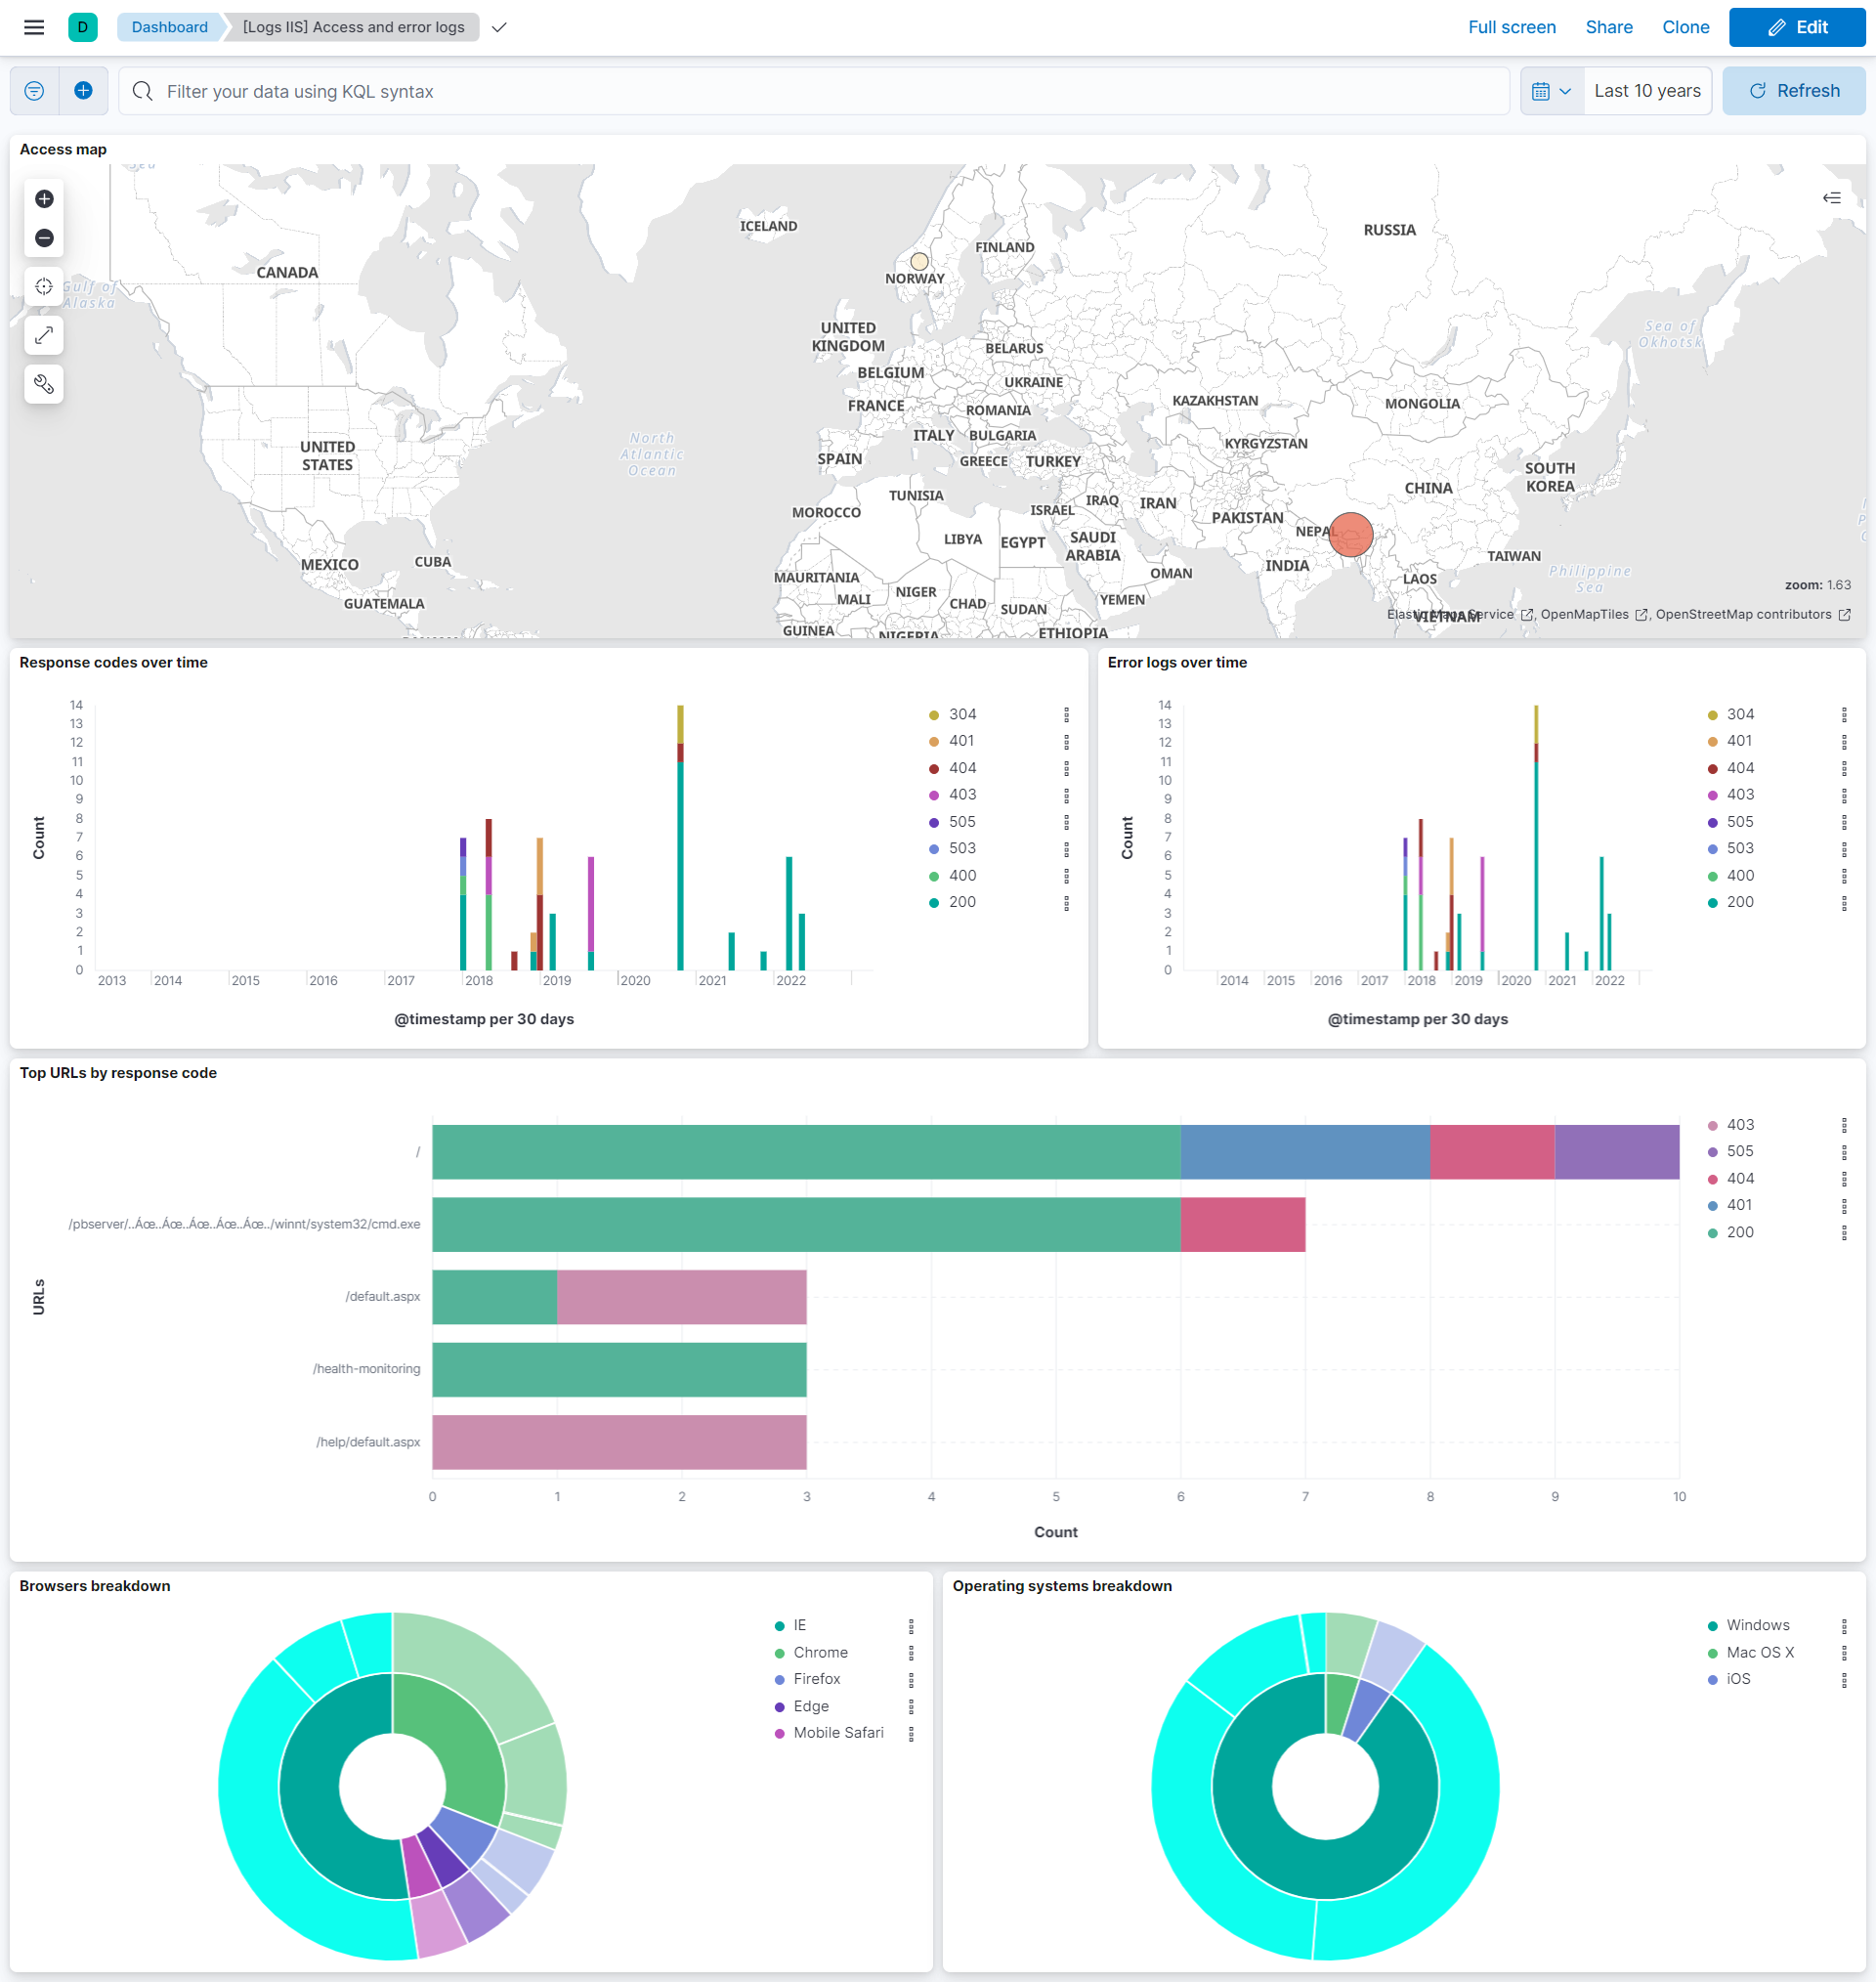
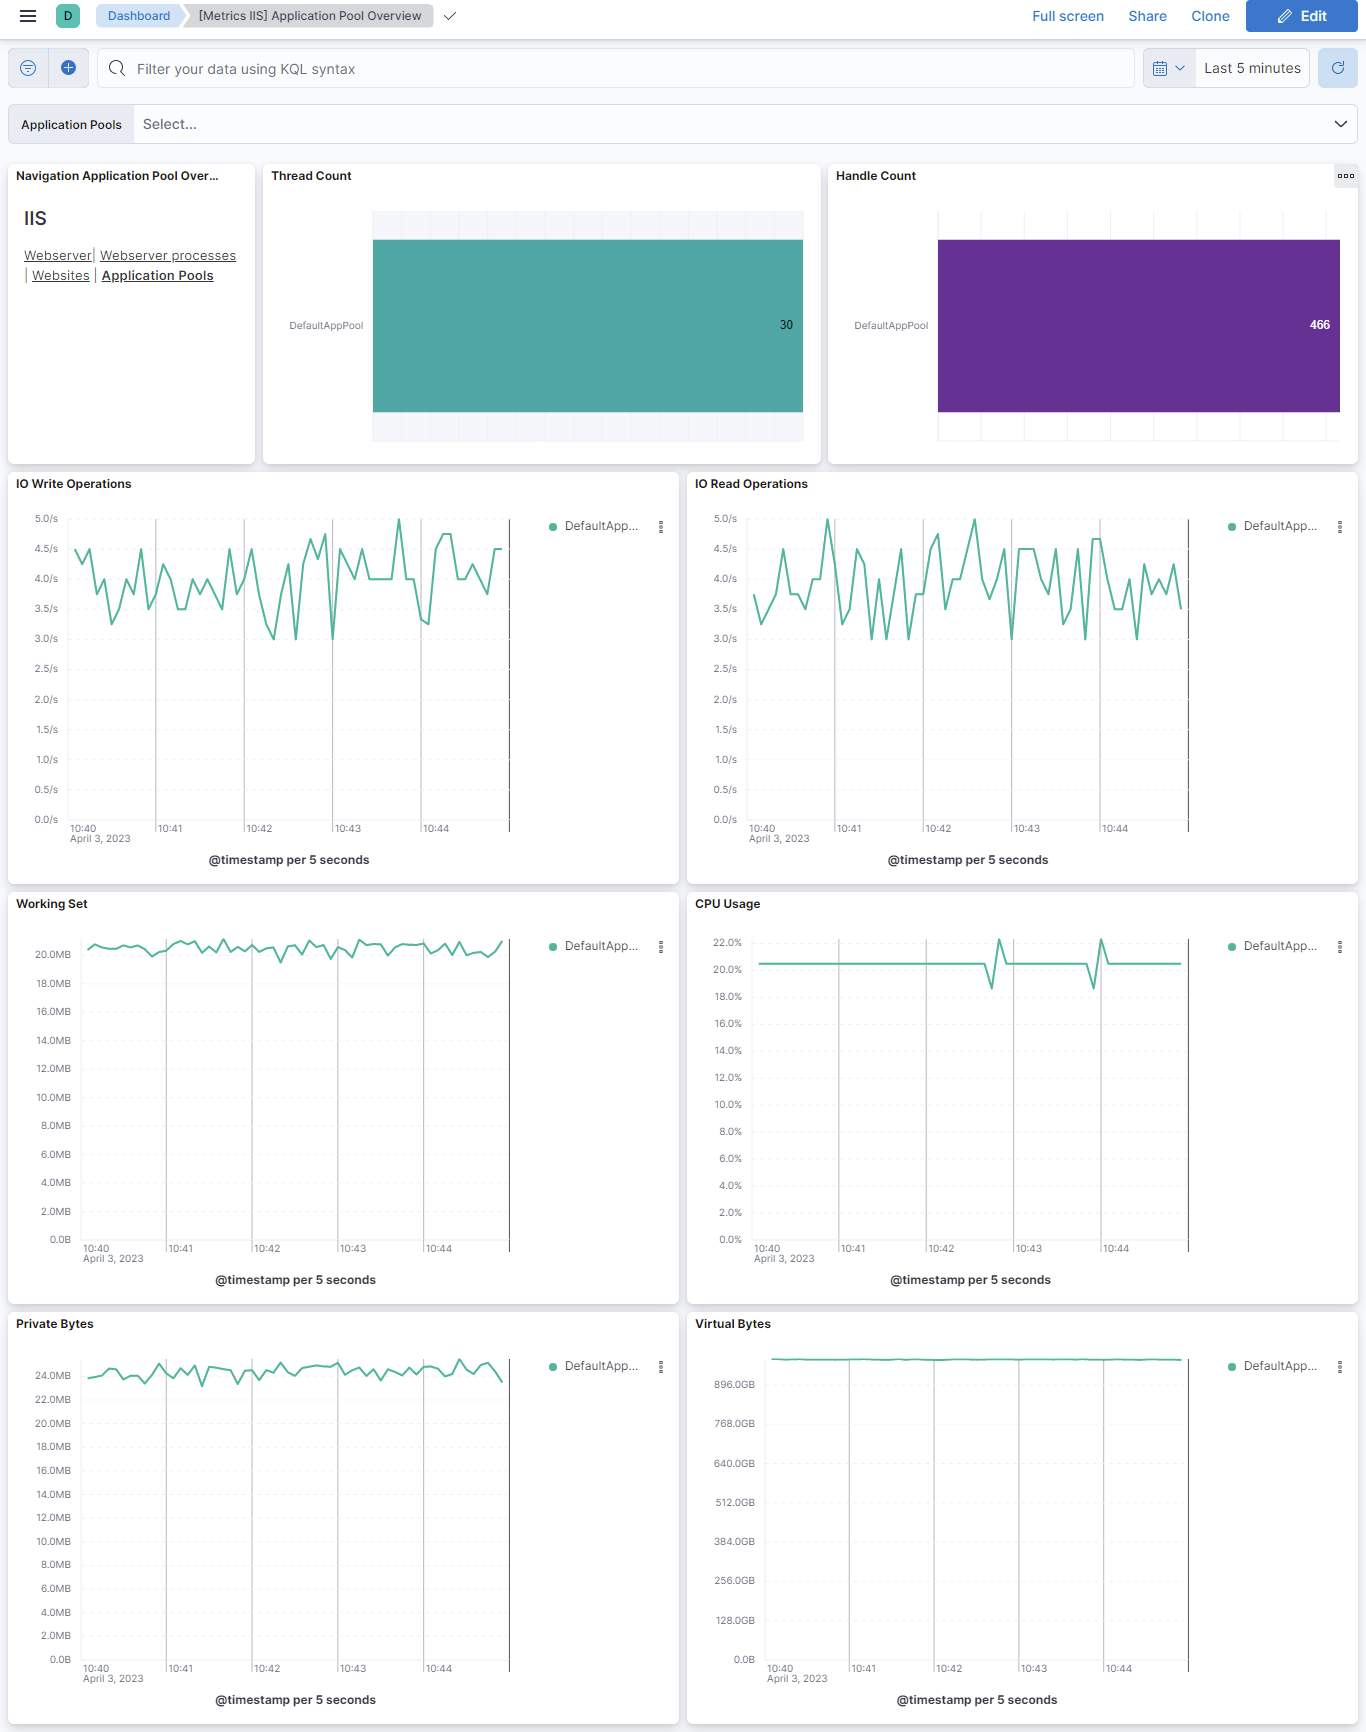
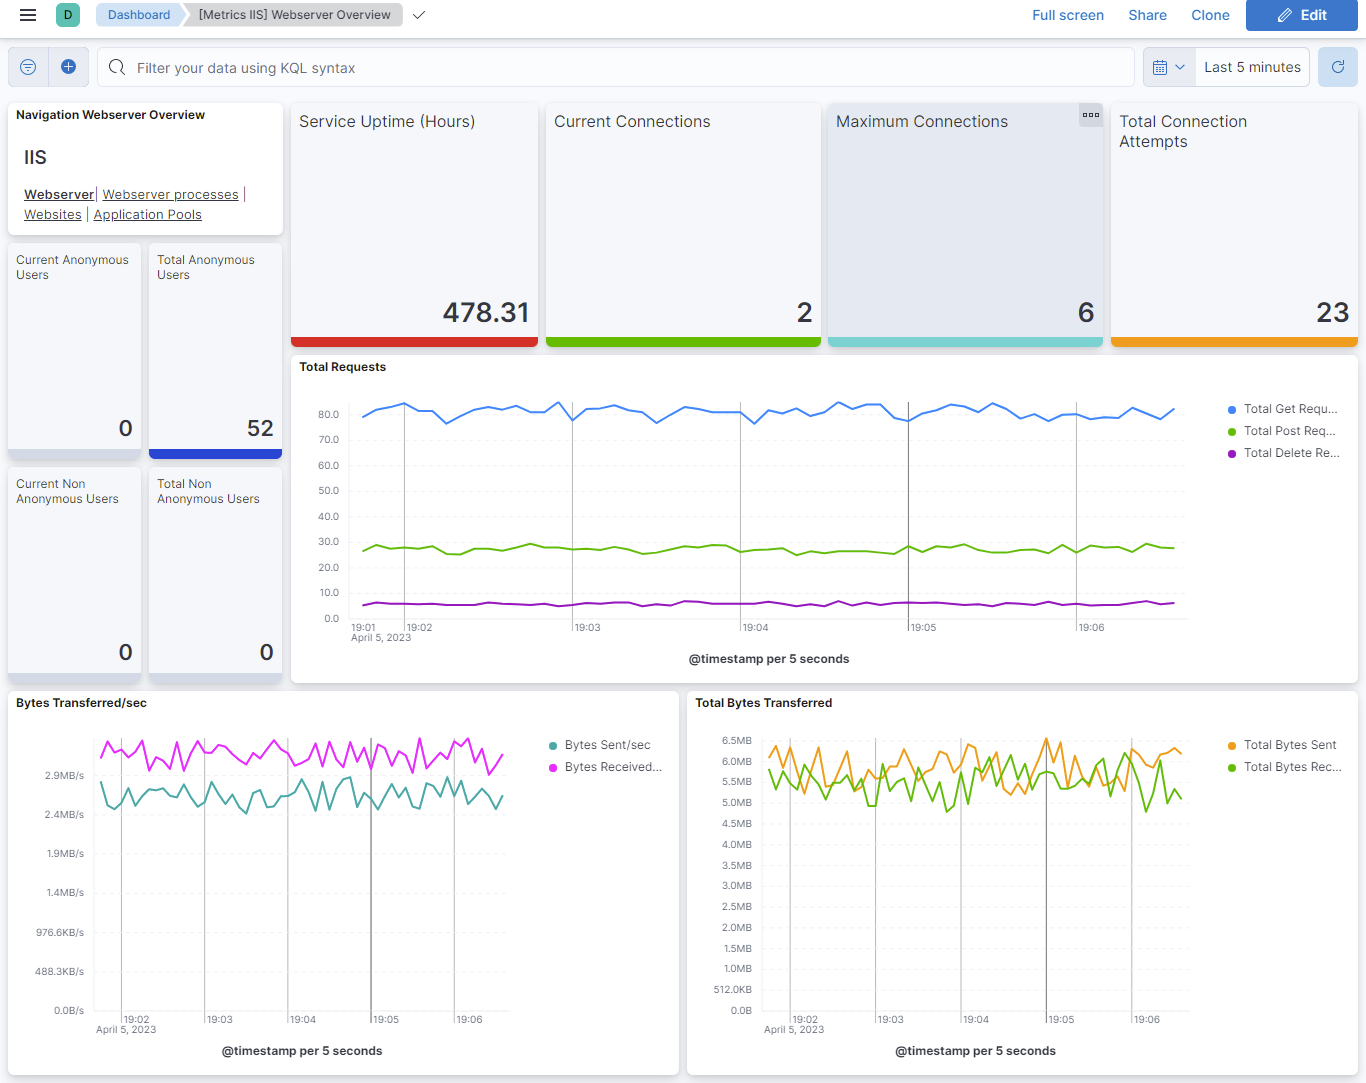
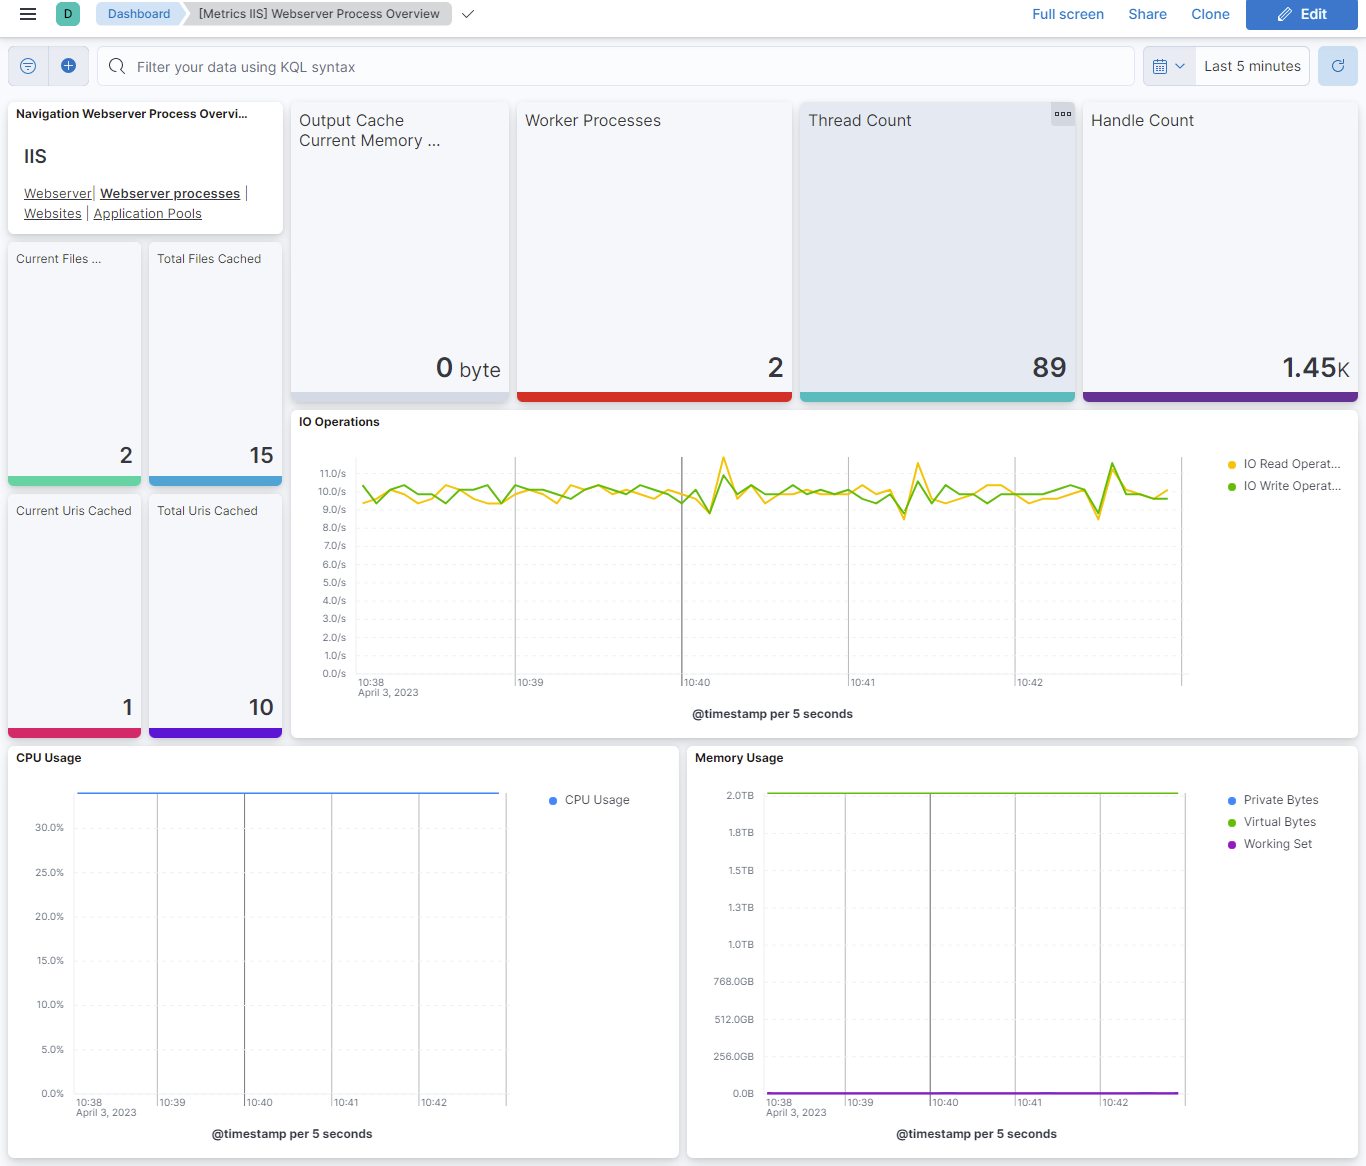
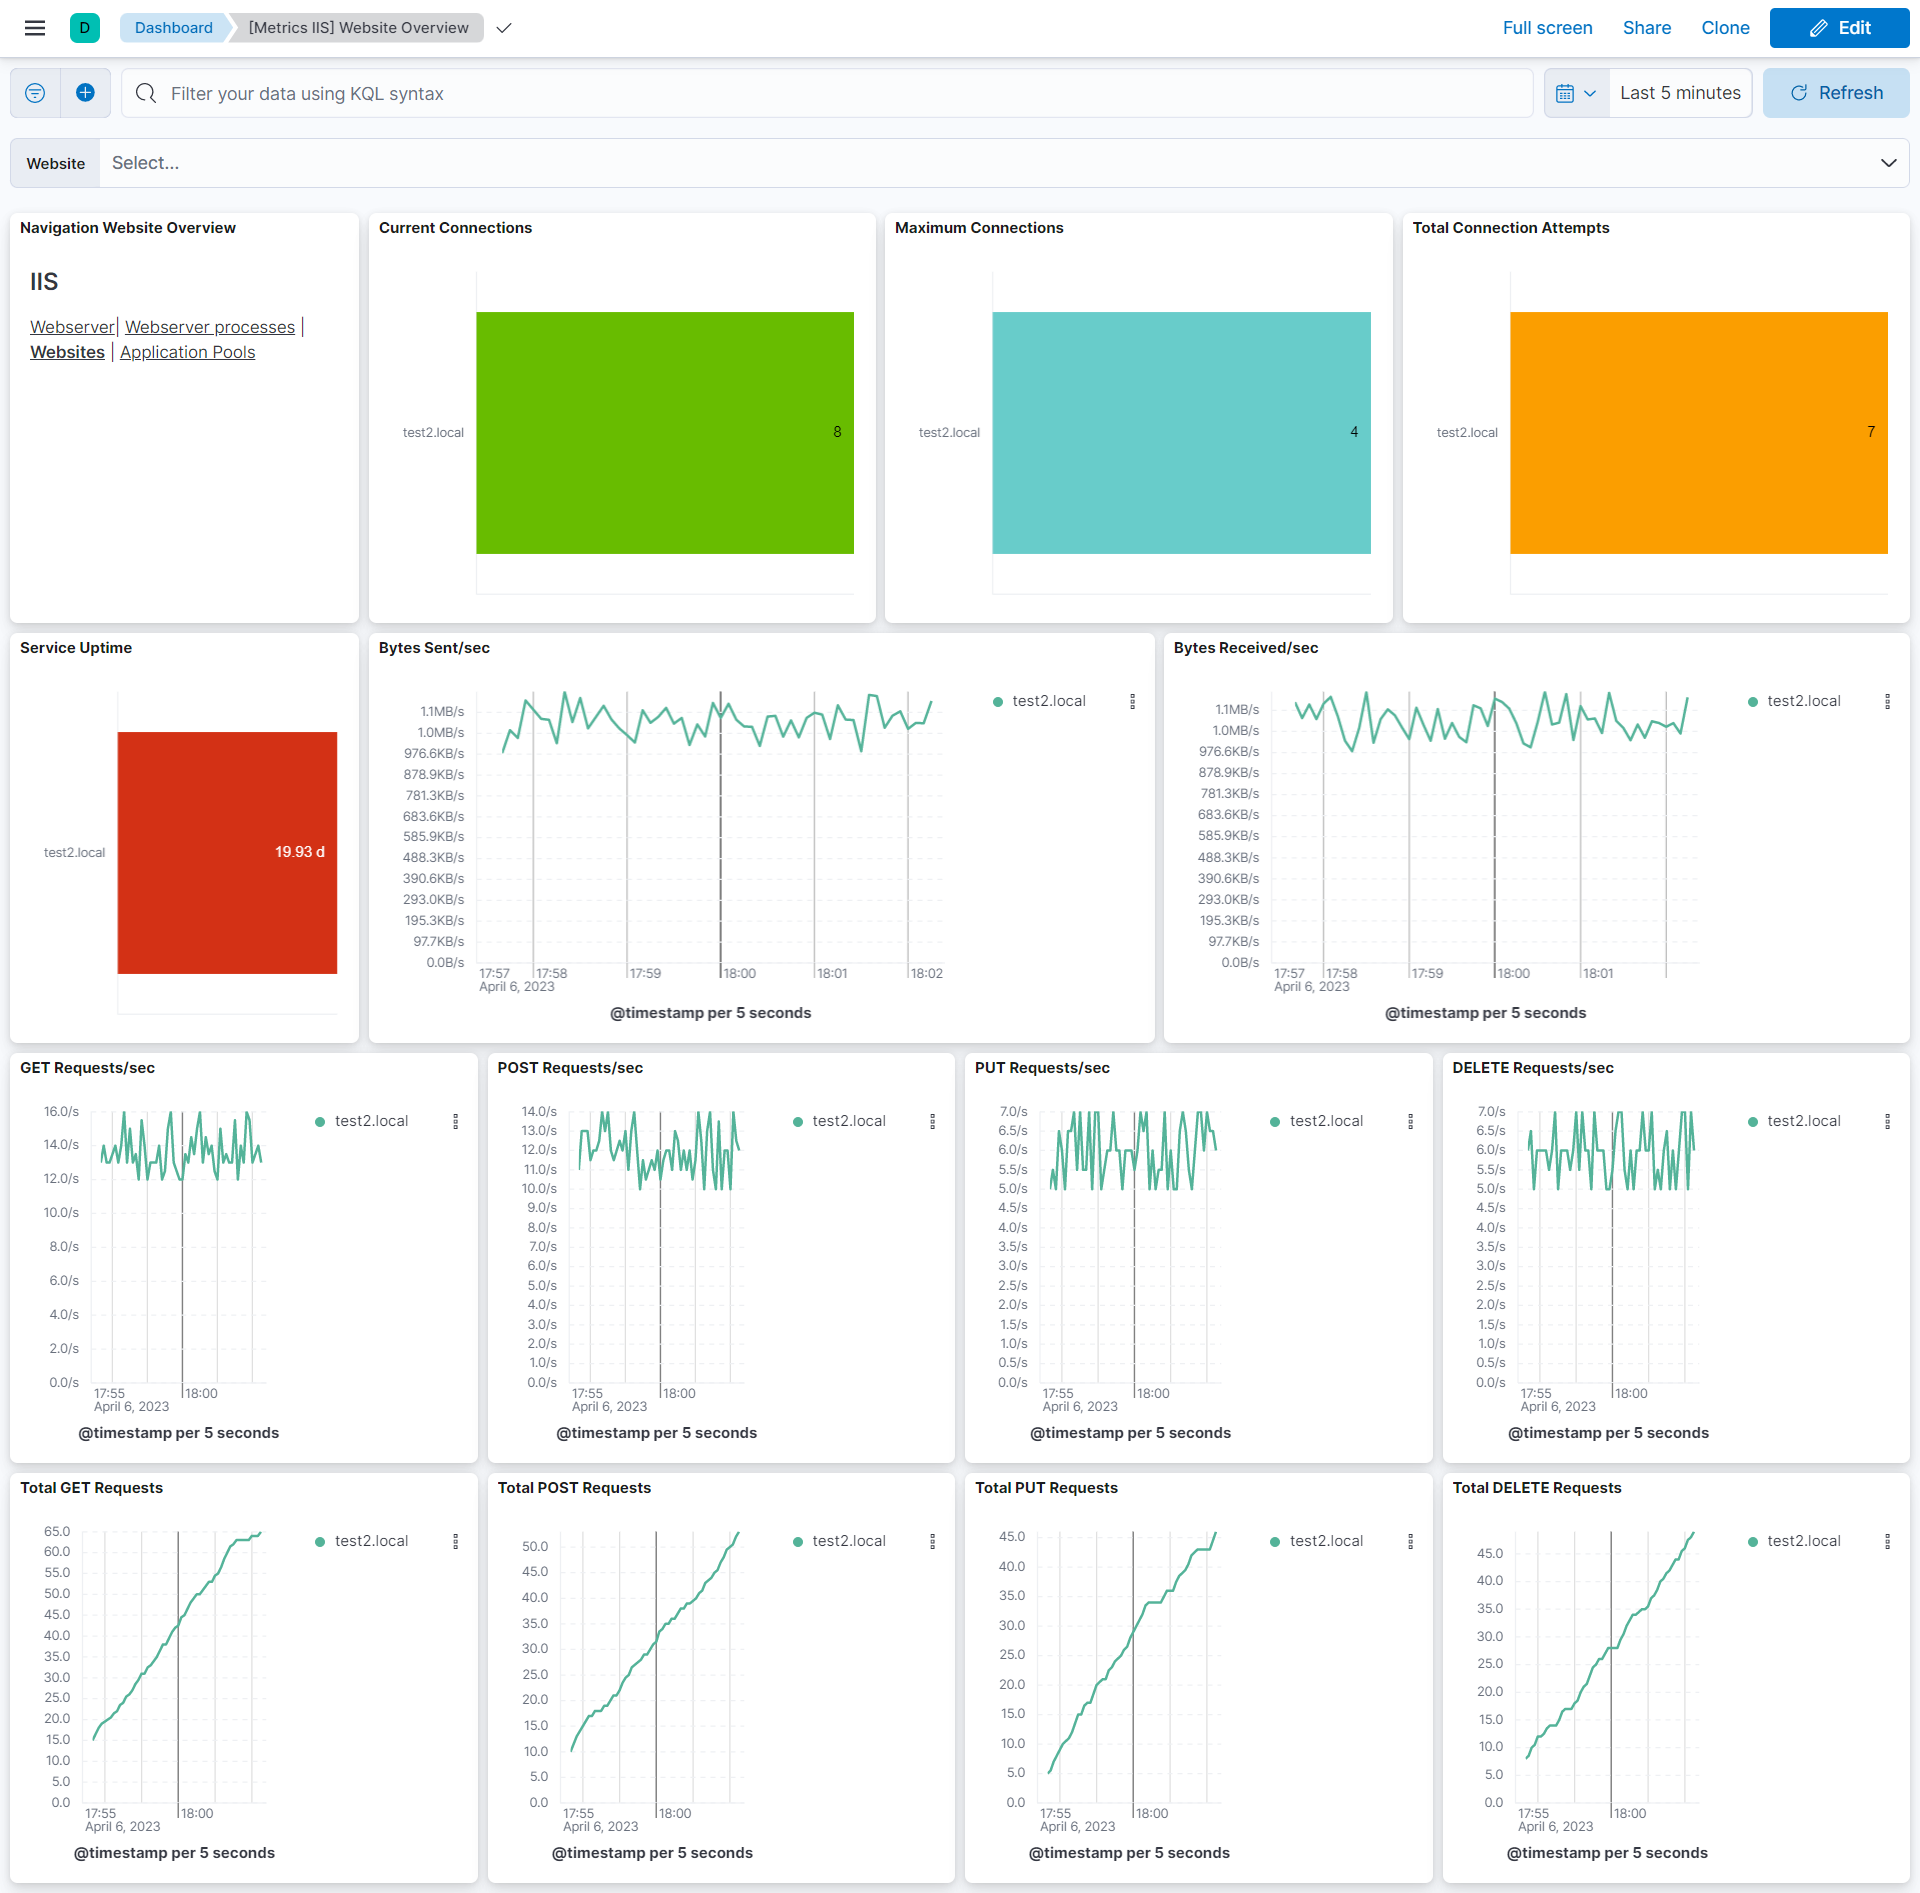
This integration includes one or more Kibana dashboards that visualizes the data collected by the integration. The screenshots below illustrate how the ingested data is displayed.
Changelog
| Version | Details | Minimum Kibana version |
|---|---|---|
| 1.24.9 | Enhancement (View pull request) Add group field to package manifest. |
9.0.0 8.13.0 |
| 1.24.8 | Bug fix (View pull request) Fix iis.error pipeline failing to parse HTTPERR log lines that use a hyphenated HTTP method (for example, M-POST), which the grok pattern's WORD field could not match. |
9.0.0 8.13.0 |
| 1.24.7 | Bug fix (View pull request) Add a grok pattern for access logs using the "s-ip ... cs(cookie) cs(Referer) ... sc-bytes, cs-bytes" documented field layout, which had no matching pattern and failed ingestion. |
9.0.0 8.13.0 |
| 1.24.6 | Enhancement (View pull request) Update package title and description to improve clarity of use. |
9.0.0 8.13.0 |
| 1.24.5 | Bug fix (View pull request) Add a new grok pattern for access log parsing to fix parsing issues on newer IIS 10 versions |
9.0.0 8.13.0 |
| 1.24.4 | Bug fix (View pull request) Fix unit type for application pool cpu_usage_perc field. |
9.0.0 8.13.0 |
| 1.24.3 | Enhancement (View pull request) Add a new grok pattern for access logs parsing |
9.0.0 8.13.0 |
| 1.24.2 | Bug fix (View pull request) Fix faulty Grok pattern |
9.0.0 8.13.0 |
| 1.24.1 | Bug fix (View pull request) Fix Dashboard Links Panel by setting useCurrentFilters to false |
9.0.0 8.13.0 |
| 1.24.0 | Enhancement (View pull request) Use links panel in Dashboards. |
9.0.0 8.13.0 |
| 1.23.0 | Enhancement (View pull request) Allow @custom pipeline access to event.original without setting preserve_original_event. |
9.0.0 8.13.0 |
| 1.22.0 | Enhancement (View pull request) Allow the usage of deprecated log input and support for stack 9.0 Enhancement (View pull request) Add support of memory and LocksAndThreads .NET CLR metrics. |
9.0.0 8.13.0 |
| 1.21.0 | Enhancement (View pull request) Add support for Kibana 9.0.0. |
9.0.0 8.13.0 |
| 1.20.1 | Bug fix (View pull request) Update links to getting started docs |
8.13.0 |
| 1.20.0 | Enhancement (View pull request) ECS version updated to 8.11.0. Update the kibana constraint to ^8.13.0. Modified the field definitions to remove ECS fields made redundant by the ecs@mappings component template. |
8.13.0 |
| 1.19.0 | Enhancement (View pull request) Add processors capability to IIS Metrics. |
8.8.0 |
| 1.18.0 | Enhancement (View pull request) Add global filter on data_stream.dataset to improve performance. |
8.8.0 |
| 1.17.4 | Enhancement (View pull request) Inline "by reference" visualizations |
8.8.0 |
| 1.17.3 | Enhancement (View pull request) Update documentation for custom log format processing. |
8.8.0 |
| 1.17.2 | Bug fix (View pull request) Fix network.forwarded_ip datatype to IP |
8.8.0 |
| 1.17.1 | Enhancement (View pull request) Update README to use documentation guidelines |
8.8.0 |
| 1.17.0 | Enhancement (View pull request) Add regex for Exchange logs |
8.8.0 |
| 1.16.0 | Enhancement (View pull request) Update the package format_version to 3.0.0. |
8.8.0 |
| 1.15.1 | Bug fix (View pull request) Add null check and ignore_missing check to the rename processor |
8.8.0 |
| 1.15.0 | Enhancement (View pull request) Add ability to set condition for logs and metrics. |
8.8.0 |
| 1.14.0 | Enhancement (View pull request) Update document with supported ingest patterns for access_log |
8.8.0 |
| 1.13.0 | Enhancement (View pull request) Enable time series data streams for the metrics datasets. This dramatically reduces storage for metrics and is expected to progressively improve query performance. For more details, see https://www.elastic.co/guide/en/elasticsearch/reference/current/tsds.html. |
8.8.0 |
| 1.12.3 | Bug fix (View pull request) Update aggregator function for a few fields having metric_type counter. |
8.5.0 |
| 1.12.2 | Enhancement (View pull request) Add dimension field mapping for website datastream to support tsdb. |
8.5.0 |
| 1.12.1 | Enhancement (View pull request) Add dimension field mapping for webserver datastream to support tsdb. |
8.5.0 |
| 1.12.0 | Enhancement (View pull request) Add dimension field mapping for application_pool datastream to support tsdb. |
8.5.0 |
| 1.11.0 | Enhancement (View pull request) Rename ownership from obs-service-integrations to obs-infraobs-integrations |
8.5.0 |
| 1.10.0 | Enhancement (View pull request) Migrate Application Pool Overview dashboard visualizations to lens. |
8.5.0 |
| 1.9.0 | Enhancement (View pull request) Migrate Webserver Overview dashboard visualizations to lens. |
— |
| 1.8.0 | Enhancement (View pull request) Migrate Website Overview dashboard visualizations to lens. |
— |
| 1.7.0 | Enhancement (View pull request) Migrate Webserver Process Overview dashboard visualizations to lens. |
— |
| 1.6.0 | Enhancement (View pull request) Migrate Access and error logs dashboard visualizations to lens. |
— |
| 1.5.1 | Enhancement (View pull request) Added categories and/or subcategories. |
8.3.0 |
| 1.5.0 | Enhancement (View pull request) Remove deprecated controls and added new control panel |
8.3.0 |
| 1.4.1 | Bug fix (View pull request) Accept multiple application pool names |
8.0.0 |
| 1.4.0 | Enhancement (View pull request) Updated ECS version to 8.5.1 |
8.0.0 |
| 1.3.0 | Enhancement (View pull request) Added infrastructure category. |
8.0.0 |
| 1.2.1 | Bug fix (View pull request) Updated the ingest pipeline to process the event.duration value. |
8.0.0 |
| 1.2.0 | Enhancement (View pull request) Updated the condition check for ignore_older flag. |
8.0.0 |
| 1.1.0 | Enhancement (View pull request) Add Ignore older than flag for logs stream |
8.0.0 |
| 1.0.0 | Enhancement (View pull request) Make IIS GA |
8.0.0 |
| 0.11.0 | Enhancement (View pull request) Update the ingest pipeline for given log format |
8.0.0 |
| 0.10.1 | Enhancement (View pull request) Add link in readme to IIS documentation |
— |
| 0.10.0 | Enhancement (View pull request) Supporting a log format for IIS 10 |
— |
| 0.9.0 | Enhancement (View pull request) Migrating the tile_map to map object in dashboard |
— |
| 0.8.5 | Bug fix (View pull request) Parsing of IIS access logs with IPV6 addressing |
— |
| 0.8.4 | Enhancement (View pull request) Add documentation for multi-fields |
— |
| 0.8.3 | Bug fix (View pull request) Fix event.* field mappings |
— |
| 0.8.2 | Bug fix (View pull request) Regenerate test files using the new GeoIP database |
— |
| 0.8.1 | Bug fix (View pull request) Change test public IPs to the supported subset |
— |
| 0.8.0 | Enhancement (View pull request) Support Kibana 8.0 |
8.0.0 7.14.0 |
| 0.7.2 | Enhancement (View pull request) Uniform with guidelines |
— |
| 0.7.1 | Bug fix (View pull request) Fix logic that checks for the 'forwarded' tag |
— |
| 0.7.0 | Enhancement (View pull request) Update to ECS 1.12.0 |
— |
| 0.6.2 | Enhancement (View pull request) Convert to generated ECS fields |
— |
| 0.6.1 | Enhancement (View pull request) update to ECS 1.11.0 |
— |
| 0.6.0 | Enhancement (View pull request) Update integration description |
— |
| 0.5.0 | Enhancement (View pull request) Set "event.module" and "event.dataset" |
7.14.0 |
| 0.4.0 | Enhancement (View pull request) update to ECS 1.10.0 and add event.original options |
— |
| 0.3.2 | Enhancement (View pull request) update to ECS 1.9.0 |
— |
| 0.3.1 | Bug fix (View pull request) Correct sample event file. |
— |
| 0.1.0 | Enhancement (View pull request) initial release |
— |