MySQL OpenTelemetry Assets
Elastic Cloud Serverless projects are autoscaled environments, fully managed by Elastic and available on Elastic Cloud. Availability This functionality is in technical preview and is ready for evaluation. Use with caution in production; it is not recommended for mission-critical workloads. Elastic will work to fix any issues, but features in technical preview are not subject to the support SLA of official GA features. Specific Support terms apply. Elastic Cloud Serverless projects are autoscaled environments, fully managed by Elastic and available on Elastic Cloud. Availability This functionality is in technical preview and is ready for evaluation. Use with caution in production; it is not recommended for mission-critical workloads. Elastic will work to fix any issues, but features in technical preview are not subject to the support SLA of official GA features. Specific Support terms apply. The Elastic Stack includes Elastic's core products such as Elasticsearch, Kibana, Logstash, and Beats. Availability This functionality is in technical preview and is ready for evaluation. Use with caution in production; it is not recommended for mission-critical workloads. Elastic will work to fix any issues, but features in technical preview are not subject to the support SLA of official GA features. Specific Support terms apply. Unless stated otherwise on the page, this functionality is available when your Elastic Stack is deployed on Elastic Cloud Hosted, Elastic Cloud Enterprise, Elastic Cloud on Kubernetes, and self-managed environments. This documentation corresponds to the latest patch available for each minor version. If you're not using the latest patch, check the release notes for changes.
Serverless Observability
Preview
Preview
Serverless Security
Preview
Preview
Stack
Preview
9.4+
Preview since 9.4
| Version | 0.6.1 Availability Preview This functionality is in technical preview and is ready for evaluation. Use with caution in production; it is not recommended for mission-critical workloads. Elastic will work to fix any issues, but features in technical preview are not subject to the support SLA of official GA features. Specific Support terms apply. (View all) |
| Subscription level What's this? |
Basic |
| Developed by What's this? |
Elastic |
| Minimum Kibana version(s) | 9.4.0 |
To use pre-release integrations, go to the Integrations page in Kibana, scroll down, and toggle on the Display beta integrations option.
This package allows you to monitor MySQL, an open-source Relational Database Management System (RDBMS) that enables users to store, manage, and retrieve structured data efficiently.
The MySQL OpenTelemetry assets provide a visual representation of MySQL metrics and logs collected using the OpenTelemetry MySQL receiver, enabling you to monitor database performance and troubleshoot issues effectively in real time.
The MySQL OpenTelemetry assets have been tested with OpenTelemetry MySQL receiver v0.145.0.
Databases tested against:
- MySQL 8.0, 9.4
- MariaDB 10.11, 11.8
You need Elasticsearch for storing and searching your data and Kibana for visualizing and managing it. You can use our hosted Elasticsearch Service on Elastic Cloud, which is recommended, or self-manage the Elastic Stack on your own hardware.
The MySQL user configured for monitoring requires the following permissions:
Primary instance:
-- SHOW GLOBAL STATUS visibility and query sample access to information_schema.processlist
GRANT PROCESS ON *.* TO '<MYSQL_USER>'@'%';

-- Query samples, top queries, statement events (performance_schema access)
GRANT SELECT ON performance_schema.* TO '<MYSQL_USER>'@'%';

-- Table statistics (mysql.table.size, mysql.table.rows) and EXPLAIN for top query plans
GRANT SELECT ON <your_database>.* TO '<MYSQL_USER>'@'%';
Replica instance (for replication metrics):
-- mysql.replica.time_behind_source, mysql.replica.sql_delay
-- Works on both MySQL and MariaDB (MariaDB 10.5+ remaps this to BINLOG MONITOR)
GRANT REPLICATION CLIENT ON *.* TO '<MYSQL_USER>'@'%';
Performance Schema consumers:
The dashboards rely on the following Performance Schema consumers. Ensure they are enabled:
- statements_digest (ON by default) — required for top queries and statement events
- events_statements_current (ON by default) — required for query samples
- events_waits_current (OFF by default) — required for wait event details in query samples
Verify they are enabled:
SELECT NAME, ENABLED FROM performance_schema.setup_consumers
WHERE NAME IN ('statements_digest', 'events_statements_current', 'events_waits_current');
Install and configure the upstream OpenTelemetry Collector or Elastic Distribution of OpenTelemetry (EDOT) Collector to export metrics to Elasticsearch. The configuration below uses separate receivers for primary and replica instances because replication metrics are only available on replicas.
Replace the following placeholders in the configuration:
<MYSQL_PRIMARY_ENDPOINT>: MySQL primary instance endpoint (format:host:port, for example,localhost:3306ormysql-primary.example.com:3306)<MYSQL_REPLICA_ENDPOINT>: MySQL replica instance endpoint (format:host:port, for example,mysql-replica.example.com:3306)<MYSQL_USER>: MySQL username configured with required permissions<MYSQL_PASSWORD>: MySQL user password<ES_ENDPOINT>: Elasticsearch endpoint (for example,https://elasticsearch.example.com:9200)<ES_API_KEY>: Elasticsearch API key for authentication
receivers:
  mysql/primary:
    endpoint: <MYSQL_PRIMARY_ENDPOINT>
    username: <MYSQL_USER>
    password: <MYSQL_PASSWORD>
    collection_interval: 10s
    statement_events:
      digest_text_limit: 120
      time_limit: 24h
      limit: 250
    query_sample_collection:
      max_rows_per_query: 100
    top_query_collection:
      collection_interval: 30s
      lookback_time: 60
      max_query_sample_count: 1000
      top_query_count: 100
    events:
      db.server.query_sample:
        enabled: true
      db.server.top_query:
        enabled: true
    metrics:
      mysql.client.network.io:
        enabled: true
      mysql.connection.errors:
        enabled: true
      mysql.max_used_connections:
        enabled: true
      mysql.query.client.count:
        enabled: true
      mysql.query.count:
        enabled: true
      mysql.query.slow.count:
        enabled: true
      mysql.table.rows:
        enabled: true
      mysql.table.size:
        enabled: true

  mysql/replica:
    endpoint: <MYSQL_REPLICA_ENDPOINT>
    username: <MYSQL_USER>
    password: <MYSQL_PASSWORD>
    collection_interval: 10s
    metrics:
      mysql.replica.time_behind_source:
        enabled: true
      mysql.replica.sql_delay:
        enabled: true

exporters:
  elasticsearch/otel:
    endpoint: <ES_ENDPOINT>
    api_key: <ES_API_KEY>
    mapping:
      mode: otel

service:
  pipelines:
    metrics:
      receivers: [mysql/primary, mysql/replica]
      exporters: [elasticsearch/otel]
    logs:
      receivers: [mysql/primary]
      exporters: [elasticsearch/otel]
If you do not have a replica instance, remove the mysql/replica receiver and its reference from the metrics pipeline.
Refer to the metadata.yaml of the OpenTelemetry MySQL receiver for details on available metrics.
Refer to the documentation.md of the OpenTelemetry MySQL receiver for details on log events (db.server.query_sample and db.server.top_query) and their attributes.
| Dashboard | Description |
|---|---|
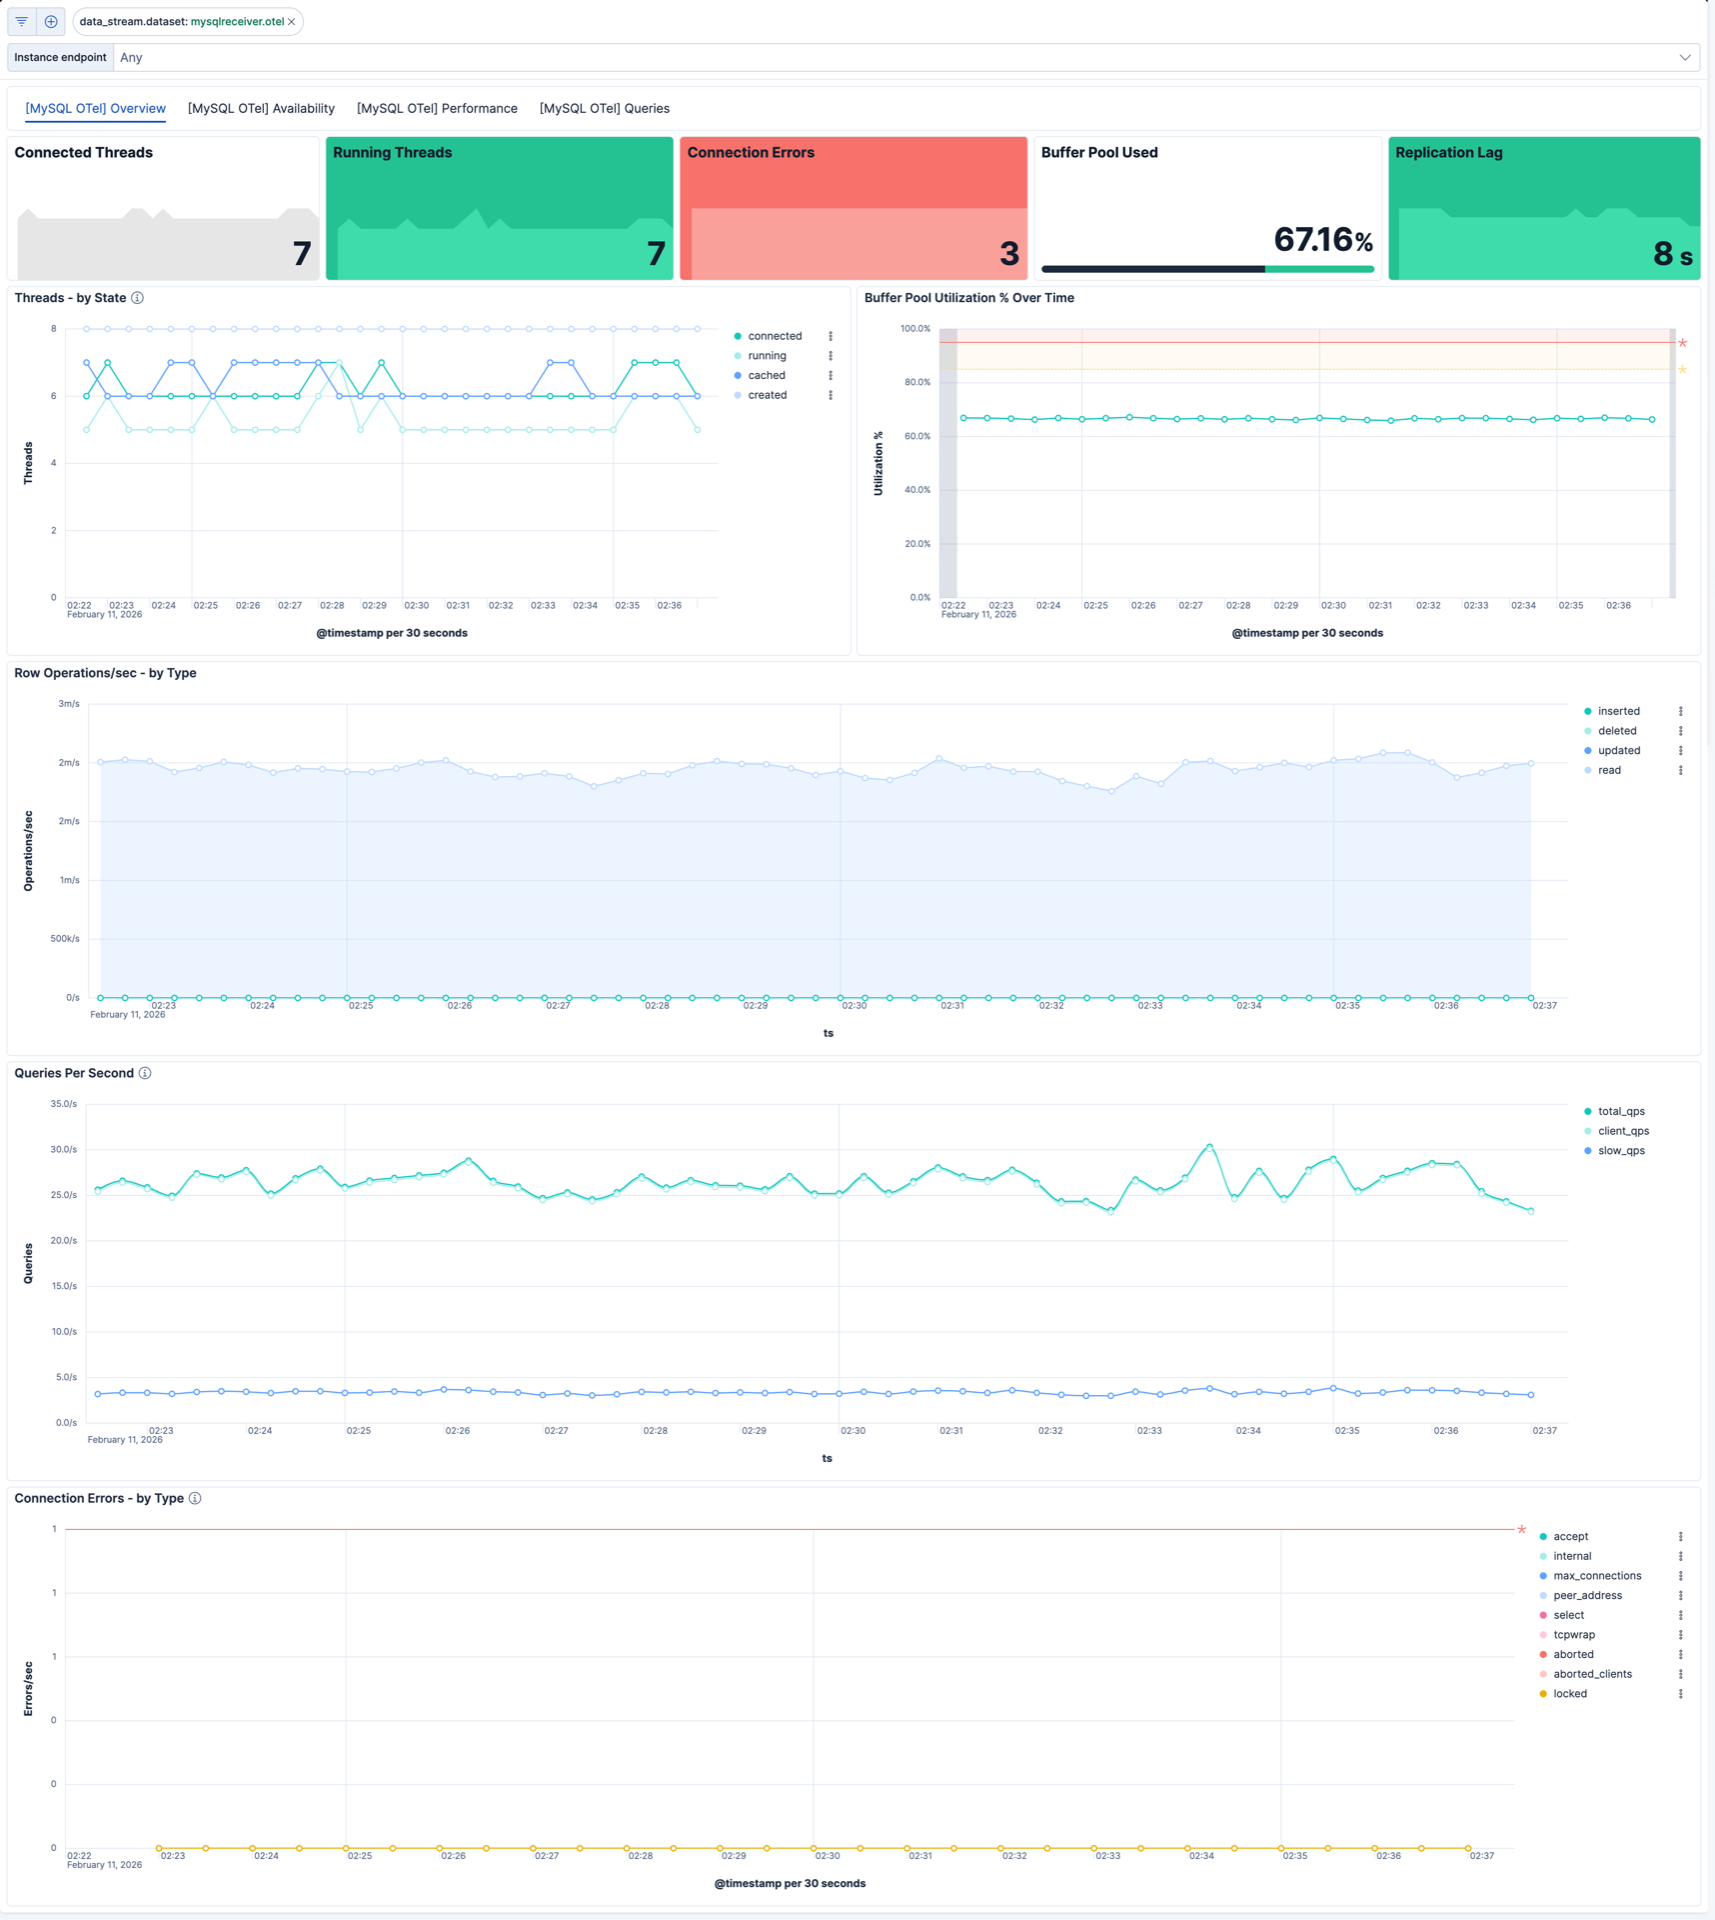
| [MySQL OTel] Overview | High-level view of threads, buffer pool utilization, row operations, connection errors, and query throughput. |
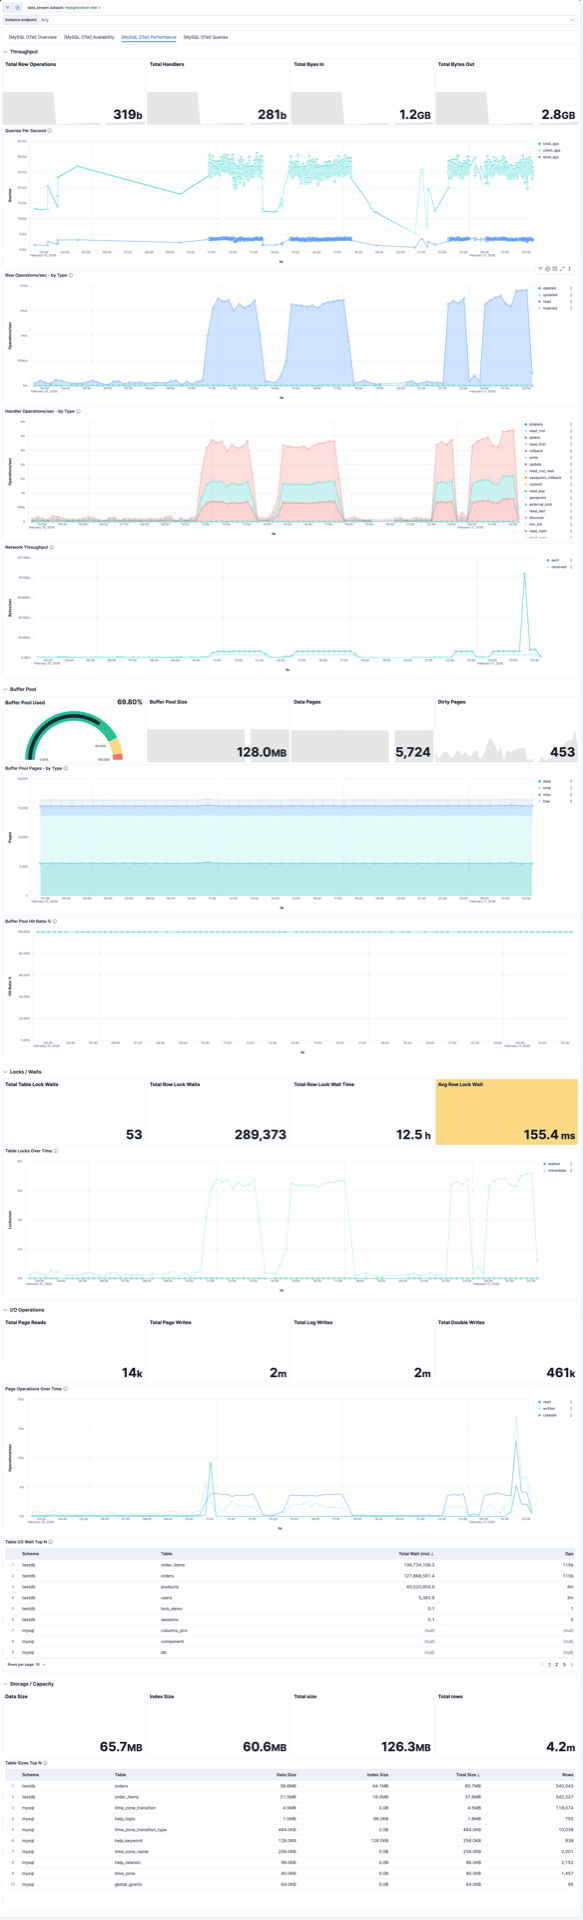
| [MySQL OTel] Performance | Throughput, buffer pool, locks, I/O operations, and storage metrics for performance analysis. |
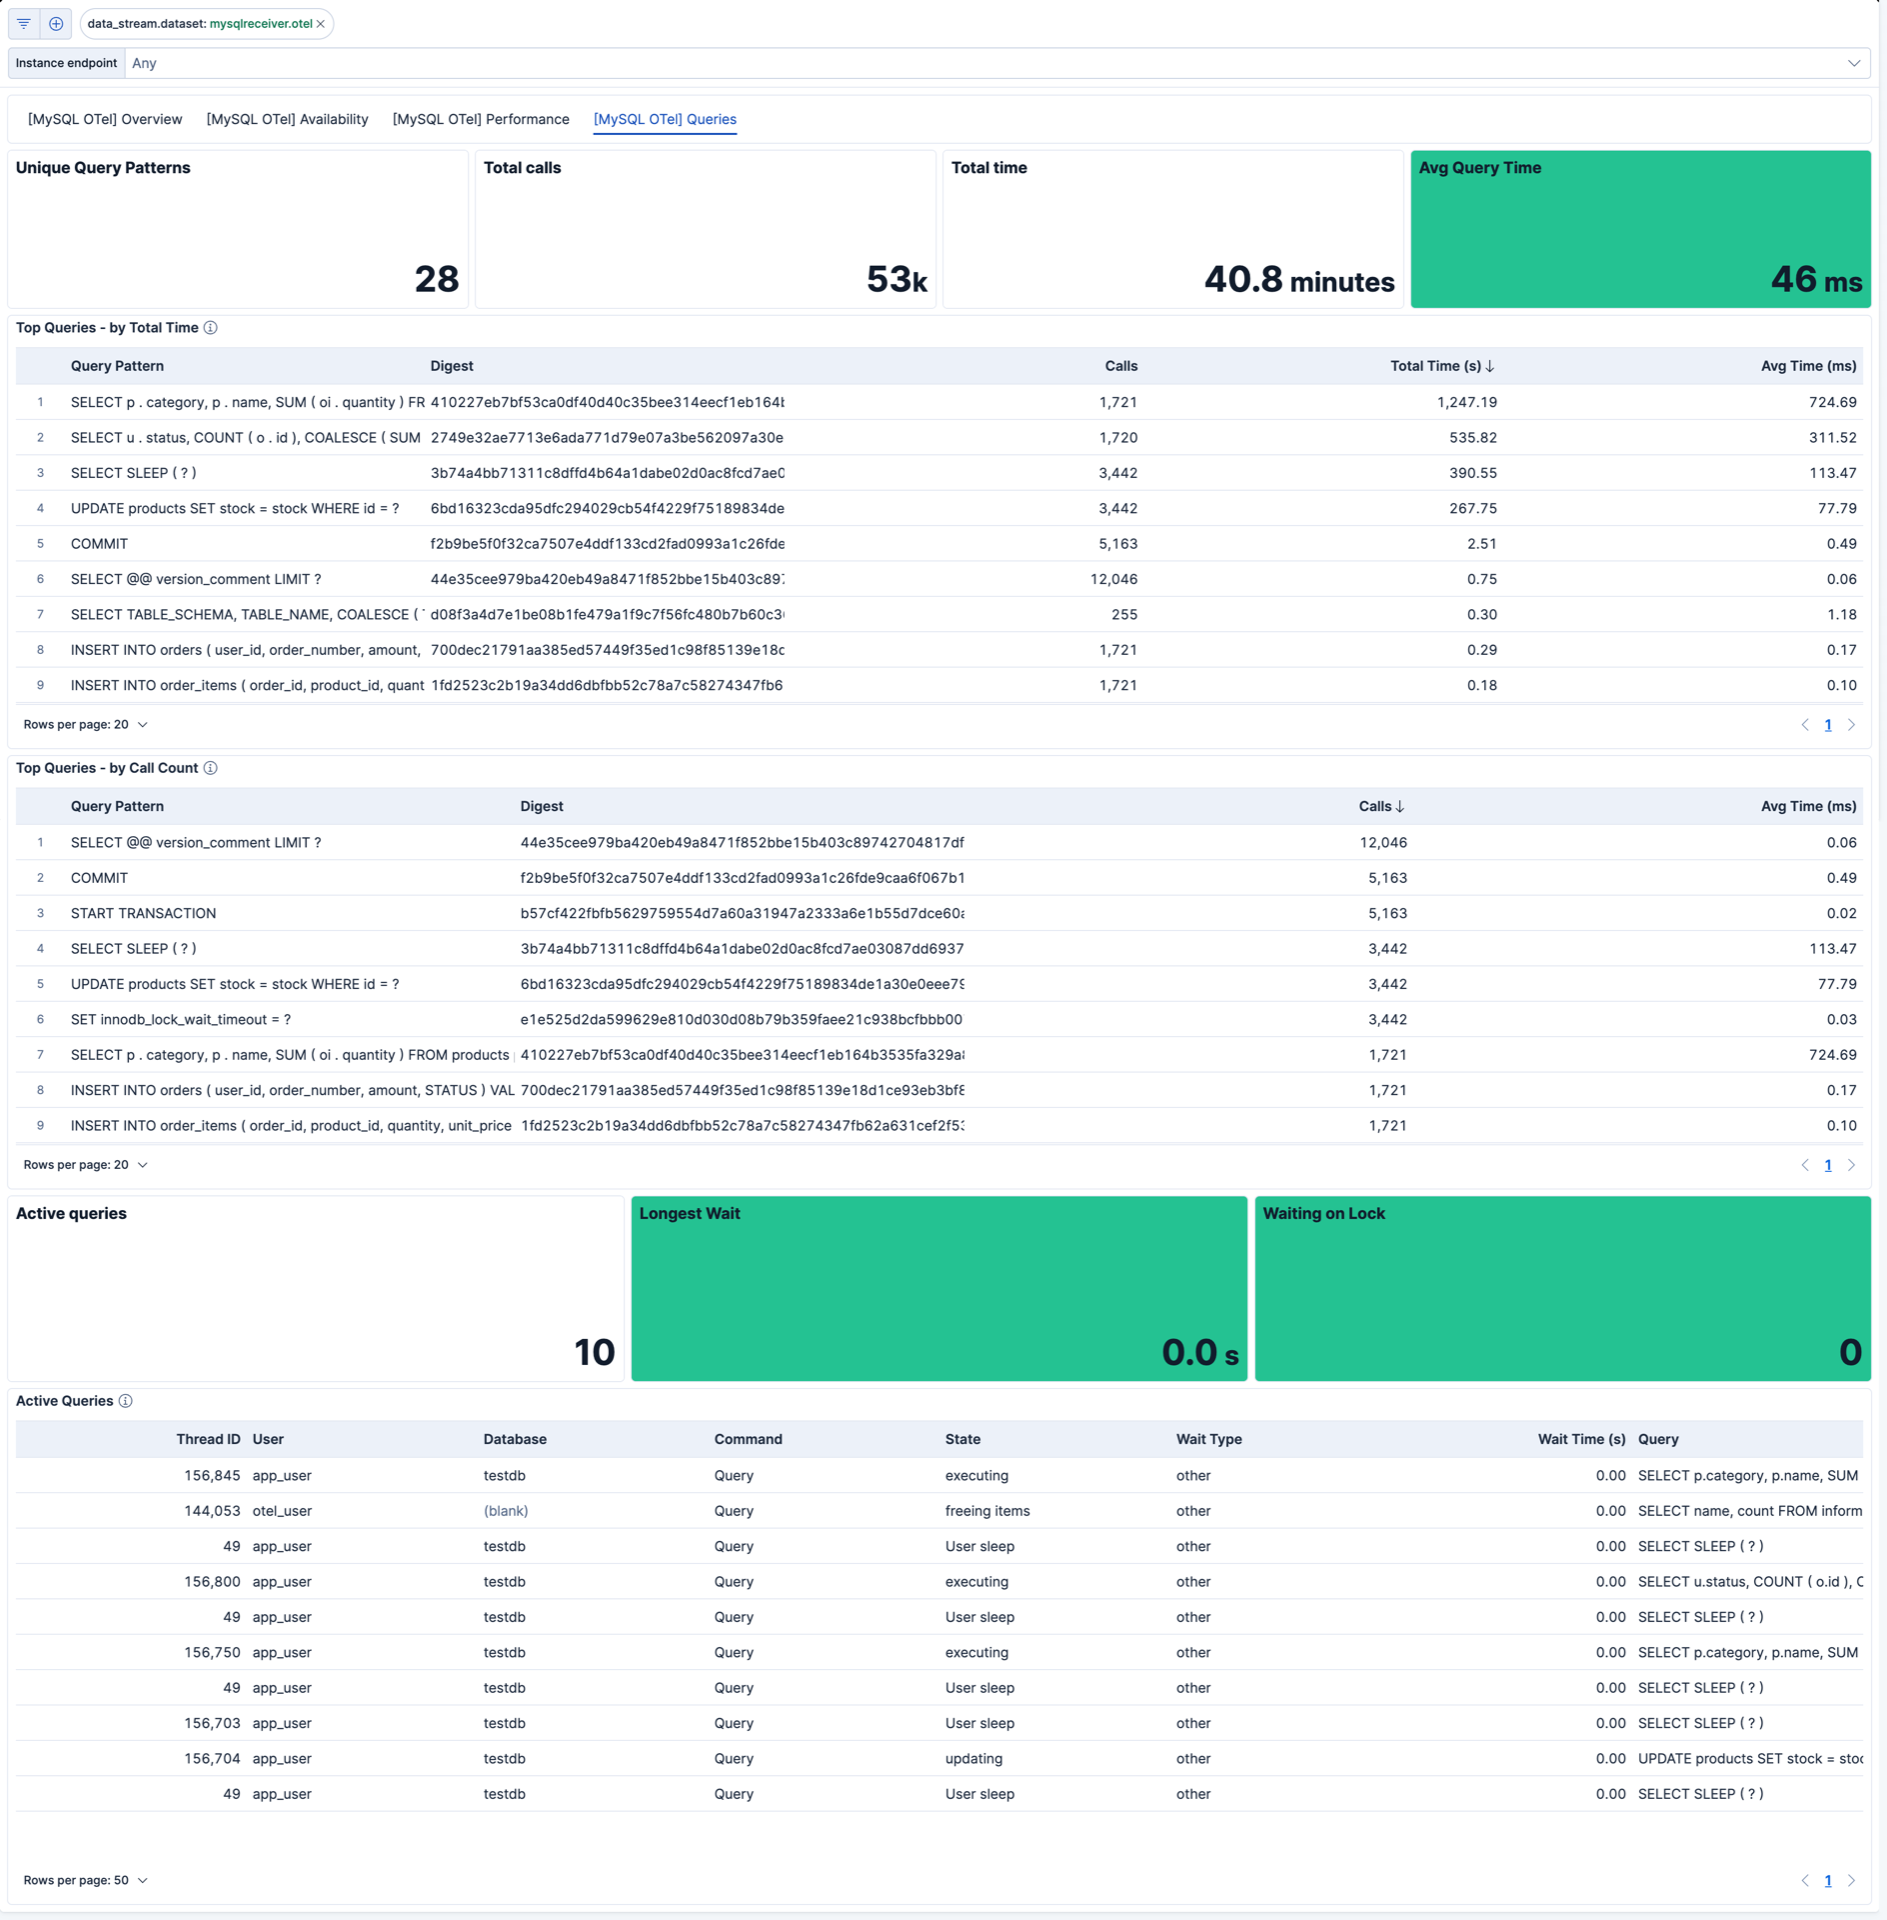
| [MySQL OTel] Queries | Active queries, top queries by time and call count, and query samples from logs. |
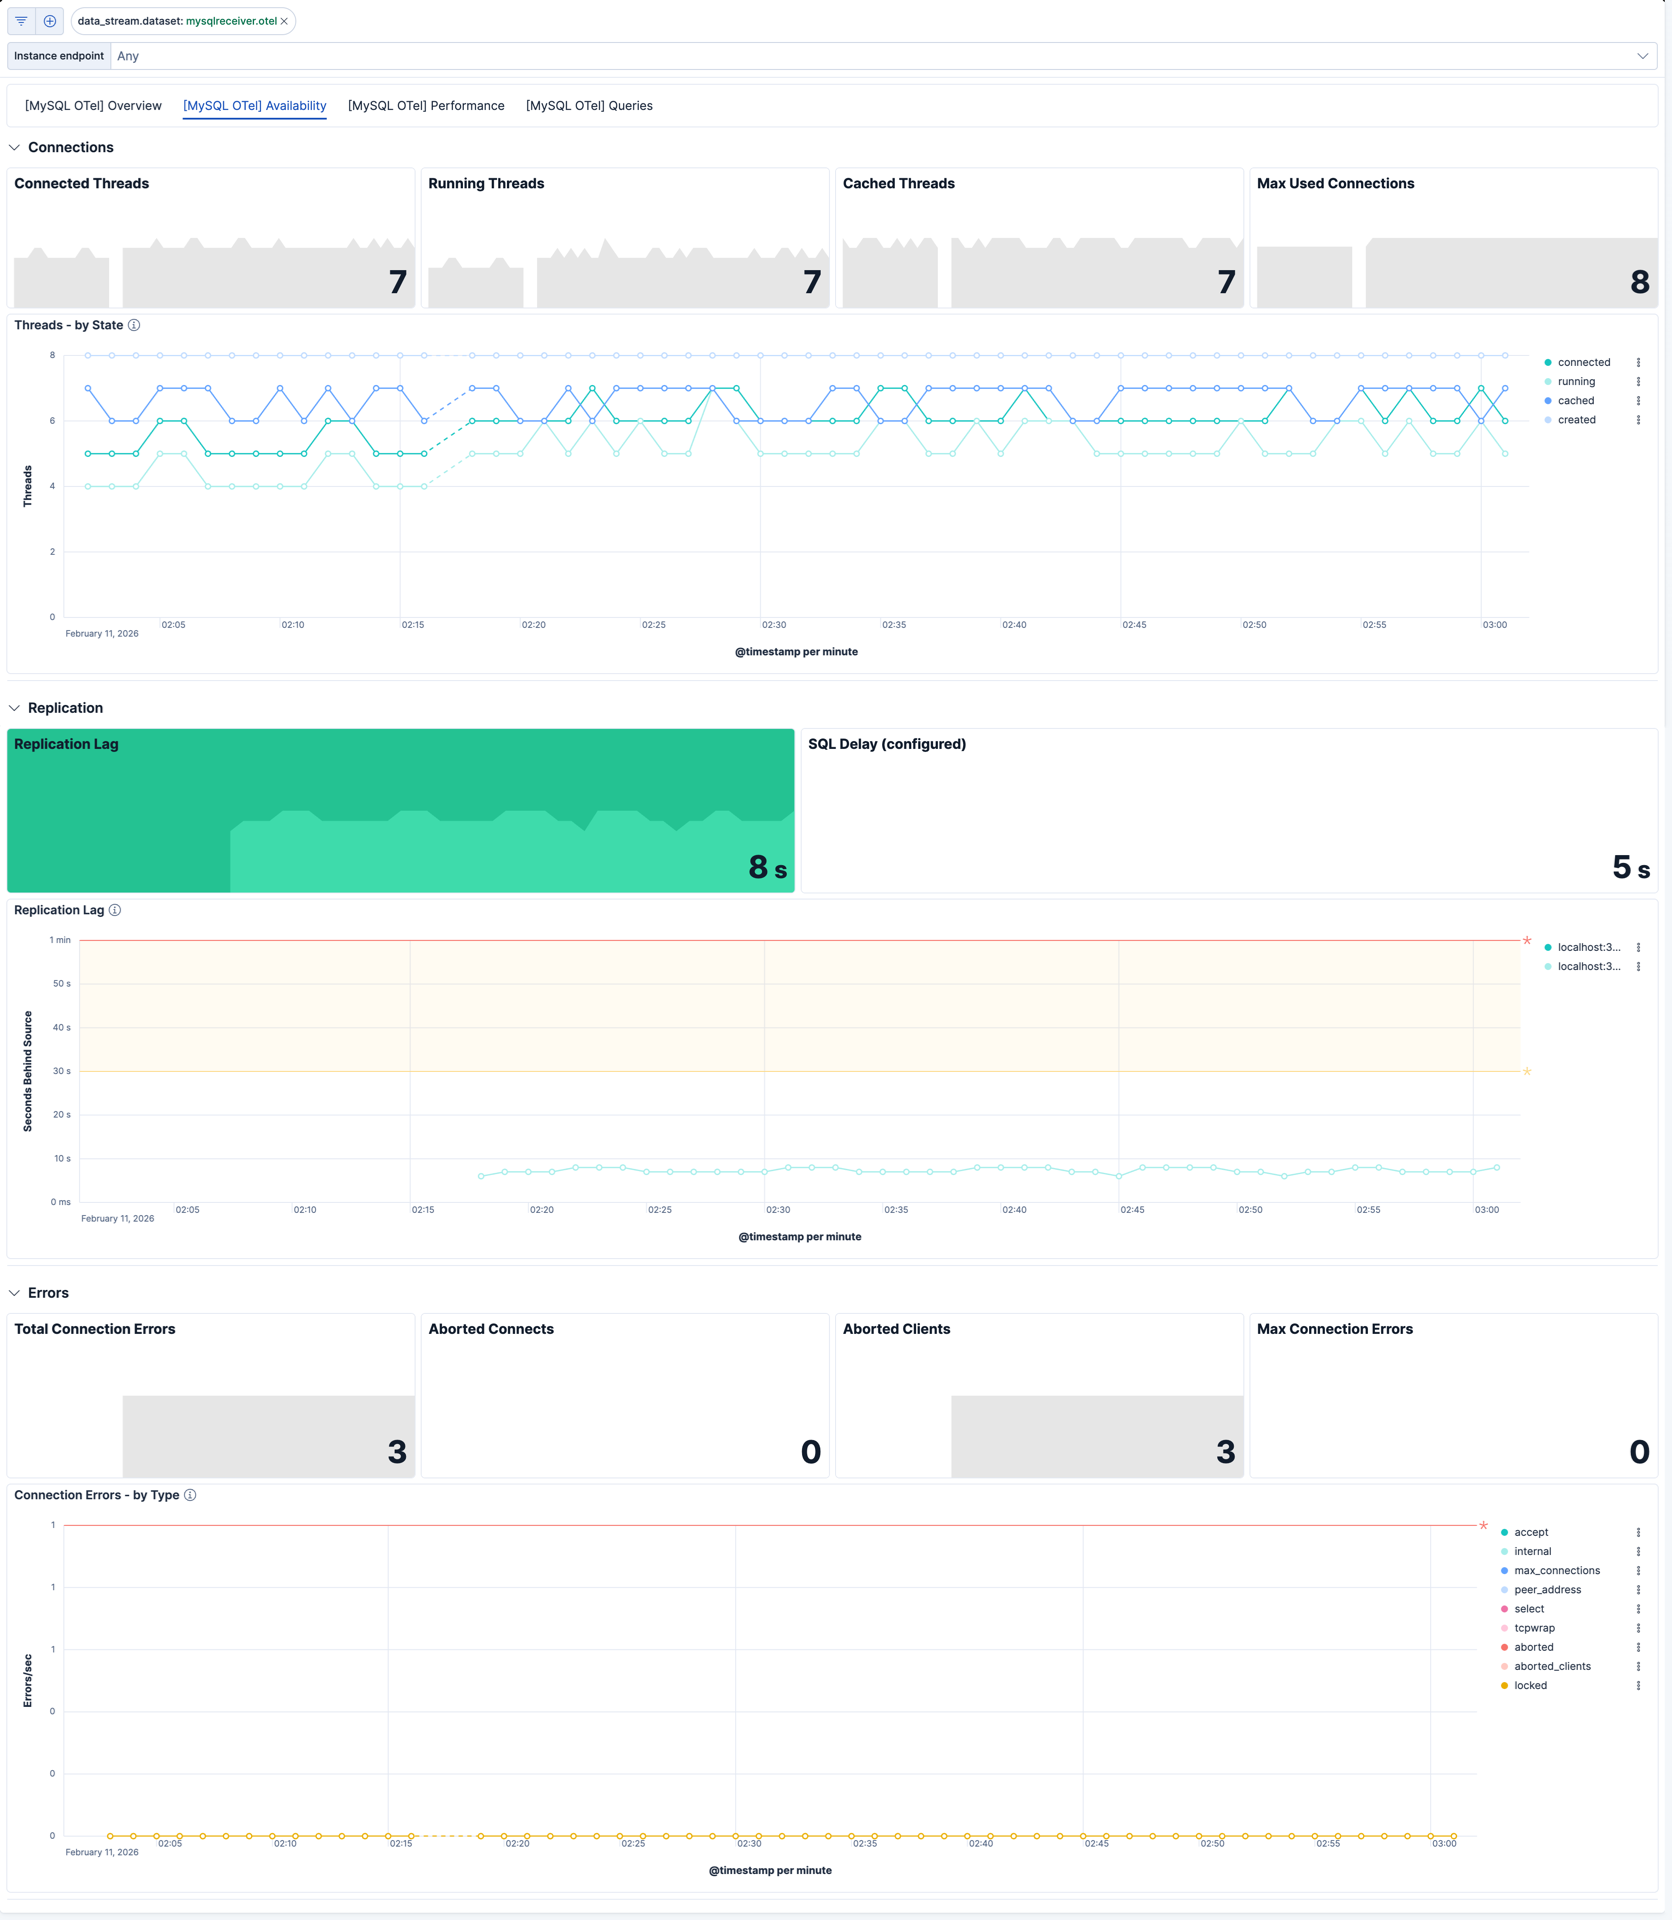
| [MySQL OTel] Availability | Thread states, replication lag, and connection errors for availability monitoring. |
| Alert | Trigger | Severity |
|---|---|---|
| [MySQL OTel] High connection error rate | More than 5 connection errors by type in a 15-minute window | High |
| [MySQL OTel] High slow query rate | More than 10 slow queries in a 15-minute window | High |
| [MySQL OTel] Thread saturation | Running-to-connected thread ratio exceeds 0.9 with at least 5 connected threads | Medium |
| [MySQL OTel] Replication lag | Replica lag exceeds 60 seconds | High |
| [MySQL OTel] High buffer pool dirty page ratio | Dirty page ratio exceeds 75% of buffer pool usage | Medium |
| [MySQL OTel] High row lock contention | More than 100 row lock waits in a 15-minute window | Medium |
SLO templates require Elastic Stack version 9.4.0 or later.
| SLO | Target | Window | Description |
|---|---|---|---|
| [MySQL OTel] Replication lag 99.5% rolling 30 days | 99.5% | 30-day rolling | Ensures replica lag stays below 5 seconds in 99.5% of 1-minute intervals. |
| [MySQL OTel] Connection exhaustion errors 99.0% rolling 30 days | 99.0% | 30-day rolling | Ensures max_connections errors stay below 5 per minute in 99.0% of 1-minute intervals. |
| [MySQL OTel] Slow queries 99.0% rolling 30 days | 99.0% | 30-day rolling | Ensures slow query count stays below 10 per minute in 99.0% of 1-minute intervals. |
| [MySQL OTel] Connected threads 99.0% rolling 30 days | 99.0% | 30-day rolling | Ensures connected threads stay below 800 in 99.0% of 1-minute intervals. |
This integration includes one or more Kibana dashboards that visualizes the data collected by the integration. The screenshots below illustrate how the ingested data is displayed.
Changelog
| Version | Details | Minimum Kibana version |
|---|---|---|
| 0.6.1 | Enhancement (View pull request) Add group field to package manifest. |
9.4.0 |
| 0.6.0 | Enhancement (View pull request) Add tags to Kibana assets |
9.4.0 |
| 0.5.0 | Enhancement (View pull request) Add description and artifact fields to alerting rule template. |
9.4.0 |
| 0.4.0 | Enhancement (View pull request) Add alerting rule templates and SLO templates. |
9.3.0 |
| 0.3.0 | Enhancement (View pull request) Revamp the dashboards to provide a much more comprehensive and user-friendly experience. |
9.2.0 |
| 0.2.0 | Enhancement (View pull request) Add discovery field to support auto-install |
9.2.0 |
| 0.1.2 | Enhancement (View pull request) Add opentelemetry category |
9.1.0 |
| 0.1.1 | Bug fix (View pull request) Remove mentions of "Content Pack" and EDOT Collector from README |
9.1.0 |
| 0.1.0 | Enhancement (View pull request) Initial draft of the MySQL OTEL content package |
9.1.0 |