Nagios XI
Elastic Cloud Serverless projects are autoscaled environments, fully managed by Elastic and available on Elastic Cloud. Availability This functionality is generally available and ready for production usage. Elastic Cloud Serverless projects are autoscaled environments, fully managed by Elastic and available on Elastic Cloud. Availability This functionality is generally available and ready for production usage. The Elastic Stack includes Elastic's core products such as Elasticsearch, Kibana, Logstash, and Beats. Availability This functionality is generally available and ready for production usage. Unless stated otherwise on the page, this functionality is available when your Elastic Stack is deployed on Elastic Cloud Hosted, Elastic Cloud Enterprise, Elastic Cloud on Kubernetes, and self-managed environments. This documentation corresponds to the latest patch available for each minor version. If you're not using the latest patch, check the release notes for changes.
Serverless Observability
Generally available
Serverless Security
Generally available
Stack
9.0+
Generally available since 9.0
| Version | 1.8.0 (View all) |
| Subscription level What's this? |
Basic |
| Developed by What's this? |
Elastic |
| Ingestion method(s) | API |
| Minimum Kibana version(s) | 9.0.0 8.13.0 |
The Nagios XI integration is used to fetch observability data from Nagios XI and ingest it into Elasticsearch.
Use the Nagios XI integration to:
- Collect metrics on current load, users, ping, HTTP, SSH, root partition, swap users, total processes, round-trip time, and packet loss, along with system event logs.
- Create visualizations to monitor, measure, and analyze usage trends and key data for business insights.
- Set up alerts to minimize Mean Time to Detect (MTTD) and Mean Time to Resolve (MTTR) by quickly referencing relevant logs during troubleshooting.
The Nagios XI integration collects logs and metrics data.
Logs provide insights into operations and events within the Nagios XI environment. The log data stream collected by the Nagios XI integration is events. This allows you to track system events, understand their causes, and address issues related to infrastructure monitoring and alert management.
Metrics provide insights into the performance and health of your Nagios XI instance. The Nagios XI integration collects host and service metric data streams. These metrics enable you to monitor and troubleshoot the performance of hosts and services within your Nagios XI environment, covering aspects such as network round trip time, packet loss, service load, user count, and other critical indicators.
Data streams:
events: Provides Nagios XI system event logs.host: Provides Nagios XI Host Round Trip Travel Time (rta) and Packet Loss (pl) metrics.service: Provides Nagios XI service metrics by default, including current load, current users, ping, HTTP, SSH, root partition, swap users, and total processes.
Note:
You can monitor and view logs from the ingested documents for Nagios XI in the logs-* index pattern in Discover. For metrics, the index pattern is metrics-*.
This integration has been tested against Nagios-XI Version: 5.8.7
You need Elasticsearch for storing and searching your data and Kibana for visualizing and managing it. You can use our hosted Elasticsearch Service on Elastic Cloud, which is recommended, or self-manage the Elastic Stack on your own hardware.
You have two options for deploying Elasticsearch and Kibana:
- Elastic Cloud (Recommended): Fully managed and hosted by Elastic.
- Self-Managed: Deploy and manage the Elastic Stack on your own hardware.
To ingest data from Nagios XI, you must know the host for Nagios XI and add that host when configuring the integration package.
For step-by-step instructions on how to set up an integration, check the Getting started guide.
- After configuring the integration, go to the Assets tab in the Nagios XI Integration.
- You should see a list of available dashboards.
- Click on the dashboard corresponding to your configured data stream.
- Verify that the dashboard is populated with the expected data.
This is the events data stream.
- This data stream gives Nagios XI system event logs.
Example
{
    "@timestamp": "2022-03-16T07:02:41.000Z",
    "agent": {
        "ephemeral_id": "790d850b-4350-494f-bc9a-fa00fd887ba7",
        "id": "476beedd-c7de-4696-a85b-d20aa455d46a",
        "name": "docker-fleet-agent",
        "type": "filebeat",
        "version": "8.12.0"
    },
    "data_stream": {
        "dataset": "nagios_xi.events",
        "namespace": "ep",
        "type": "logs"
    },
    "ecs": {
        "version": "8.11.0"
    },
    "elastic_agent": {
        "id": "476beedd-c7de-4696-a85b-d20aa455d46a",
        "snapshot": false,
        "version": "8.12.0"
    },
    "event": {
        "agent_id_status": "verified",
        "created": "2024-05-28T09:49:34.927Z",
        "dataset": "nagios_xi.events",
        "ingested": "2024-05-28T09:49:45Z",
        "kind": "event",
        "module": "nagios_xi",
        "original": "{\"entry_time\":\"2022-03-16 07:02:41\",\"instance_id\":\"1\",\"logentry_data\":\"Event broker module '/usr/local/nagios/bin/ndo.so' initialized successfully.\",\"logentry_id\":\"211261\",\"logentry_type\":\"262144\"}",
        "type": [
            "info"
        ]
    },
    "input": {
        "type": "httpjson"
    },
    "message": "Event broker module '/usr/local/nagios/bin/ndo.so' initialized successfully.",
    "nagios_xi": {
        "event": {
            "entry_time": "2022-03-16T07:02:41.000Z",
            "instance_id": 1,
            "logentry": {
                "id": 211261,
                "type": 262144
            }
        }
    },
    "tags": [
        "preserve_original_event",
        "forwarded",
        "nagios_xi-events"
    ]
}
ECS Field Reference
Please refer to the following document for detailed information on ECS fields.
Exported fields
| Field | Description | Type |
|---|---|---|
| @timestamp | Event timestamp. | date |
| data_stream.dataset | Data stream dataset. | constant_keyword |
| data_stream.namespace | Data stream namespace. | constant_keyword |
| data_stream.type | Data stream type. | constant_keyword |
| input.type | Type of Filebeat input. | keyword |
| nagios_xi.event.entry_time | Log entry time | keyword |
| nagios_xi.event.instance_id | Instace ID of current instance | double |
| nagios_xi.event.logentry.id | Logentry ID | double |
| nagios_xi.event.logentry.type | Logentry type | double |
This is the host data stream.
- This data stream gives Nagios XI Host Round Trip Travel Time (rta) and Packet Loss (pl) metrics.
Example
{
    "@timestamp": "2022-03-16T07:02:42.000Z",
    "agent": {
        "ephemeral_id": "84e30ad8-df37-4fbf-aefc-ce7580f82ad0",
        "id": "476beedd-c7de-4696-a85b-d20aa455d46a",
        "name": "docker-fleet-agent",
        "type": "filebeat",
        "version": "8.12.0"
    },
    "data_stream": {
        "dataset": "nagios_xi.host",
        "namespace": "ep",
        "type": "logs"
    },
    "ecs": {
        "version": "8.11.0"
    },
    "elastic_agent": {
        "id": "476beedd-c7de-4696-a85b-d20aa455d46a",
        "snapshot": false,
        "version": "8.12.0"
    },
    "event": {
        "agent_id_status": "verified",
        "created": "2024-05-28T09:50:27.235Z",
        "dataset": "nagios_xi.host",
        "ingested": "2024-05-28T09:50:37Z",
        "kind": "metric",
        "module": "nagios_xi",
        "original": "{\"acknowledgement_type\":\"0\",\"action_url\":\"\",\"active_checks_enabled\":\"0\",\"address\":\"www.nagios.org\",\"check_command\":\"check_dummy!0!\\\"No data received yet.\\\"\",\"check_options\":\"0\",\"check_timeperiod_object_id\":\"71\",\"check_type\":\"1\",\"current_check_attempt\":\"1\",\"current_notification_number\":\"0\",\"current_state\":\"0\",\"display_name\":\"www.nagios.org\",\"event_handler\":\"\",\"event_handler_enabled\":\"1\",\"execution_time\":\"0\",\"failure_prediction_enabled\":\"0\",\"flap_detection_enabled\":\"1\",\"has_been_checked\":\"1\",\"host_alias\":\"www.nagios.org\",\"host_name\":\"www.nagios.org\",\"host_object_id\":\"423\",\"hoststatus_id\":\"58\",\"icon_image\":\"passiveobject.png\",\"icon_image_alt\":\"\",\"instance_id\":\"1\",\"is_flapping\":\"0\",\"last_check\":\"2020-08-04 10:07:54\",\"last_hard_state\":\"0\",\"last_hard_state_change\":\"2018-07-12 14:59:46\",\"last_notification\":\"1969-12-31 18:00:00\",\"last_state_change\":\"2015-07-13 21:09:35\",\"last_time_down\":\"1969-12-31 18:00:00\",\"last_time_unreachable\":\"1969-12-31 18:00:00\",\"last_time_up\":\"2020-08-04 10:07:54\",\"latency\":\"0\",\"long_output\":\"\",\"max_check_attempts\":\"5\",\"modified_host_attributes\":\"0\",\"next_check\":\"1969-12-31 18:00:00\",\"next_notification\":\"1969-12-31 18:00:00\",\"no_more_notifications\":\"0\",\"normal_check_interval\":\"5\",\"notes\":\"\",\"notes_url\":\"\",\"notifications_enabled\":\"1\",\"obsess_over_host\":\"1\",\"output\":\"HTTP OK: HTTP/1.1 301 Moved Permanently - 461 bytes in 0.123 second response time\",\"passive_checks_enabled\":\"1\",\"percent_state_change\":\"0\",\"perfdata\":\"time=0.122797s;;;0.000000 size=461B;;;0\",\"problem_has_been_acknowledged\":\"0\",\"process_performance_data\":\"1\",\"retry_check_interval\":\"1\",\"scheduled_downtime_depth\":\"0\",\"should_be_scheduled\":\"0\",\"state_type\":\"1\",\"status_update_time\":\"2022-03-16 07:02:42\"}",
        "type": [
            "info"
        ]
    },
    "input": {
        "type": "httpjson"
    },
    "nagios_xi": {
        "host": {
            "acknowledgement_type": "0",
            "active_checks_enabled": "0",
            "address": "www.nagios.org",
            "check_command": "check_dummy!0!\"No data received yet.\"",
            "check_options": "0",
            "check_timeperiod_object_id": "71",
            "check_type": "1",
            "current_check_attempt": "1",
            "current_notification_number": "0",
            "current_state": "Up/Pending",
            "display_name": "www.nagios.org",
            "event_handler_enabled": "1",
            "execution_time": 0,
            "failure_prediction_enabled": "0",
            "flap_detection_enabled": "1",
            "has_been_checked": "1",
            "host_alias": "www.nagios.org",
            "host_name": "www.nagios.org",
            "host_object_id": "423",
            "hoststatus_id": "58",
            "icon_image": "passiveobject.png",
            "instance_id": "1",
            "is_flapping": "0",
            "last_check": "2020-08-04T10:07:54.000Z",
            "last_hard_state": "0",
            "last_hard_state_change": "2018-07-12T14:59:46.000Z",
            "last_notification": "1969-12-31T18:00:00.000Z",
            "last_state_change": "2015-07-13T21:09:35.000Z",
            "last_time_down": "1969-12-31T18:00:00.000Z",
            "last_time_unreachable": "1969-12-31T18:00:00.000Z",
            "last_time_up": "2020-08-04T10:07:54.000Z",
            "latency": 0,
            "max_check_attempts": "5",
            "modified_host_attributes": "0",
            "next_check": "1969-12-31T18:00:00.000Z",
            "next_notification": "1969-12-31T18:00:00.000Z",
            "no_more_notifications": "0",
            "normal_check_interval": 5,
            "notifications_enabled": "1",
            "obsess_over_host": "1",
            "output": "HTTP OK: HTTP/1.1 301 Moved Permanently - 461 bytes in 0.123 second response time",
            "passive_checks_enabled": "1",
            "percent_state_change": "0",
            "performance_data": {
                "size": 461,
                "time": 0.122797
            },
            "problem_has_been_acknowledged": "0",
            "process_performance_data": "1",
            "retry_check_interval": 1,
            "scheduled_downtime_depth": "0",
            "should_be_scheduled": "0",
            "state_type": "1",
            "status_update_time": "2022-03-16T07:02:42.000Z"
        }
    },
    "tags": [
        "preserve_original_event",
        "forwarded",
        "nagios_xi-host"
    ]
}
ECS Field Reference
Please refer to the following document for detailed information on ECS fields.
Exported fields
| Field | Description | Type |
|---|---|---|
| @timestamp | Event timestamp. | date |
| data_stream.dataset | Data stream dataset. | constant_keyword |
| data_stream.namespace | Data stream namespace. | constant_keyword |
| data_stream.type | Data stream type. | constant_keyword |
| input.type | Type of Filebeat input. | keyword |
| nagios_xi.host.acknowledgement_type | The acknowledgement_type column can be either 0, 1, or 2 which represent None, Normal, or Sticky, respectively. | keyword |
| nagios_xi.host.action_url | This is used to define an optional URL that can be used to provide more actions to be performed on the host. | keyword |
| nagios_xi.host.active_checks_enabled | This is used to determine whether or not active checks (either regularly scheduled or on-demand) of this host are enabled. Values=> 0 = disable active host checks, 1 = enable active host checks (default). | keyword |
| nagios_xi.host.address | This is used to define the address of the host. Normally, this is an IP address, although it could really be anything user want (so long as it can be used to check the status of the host). | keyword |
| nagios_xi.host.check_command | This is used to specify the short name of the command that should be used to check if the host is up or down. Typically, this command would try and ping the host to see if it is "alive". | keyword |
| nagios_xi.host.check_options | Refers to the various parameters and settings that can be configured for a specific check command or plugin. | keyword |
| nagios_xi.host.check_timeperiod_object_id | Refers to the identifier of a time period object used for scheduling checks and notifications within the monitoring system. | keyword |
| nagios_xi.host.check_type | Refers to the type or category of the monitoring check being performed on a particular host. | keyword |
| nagios_xi.host.current_check_attempt | Refers to the current attempt number of a particular check being executed on a monitored host. | keyword |
| nagios_xi.host.current_notification_number | Refers to the current number of the notifications being sent out by the system for a particular host. | keyword |
| nagios_xi.host.current_state | This is used to check the current status of the host. | keyword |
| nagios_xi.host.display_name | This is used to define an alternate name that should be displayed in the web interface for this host. | keyword |
| nagios_xi.host.event_handler | This is used to specify the short name of the command that should be run whenever a change in the state of the host is detected (i.e. whenever it goes down or recovers). | keyword |
| nagios_xi.host.event_handler_enabled | This is used to determine whether or not the event handler for this host is enabled. Values=> 0 = disable host event handler, 1 = enable host event handler. | keyword |
| nagios_xi.host.execution_time | Refers to the duration or elapsed time taken to execute a monitoring check on a specific host. | double |
| nagios_xi.host.failure_prediction_enabled | Refers to a configuration setting that determines whether failure prediction is enabled for a specific host or not. | keyword |
| nagios_xi.host.flap_detection_enabled | This is used to determine whether or not flap detection is enabled for this host. More information on flap detection can be found here. Values=> 0 = disable host flap detection, 1 = enable host flap detection. | keyword |
| nagios_xi.host.has_been_checked | Refers to a flag or attribute that indicates whether a particular host has been checked during the current monitoring cycle. | keyword |
| nagios_xi.host.host_alias | This is used to define a longer name or description used to identify the host. | keyword |
| nagios_xi.host.host_name | This is used to define a short name used to identify the host. It is used in host group and service definitions to reference this particular host. | keyword |
| nagios_xi.host.host_object_id | Refers to the unique identifier assigned to a host object within the monitoring system. | keyword |
| nagios_xi.host.hoststatus_id | Refers to the unique identifier assigned to a host status entry in the monitoring system. | keyword |
| nagios_xi.host.icon_image | This variable is used to define the name of a GIF, PNG, or JPG image that should be associated with this host. This image will be displayed in the various places in the CGIs. | keyword |
| nagios_xi.host.icon_image_alt | This variable is used to define an optional string that is used in the ALT tag of the image specified by the <icon_image> argument. | keyword |
| nagios_xi.host.instance_id | Refers to a unique identifier assigned to an instance of Nagios XI or a specific component within the Nagios XI system. | keyword |
| nagios_xi.host.is_flapping | Refers to a flag or attribute that indicates whether a particular host is experiencing flapping. | keyword |
| nagios_xi.host.last_check | Refers to the timestamp indicating the most recent time when a host was checked during the monitoring process. | date |
| nagios_xi.host.last_hard_state | Refers to the last known "hard state" of a host during the monitoring process. | keyword |
| nagios_xi.host.last_hard_state_change | Refers to the timestamp indicating the most recent time when the hard state of a host changed. | date |
| nagios_xi.host.last_notification | Refers to the timestamp indicating the most recent time when a notification was sent for a particular host. | date |
| nagios_xi.host.last_state_change | Refers to the timestamp indicating the most recent time when a host experienced a change in its overall state. | date |
| nagios_xi.host.last_time_down | Refers to the timestamp indicating the most recent time when a host was detected as being in a "down" state. | date |
| nagios_xi.host.last_time_unreachable | Refers to the timestamp indicating the most recent time when a host was detected as being "unreachable." | date |
| nagios_xi.host.last_time_up | Refers to the timestamp indicating the most recent time when a host was detected as being in an "up" state. | date |
| nagios_xi.host.latency | Refers to the measure of the time it takes for a monitoring check to be performed and for the result to be obtained from the monitored host. | double |
| nagios_xi.host.long_output | Refers to the detailed description or additional information associated with a host check result. It provides more specific and comprehensive details about the status or condition of the monitored object. | keyword |
| nagios_xi.host.max_check_attempts | This is used to define the number of times that Nagios will retry the host check command if it returns any state other than an OK state. | keyword |
| nagios_xi.host.modified_host_attributes | Refers to the set of host attributes or properties that have been manually modified or overridden by the administrator or user, deviating from the default configuration. | keyword |
| nagios_xi.host.next_check | Refers to the timestamp indicating the scheduled time for the next check to be performed on a host. | date |
| nagios_xi.host.next_notification | Refers to the timestamp indicating the scheduled time for the next notification to be sent for a particular host. | date |
| nagios_xi.host.no_more_notifications | This is used in specific scenarios when it is necessary to prevent additional notifications from being sent for a host. | keyword |
| nagios_xi.host.normal_check_interval | This is used to define the number of "time units" between regularly scheduled checks of the host. | long |
| nagios_xi.host.notes | This is used to define an optional string of notes pertaining to the host. | keyword |
| nagios_xi.host.notes_url | This variable is used to define an optional URL that can be used to provide more information about the host. | keyword |
| nagios_xi.host.notifications_enabled | This is used to determine whether or not notifications for this host are enabled. Values=> 0 = disable host notifications, 1 = enable host notifications. | keyword |
| nagios_xi.host.obsess_over_host | This determines whether or not checks for the host will be "obsessed" over using the ochp_command. | keyword |
| nagios_xi.host.output | Refers to the textual information or status message that is generated as the result of a host check. | keyword |
| nagios_xi.host.passive_checks_enabled | This is used to determine whether or not passive checks are enabled for this host. Values=> 0 = disable passive host checks, 1 = enable passive host checks (default). | keyword |
| nagios_xi.host.percent_state_change | Refers to a metric that represents the percentage of state changes that have occurred for a particular host within a specified time period. | keyword |
| nagios_xi.host.performance_data.pl | This shows Packet Loss for current host. | double |
| nagios_xi.host.performance_data.rta | This shows Round Trip Around for current host. | double |
| nagios_xi.host.performance_data.size | This shows Request Size for current host. | double |
| nagios_xi.host.performance_data.time | This shows Time taken while request for current host. | double |
| nagios_xi.host.problem_has_been_acknowledged | This is a flag or attribute associated with a host that indicates whether a particular problem or issue has been acknowledged by an administrator or user. | keyword |
| nagios_xi.host.process_performance_data | This is used to determine whether or not the processing of performance data is enabled for this host. Values=> 0 = disable performance data processing, 1 = enable performance data processing. | keyword |
| nagios_xi.host.retry_check_interval | This is used to define the number of "time units" to wait before scheduling a re-check of the hosts. Hosts are rescheduled at the retry interval when they have changed to a non-UP state. | long |
| nagios_xi.host.scheduled_downtime_depth | Refers to the number of active scheduled downtimes affecting a particular host. It indicates the depth or level of scheduled downtimes that have been applied to the object. | keyword |
| nagios_xi.host.should_be_scheduled | Refers to a flag or attribute associated with a host that indicates whether it should be included in the scheduling process for checks and notifications. | keyword |
| nagios_xi.host.state_type | Refers to a configuration setting that determines the behavior of how the state of a host is determined and interpreted in the monitoring process. | keyword |
| nagios_xi.host.status_update_time | Refers to the timestamp or time of the most recent status update for a host. It indicates the time when the current status of the object was last updated. | date |
This is the service dataset.
- This dataset gives Nagios XI services current load, current users, ping, http, ssh, root partition, swap users and total processes metrics by default.
- If the user enters a display name of a custom check command, then the integration would also fetch and index that but not parse/perform additional extractions. Additionally, the user can provide a custom processor through the configuration page if they are interested in parsing it
- If the user enters the host name and no display name, then similar to 1, the integration will fetch all the services from that host and index, but only parse the default one i.e the 8 services. The user can provide a custom processor in this case
- If the user enters both the host name and the display name, then the integration would only fetch those services with the entered display name and only from the entered hosts. It is not possible to fetch 1 service from host1 and another service from host2 in this case as it will fetch all the services from all the hosts that are configured
Example
{
    "@timestamp": "2022-03-17T00:02:42.000Z",
    "agent": {
        "ephemeral_id": "6d73e7be-ccdd-4b48-87c1-9c8fd1720026",
        "id": "476beedd-c7de-4696-a85b-d20aa455d46a",
        "name": "docker-fleet-agent",
        "type": "filebeat",
        "version": "8.12.0"
    },
    "data_stream": {
        "dataset": "nagios_xi.service",
        "namespace": "ep",
        "type": "logs"
    },
    "ecs": {
        "version": "8.11.0"
    },
    "elastic_agent": {
        "id": "476beedd-c7de-4696-a85b-d20aa455d46a",
        "snapshot": false,
        "version": "8.12.0"
    },
    "event": {
        "agent_id_status": "verified",
        "created": "2024-05-28T09:51:19.326Z",
        "dataset": "nagios_xi.service",
        "ingested": "2024-05-28T09:51:29Z",
        "kind": "metric",
        "module": "nagios_xi",
        "original": "{\"acknowledgement_type\":\"0\",\"action_url\":\"\",\"active_checks_enabled\":\"0\",\"check_command\":\"check_dummy!0!\\\"No data received yet.\\\"\",\"check_options\":\"0\",\"check_timeperiod_object_id\":\"71\",\"check_type\":\"1\",\"current_check_attempt\":\"1\",\"current_notification_number\":\"0\",\"current_state\":\"0\",\"display_name\":\"Bandwidth Spike\",\"event_handler\":\"\",\"event_handler_enabled\":\"1\",\"execution_time\":\"0\",\"failure_prediction_enabled\":\"0\",\"flap_detection_enabled\":\"0\",\"has_been_checked\":\"1\",\"host_address\":\"www.nagios.org\",\"host_alias\":\"www.nagios.org\",\"host_name\":\"www.nagios.org\",\"host_object_id\":\"423\",\"icon_image\":\"\",\"icon_image_alt\":\"\",\"instance_id\":\"1\",\"is_flapping\":\"0\",\"last_check\":\"2020-06-17 07:12:02\",\"last_hard_state\":\"0\",\"last_hard_state_change\":\"2020-06-08 12:04:54\",\"last_notification\":\"2020-06-08 12:04:55\",\"last_state_change\":\"2020-06-08 12:04:54\",\"last_time_critical\":\"2020-06-08 12:04:54\",\"last_time_ok\":\"2020-06-17 07:12:02\",\"last_time_unknown\":\"1969-12-31 18:00:00\",\"last_time_warning\":\"2019-04-02 11:23:34\",\"latency\":\"0\",\"long_output\":\"\",\"max_check_attempts\":\"1\",\"modified_service_attributes\":\"0\",\"next_check\":\"1969-12-31 18:00:00\",\"next_notification\":\"1969-12-31 18:00:00\",\"no_more_notifications\":\"0\",\"normal_check_interval\":\"1\",\"notes\":\"\",\"notes_url\":\"\",\"notifications_enabled\":\"1\",\"obsess_over_service\":\"1\",\"output\":\"OK: 21 MB/s reported\",\"passive_checks_enabled\":\"1\",\"percent_state_change\":\"11.58\",\"perfdata\":\"bandwidth=21;80;90\",\"problem_has_been_acknowledged\":\"0\",\"process_performance_data\":\"1\",\"retry_check_interval\":\"1\",\"scheduled_downtime_depth\":\"0\",\"service_description\":\"Bandwidth Spike\",\"service_object_id\":\"999\",\"servicestatus_id\":\"996\",\"should_be_scheduled\":\"0\",\"state_type\":\"1\",\"status_update_time\":\"2022-03-17 00:02:42\"}",
        "provider": "nagios_xi.custom",
        "type": [
            "info"
        ]
    },
    "input": {
        "type": "httpjson"
    },
    "nagios_xi": {
        "service": {
            "acknowledgement_type": "0",
            "active_checks_enabled": "0",
            "check_command": "check_dummy!0!\"No data received yet.\"",
            "check_options": "0",
            "check_timeperiod_object_id": "71",
            "check_type": "1",
            "current_check_attempt": "1",
            "current_notification_number": "0",
            "current_state": "Up/Pending",
            "event_handler_enabled": "1",
            "execution_time": 0,
            "failure_prediction_enabled": "0",
            "flap_detection_enabled": "0",
            "has_been_checked": "1",
            "host_address": "www.nagios.org",
            "host_alias": "www.nagios.org",
            "host_name": "www.nagios.org",
            "host_object_id": "423",
            "instance_id": "1",
            "is_flapping": "0",
            "last_check": "2020-06-17T07:12:02.000Z",
            "last_hard_state": "0",
            "last_hard_state_change": "2020-06-08T12:04:54.000Z",
            "last_notification": "2020-06-08T12:04:55.000Z",
            "last_state_change": "2020-06-08T12:04:54.000Z",
            "last_time_critical": "2020-06-08T12:04:54.000Z",
            "last_time_ok": "2020-06-17T07:12:02.000Z",
            "last_time_unknown": "1969-12-31T18:00:00.000Z",
            "last_time_warning": "2019-04-02T11:23:34.000Z",
            "latency": 0,
            "max_check_attempts": "1",
            "modified_service_attributes": "0",
            "next_check": "1969-12-31T18:00:00.000Z",
            "next_notification": "1969-12-31T18:00:00.000Z",
            "no_more_notifications": "0",
            "normal_check_interval": 1,
            "notifications_enabled": "1",
            "obsess_over_service": "1",
            "output": "OK: 21 MB/s reported",
            "passive_checks_enabled": "1",
            "percent_state_change": "11.58",
            "problem_has_been_acknowledged": "0",
            "process_performance_data": "1",
            "retry_check_interval": 1,
            "scheduled_downtime_depth": "0",
            "service_description": "Bandwidth Spike",
            "service_object_id": "999",
            "servicestatus_id": "996",
            "should_be_scheduled": "0",
            "state_type": "1",
            "status_update_time": "2022-03-17T00:02:42.000Z"
        }
    },
    "service": {
        "name": "Bandwidth Spike"
    },
    "tags": [
        "preserve_original_event",
        "forwarded",
        "nagios_xi-service"
    ]
}
ECS Field Reference
Refer to the following document for detailed information on ECS fields.
Exported fields
| Field | Description | Type |
|---|---|---|
| @timestamp | Event timestamp. | date |
| data_stream.dataset | Data stream dataset. | constant_keyword |
| data_stream.namespace | Data stream namespace. | constant_keyword |
| data_stream.type | Data stream type. | constant_keyword |
| input.type | Type of Filebeat input. | keyword |
| nagios_xi.service.acknowledgement_type | The acknowledgement_type column can be either 0, 1, or 2 which represent None, Normal, or Sticky, respectively. | keyword |
| nagios_xi.service.action_url | This is used to define an optional URL that can be used to provide more actions to be performed on the host. If you specify an URL, you will see a red "splat" icon in the CGIs (when you are viewing host information) that links to the URL you specify here. Any valid URL can be used. If you plan on using relative paths, the base path will the the same as what is used to access the CGIs (i.e. /cgi-bin/nagios/). | keyword |
| nagios_xi.service.active_checks_enabled | This is used to determine whether or not active checks (either regularly scheduled or on-demand) of this host are enabled. Values=> 0 = disable active host checks, 1 = enable active host checks (default). | keyword |
| nagios_xi.service.check_command | This is used to specify the short name of the command that should be used to check if the host is up or down. Typically, this command would try and ping the host to see if it is "alive". The command must return a status of OK (0) or Nagios will assume the host is down. If you leave this argument blank, the host will not be actively checked. Thus, Nagios will likely always assume the host is up (it may show up as being in a "PENDING" state in the web interface). This is useful if you are monitoring printers or other devices that are frequently turned off. The maximum amount of time that the notification command can run is controlled by the host_check_timeout option. | keyword |
| nagios_xi.service.check_options | Refers to the various parameters and settings that can be configured for a specific check command or plugin. | keyword |
| nagios_xi.service.check_timeperiod_object_id | Refers to the identifier of a time period object used for scheduling checks and notifications within the monitoring system. | keyword |
| nagios_xi.service.check_type | Refers to the type or category of the monitoring check being performed on a particular service. | keyword |
| nagios_xi.service.current_check_attempt | Refers to the current attempt number of a particular check being executed on a monitored service. | keyword |
| nagios_xi.service.current_load.load1 | Current Load in 1m. | double |
| nagios_xi.service.current_load.load15 | Current Load in 15m. | double |
| nagios_xi.service.current_load.load5 | Current Load in 5m. | double |
| nagios_xi.service.current_load.performance_data | Exact output of check_command. | keyword |
| nagios_xi.service.current_notification_number | Refers to the current number of the notifications being sent out by the system for a particular service. | keyword |
| nagios_xi.service.current_state | This is used to check the current status of the host. | keyword |
| nagios_xi.service.current_users.performance_data | Exact output of check_command. | keyword |
| nagios_xi.service.current_users.users | Current Users in host. | double |
| nagios_xi.service.custom.performance_data | Exact output of check_command. | keyword |
| nagios_xi.service.event_handler | This is used to specify the short name of the command that should be run whenever a change in the state of the host is detected (i.e. whenever it goes down or recovers). Read the documentation on event handlers for a more detailed explanation of how to write scripts for handling events. The maximum amount of time that the event handler command can run is controlled by the event_handler_timeout option. | keyword |
| nagios_xi.service.event_handler_enabled | This is used to determine whether or not the event handler for this host is enabled. Values=> 0 = disable host event handler, 1 = enable host event handler. | keyword |
| nagios_xi.service.execution_time | Refers to the duration or elapsed time taken to execute a monitoring check on a specific service. | double |
| nagios_xi.service.failure_prediction_enabled | Refers to a configuration setting that determines whether failure prediction is enabled for a specific host or not. | keyword |
| nagios_xi.service.flap_detection_enabled | This is used to determine whether or not flap detection is enabled for this host. More information on flap detection can be found here. Values=> 0 = disable host flap detection, 1 = enable host flap detection. | keyword |
| nagios_xi.service.has_been_checked | Refers to a flag or attribute that indicates whether a particular service has been checked during the current monitoring cycle. | keyword |
| nagios_xi.service.host_address | Refers to the IP address or network address associated with a specific host that is being monitored. | keyword |
| nagios_xi.service.host_alias | This is used to define a longer name or description used to identify the host. | keyword |
| nagios_xi.service.host_name | This is used to define a short name used to identify the host. It is used in host group and service definitions to reference this particular host. | keyword |
| nagios_xi.service.host_object_id | Refers to the unique identifier assigned to a host object within the monitoring system. | keyword |
| nagios_xi.service.http.performance_data | Exact output of check_command. | keyword |
| nagios_xi.service.http.size | Http byte size while request to host. | double |
| nagios_xi.service.http.time | Http Time taken while request to host. | double |
| nagios_xi.service.icon_image | This variable is used to define the name of a GIF, PNG, or JPG image that should be associated with this host. This image will be displayed in the various places in the CGIs. The image will look best if it is 40x40 pixels in size. Images for hosts are assumed to be in the logos/ subdirectory in your HTML images directory (i.e. /usr/local/nagios/share/images/logos). | keyword |
| nagios_xi.service.icon_image_alt | This variable is used to define an optional string that is used in the ALT tag of the image specified by the <icon_image> argument. | keyword |
| nagios_xi.service.instance_id | Refers to a unique identifier assigned to an instance of Nagios XI or a specific component within the Nagios XI system. | keyword |
| nagios_xi.service.is_flapping | Refers to a flag or attribute that indicates whether a particular service is experiencing flapping. | keyword |
| nagios_xi.service.last_check | Refers to the timestamp indicating the most recent time when a service was checked during the monitoring process. | date |
| nagios_xi.service.last_hard_state | Refers to the last known "hard state" of a service during the monitoring process. | keyword |
| nagios_xi.service.last_hard_state_change | Refers to the timestamp indicating the most recent time when the hard state of a service changed. | date |
| nagios_xi.service.last_notification | Refers to the timestamp indicating the most recent time when a notification was sent for a particular service. | date |
| nagios_xi.service.last_state_change | Refers to the timestamp indicating the most recent time when a service experienced a change in its overall state. | date |
| nagios_xi.service.last_time_critical | Refers to the timestamp or time of the most recent occurrence when a service transitioned to a critical state. | date |
| nagios_xi.service.last_time_ok | Refers to the timestamp or time of the most recent occurrence when a service transitioned to an OK state. | date |
| nagios_xi.service.last_time_unknown | Refers to the timestamp or time of the most recent occurrence when a service transitioned to an unknown state. | date |
| nagios_xi.service.last_time_warning | Refers to the timestamp or time of the most recent occurrence when a service transitioned to a warning state. | date |
| nagios_xi.service.latency | Refers to the measure of the time it takes for a monitoring check to be performed and for the result to be obtained from the monitored service. | double |
| nagios_xi.service.long_output | Refers to the detailed description or additional information associated with a service check result. It provides more specific and comprehensive details about the status or condition of the monitored object. | keyword |
| nagios_xi.service.max_check_attempts | This is used to define the number of times that Nagios will retry the host check command if it returns any state other than an OK state. Setting this value to 1 will cause Nagios to generate an alert without retrying the host check. | keyword |
| nagios_xi.service.modified_service_attributes | Refers to the set of service attributes that have been modified or customized for a particular service. | keyword |
| nagios_xi.service.next_check | Refers to the timestamp indicating the scheduled time for the next check to be performed on a service. | date |
| nagios_xi.service.next_notification | Refers to the timestamp indicating the scheduled time for the next notification to be sent for a particular service. | date |
| nagios_xi.service.no_more_notifications | This is used in specific scenarios when it is necessary to prevent additional notifications from being sent for a service. | keyword |
| nagios_xi.service.normal_check_interval | This is used to define the number of "time units" between regularly scheduled checks of the host. Unless you've changed the interval_length from the default value of 60, this number will mean minutes. More information on this value can be found in the check scheduling documentation. | long |
| nagios_xi.service.notes | This is used to define an optional string of notes pertaining to the host. If you specify a note here, you will see the it in the extended information CGI (when you are viewing information about the specified host). | keyword |
| nagios_xi.service.notes_url | This variable is used to define an optional URL that can be used to provide more information about the host. If you specify an URL, you will see a red folder icon in the CGIs (when you are viewing host information) that links to the URL you specify here. Any valid URL can be used. If you plan on using relative paths, the base path will the the same as what is used to access the CGIs (i.e. /cgi-bin/nagios/). This can be very useful if you want to make detailed information on the host, emergency contact methods, etc. available to other support staff. | keyword |
| nagios_xi.service.notifications_enabled | This is used to determine whether or not notifications for this host are enabled. Values=> 0 = disable host notifications, 1 = enable host notifications. | keyword |
| nagios_xi.service.obsess_over_service | This is used in the configuration files to determine whether the monitoring system should obsess over a specific service. | keyword |
| nagios_xi.service.output | Refers to the textual information or status message that is generated as the result of a service check. | keyword |
| nagios_xi.service.passive_checks_enabled | This is used to determine whether or not passive checks are enabled for this host. Values=> 0 = disable passive host checks, 1 = enable passive host checks (default). | keyword |
| nagios_xi.service.percent_state_change | Refers to the percentage of state change for a specific service within a defined time period. | keyword |
| nagios_xi.service.ping.performance_data | Exact output of check_command. | keyword |
| nagios_xi.service.ping.pl | Packet Loss while ping to host. | double |
| nagios_xi.service.ping.rta | Round Trip Around while ping to host. | double |
| nagios_xi.service.problem_has_been_acknowledged | This is a flag or attribute associated with a service that indicates whether a particular problem or issue has been acknowledged by an administrator or user. | keyword |
| nagios_xi.service.process.performance_data | Exact output of check_command. | keyword |
| nagios_xi.service.process.total | Total processes in host. | double |
| nagios_xi.service.process_performance_data | This is used to determine whether or not the processing of performance data is enabled for this host. Values=> 0 = disable performance data processing, 1 = enable performance data processing. | keyword |
| nagios_xi.service.retry_check_interval | This is used to define the number of "time units" to wait before scheduling a re-check of the hosts. Hosts are rescheduled at the retry interval when they have changed to a non-UP state. Once the host has been retried max_check_attempts times without a change in its status, it will revert to being scheduled at its "normal" rate as defined by the check_interval value. Unless you've changed the interval_length from the default value of 60, this number will mean minutes. More information on this value can be found in the check scheduling documentation. | long |
| nagios_xi.service.root_partition.free_space | Free Space in host. | double |
| nagios_xi.service.root_partition.performance_data | Exact output of check_command. | keyword |
| nagios_xi.service.root_partition.total_space | Total Space in host. | double |
| nagios_xi.service.root_partition.used_space | Used space in host. | double |
| nagios_xi.service.scheduled_downtime_depth | Refers to the number of active scheduled downtimes affecting a particular service. It indicates the depth or level of scheduled downtimes that have been applied to the object. | keyword |
| nagios_xi.service.service_description | Refers to a unique identifier or label that represents a specific service being monitored. | keyword |
| nagios_xi.service.service_object_id | Refers to a unique identifier assigned to a specific service object within the monitoring configuration. | keyword |
| nagios_xi.service.servicestatus_id | Refers to a unique identifier assigned to the current status of a specific service. | keyword |
| nagios_xi.service.should_be_scheduled | This is a parameter that determines whether a specific service check should be scheduled for monitoring. It is used to control the scheduling behavior of service checks in Nagios XI. | keyword |
| nagios_xi.service.ssh.performance_data | Exact output of check_command. | keyword |
| nagios_xi.service.ssh.time | SSH time taken for host. | double |
| nagios_xi.service.state_type | Refers to a configuration setting that determines the behavior of how the state of a service is determined and interpreted in the monitoring process. | keyword |
| nagios_xi.service.status_update_time | Refers to the timestamp or time of the most recent status update for a service. It indicates the time when the current status of the object was last updated. | date |
| nagios_xi.service.swap_usage.free_swap | Free swap usage for host. | double |
| nagios_xi.service.swap_usage.performance_data | Exact output of check_command. | keyword |
| nagios_xi.service.swap_usage.total_swap | Total swap usage for host. | double |
| nagios_xi.service.swap_usage.used_swap | Used swap usage for host. | double |
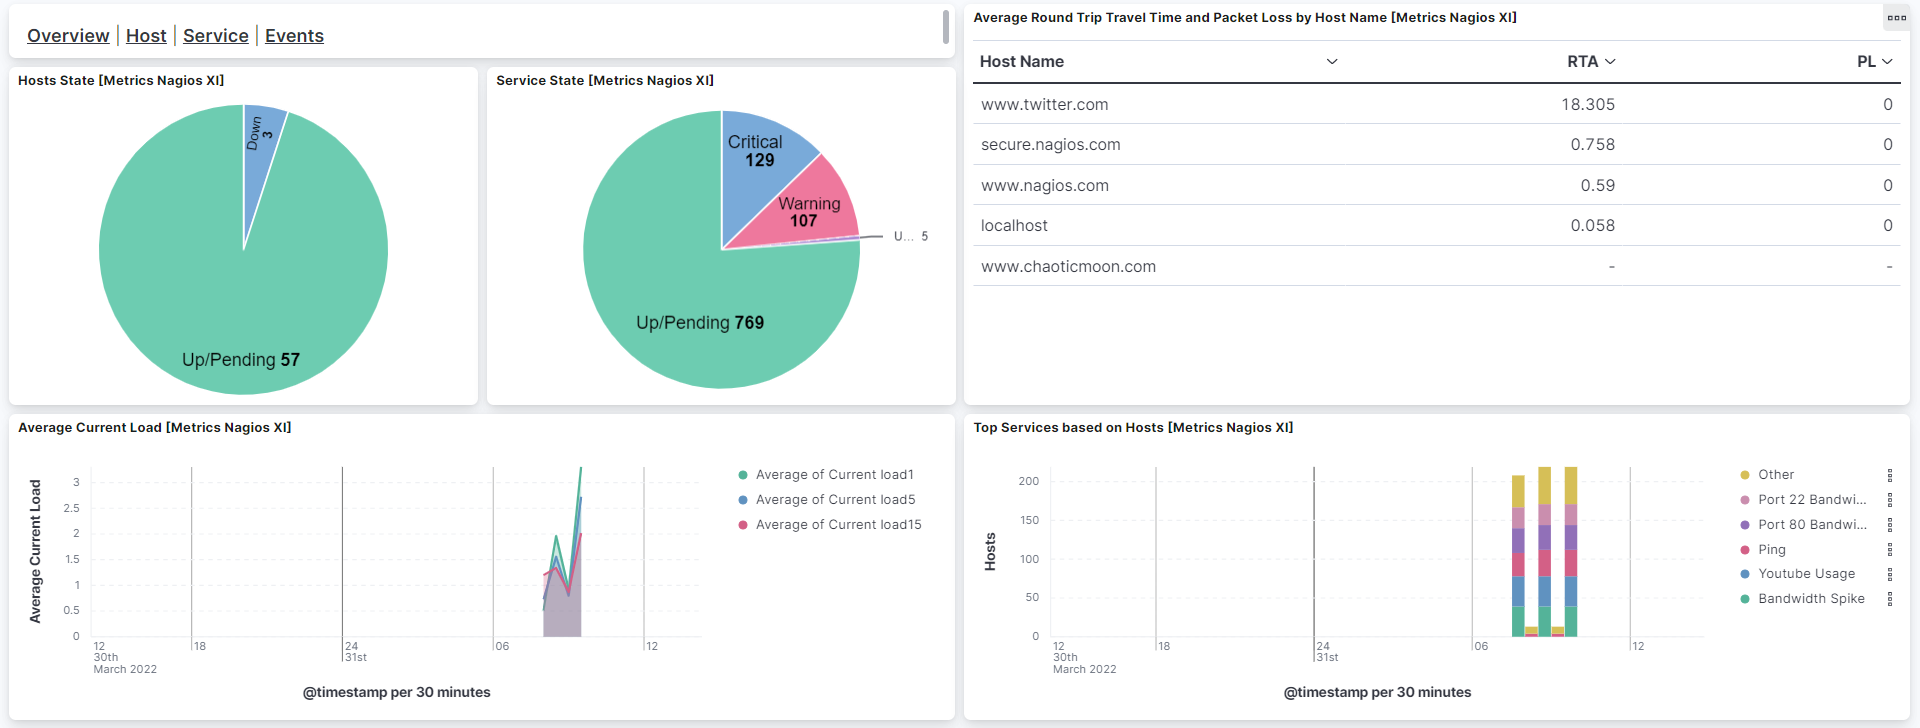
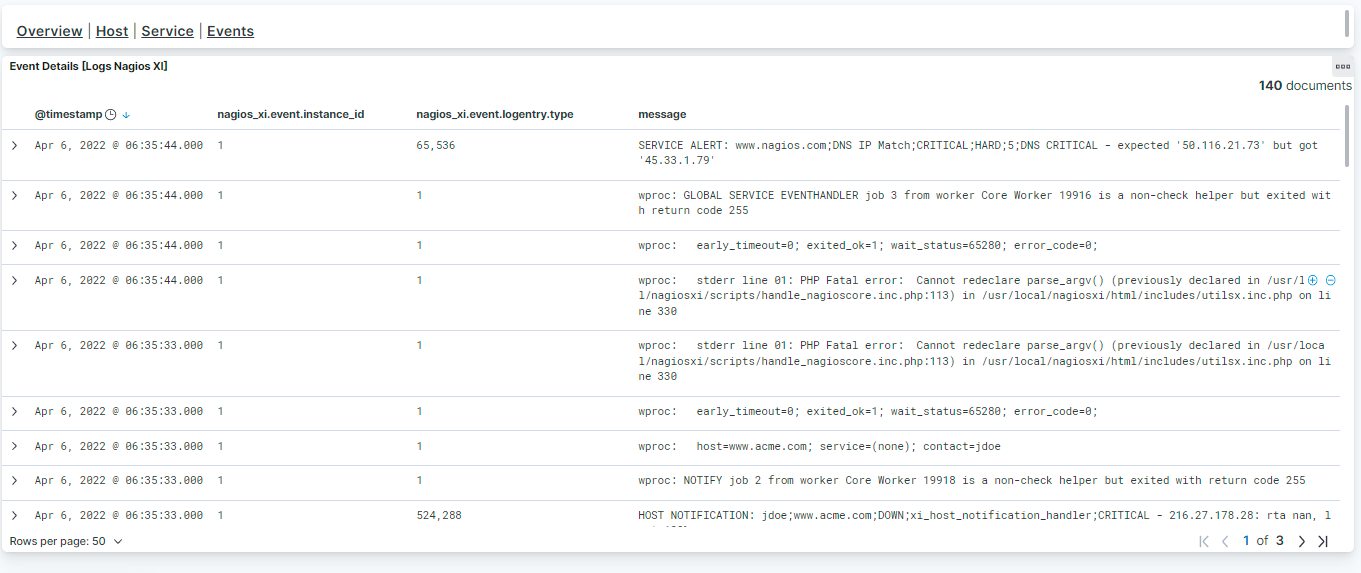
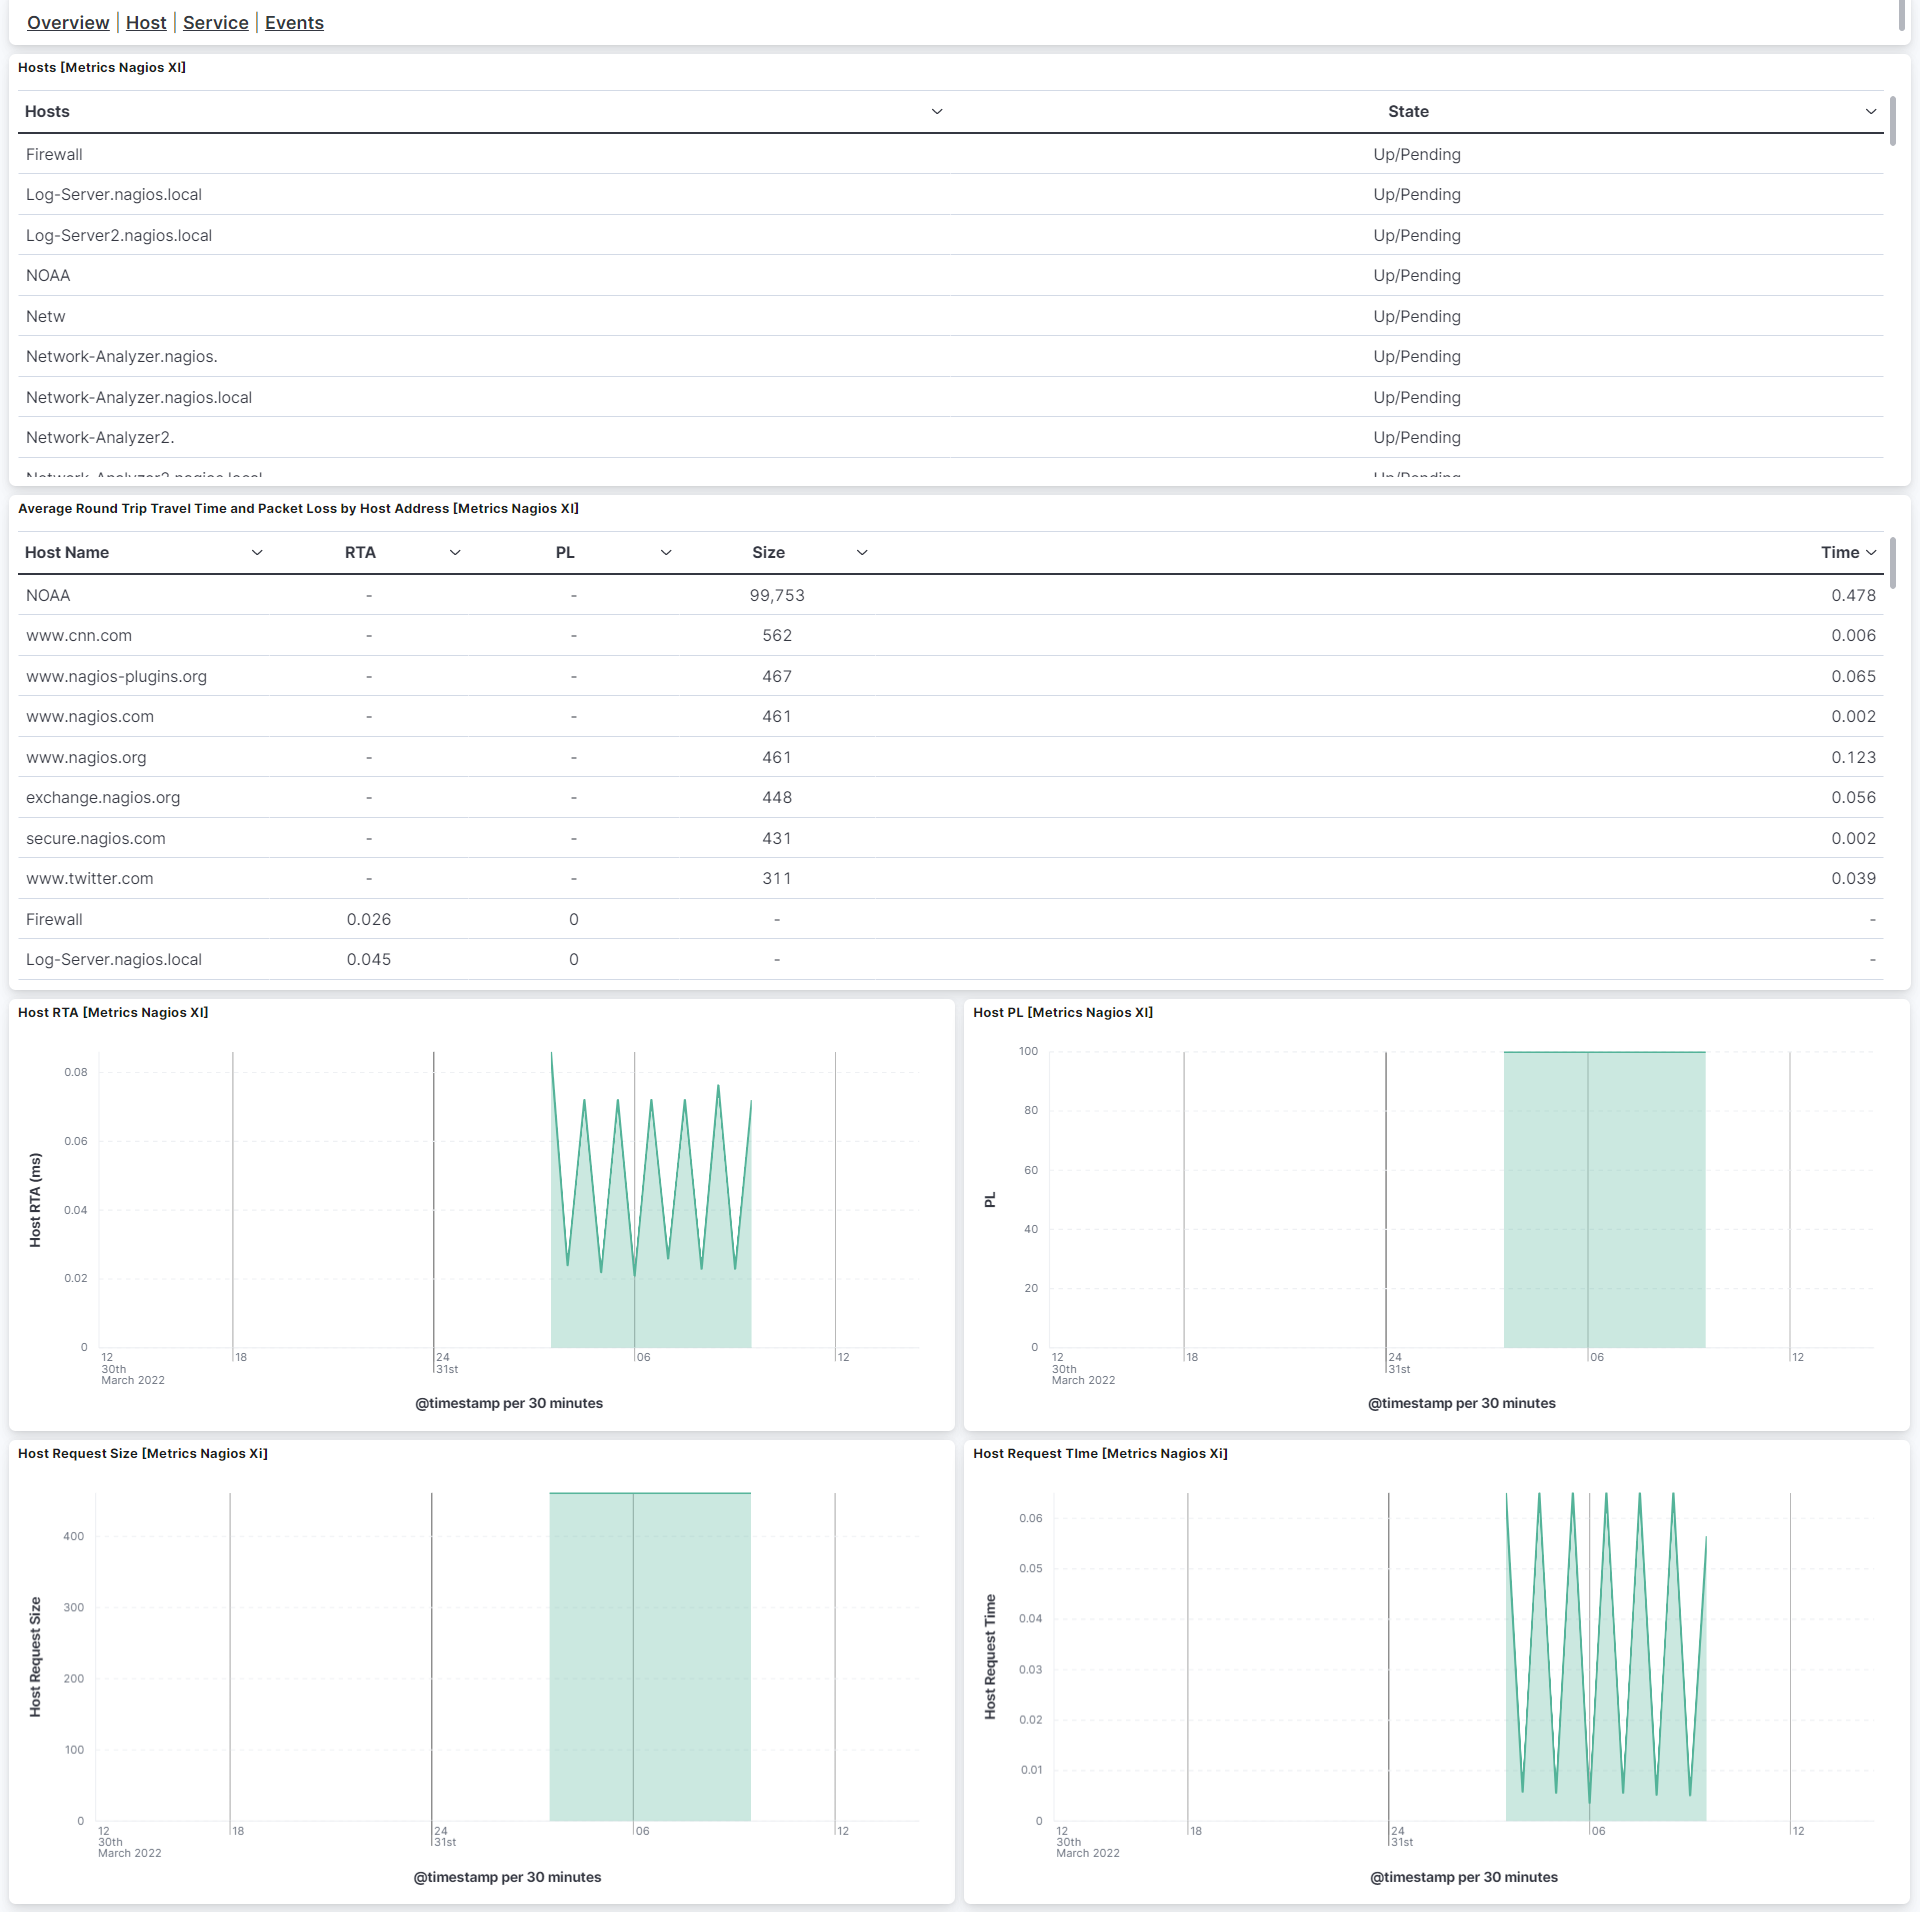
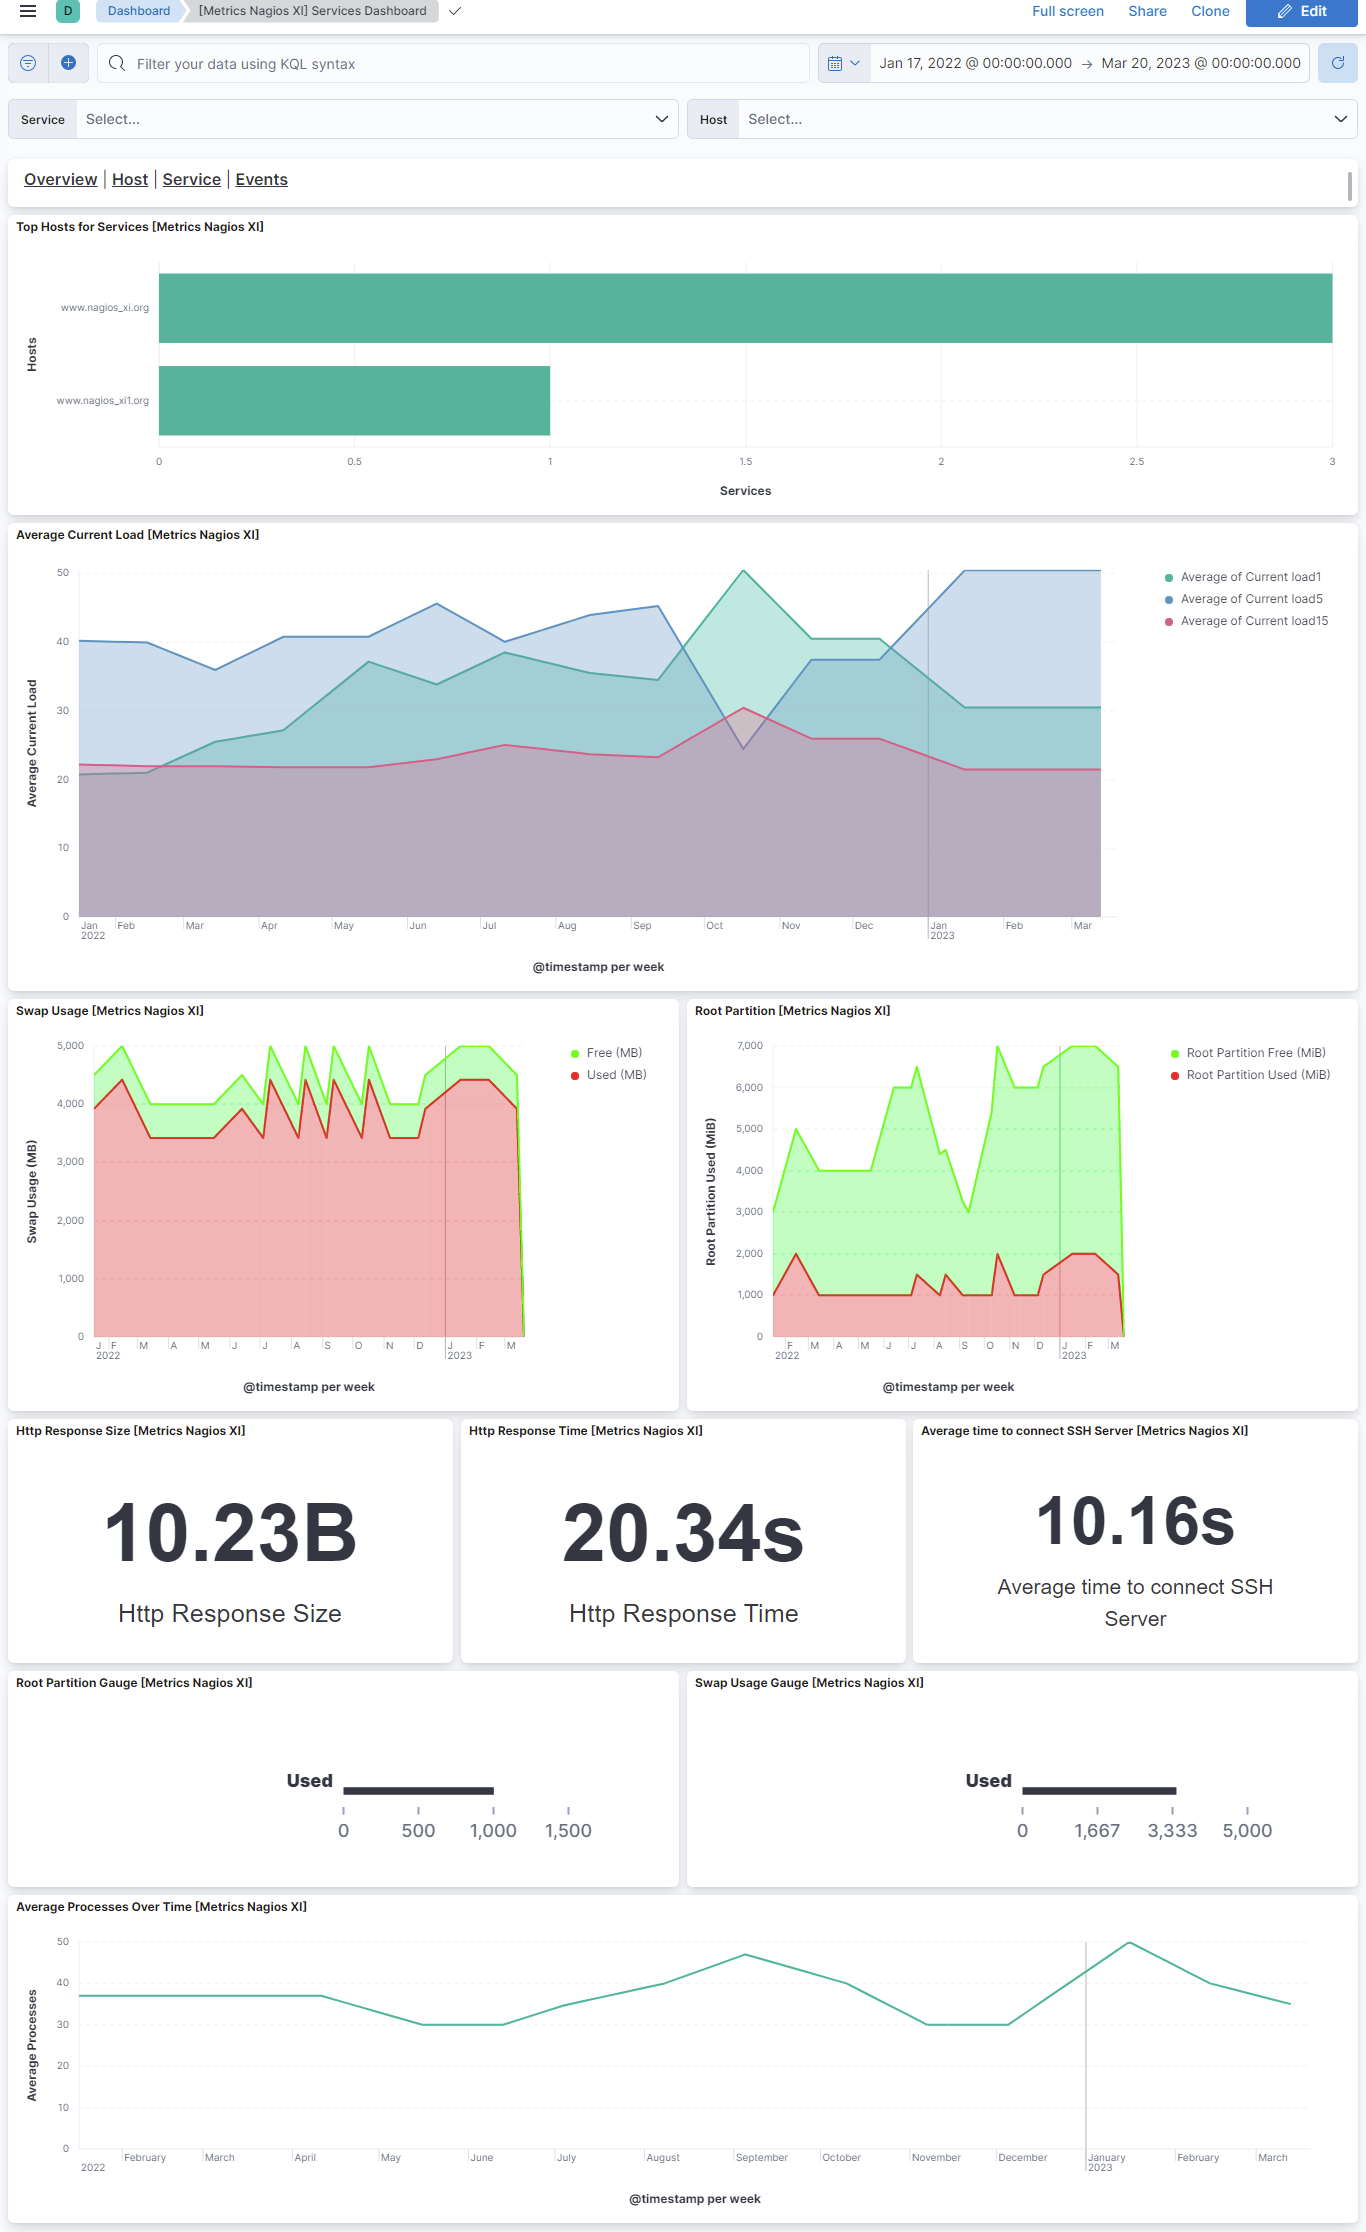
This integration includes one or more Kibana dashboards that visualizes the data collected by the integration. The screenshots below illustrate how the ingested data is displayed.
Changelog
| Version | Details | Minimum Kibana version |
|---|---|---|
| 1.8.0 | Enhancement (View pull request) Improve documentation |
9.0.0 8.13.0 |
| 1.7.1 | Bug fix (View pull request) Fix Dashboard Links Panel by setting useCurrentFilters to false. |
9.0.0 8.13.0 |
| 1.7.0 | Enhancement (View pull request) Use links panel in Dashboards. |
9.0.0 8.13.0 |
| 1.6.0 | Enhancement (View pull request) Allow @custom pipeline access to event.original without setting preserve_original_event. |
9.0.0 8.13.0 |
| 1.5.1 | Bug fix (View pull request) Added description to ssl nodes including links to documentation. |
9.0.0 8.13.0 |
| 1.5.0 | Enhancement (View pull request) Add support for Kibana 9.0.0. |
9.0.0 8.13.0 |
| 1.4.1 | Bug fix (View pull request) Update links to getting started docs |
8.13.0 |
| 1.4.0 | Enhancement (View pull request) ECS version updated to 8.11.0. Update the kibana constraint to ^8.13.0. Modified the field definitions to remove ECS fields made redundant by the ecs@mappings component template. |
8.13.0 |
| 1.3.0 | Enhancement (View pull request) Enable secret for the api_key field and add dashboard-level filters. |
8.12.0 |
| 1.2.1 | Bug fix (View pull request) Fix ingest pipeline conditional field handling. |
8.3.0 |
| 1.2.0 | Enhancement (View pull request) Limit request tracer log count to five. |
8.3.0 |
| 1.1.1 | Bug fix (View pull request) Add null check and ignore_missing check to the rename processor |
8.3.0 |
| 1.1.0 | Enhancement (View pull request) Add support for HTTP request trace logging. |
8.3.0 |
| 1.0.0 | Enhancement (View pull request) Make Nagios XI GA |
8.3.0 |
| 0.5.2 | Bug fix (View pull request) Update control panel and add units for metrics chart in service dashboards. |
8.3.0 |
| 0.5.1 | Bug fix (View pull request) Update field description for service and host data streams. |
8.3.0 |
| 0.5.0 | Enhancement (View pull request) Rename ownership from obs-service-integrations to obs-infraobs-integrations |
8.3.0 |
| 0.4.0 | Enhancement (View pull request) Migrate visualizations to lens. |
8.3.0 |
| 0.3.1 | Enhancement (View pull request) Added categories and/or subcategories. |
8.1.0 |
| 0.3.0 | Enhancement (View pull request) Updated ECS version to 8.5.1. |
8.1.0 |
| 0.2.0 | Enhancement (View pull request) Added infrastructure category. |
8.1.0 |
| 0.1.4 | Bug fix (View pull request) Remove unnecessary fields from fields.yml. |
8.1.0 |
| 0.1.3 | Bug fix (View pull request) Fix proxy URL documentation rendering. |
8.1.0 |
| 0.1.2 | Bug fix (View pull request) Fix invalid value in ECS field |
8.1.0 |
| 0.1.1 | Bug fix (View pull request) Setting event.kind in adherence to the ECS Specification |
— |
| 0.1.0 | Enhancement (View pull request) Nagios integration package with Visualization. Enhancement (View pull request) Nagios integration package with Service metrics Enhancement (View pull request) Nagios integration package with Host metrics Enhancement (View pull request) Nagios integration package with Events metrics |
— |