Create an inventory rule
Elastic Cloud Serverless projects are autoscaled environments, fully managed by Elastic and available on Elastic Cloud. Availability This functionality is generally available and ready for production usage. Serverless interfaces and procedures might differ from classic Elastic Stack deployments. The Elastic Stack includes Elastic's core products such as Elasticsearch, Kibana, Logstash, and Beats. Availability This functionality is generally available and ready for production usage. Unless stated otherwise on the page, this functionality is available when your Elastic Stack is deployed on Elastic Cloud Hosted, Elastic Cloud Enterprise, Elastic Cloud on Kubernetes, and self-managed environments. This documentation corresponds to the latest patch available for each minor version. If you're not using the latest patch, check the release notes for changes.
Serverless
Generally available
Stack
Generally available
For Observability serverless projects, the Editor role or higher is required to create inventory threshold rules. To learn more, refer to Assign user roles and privileges.
Based on the resources listed on the Infrastructure inventory page within the Infrastructure app, you can create a threshold rule to notify you when a metric has reached or exceeded a value for a specific resource or a group of resources within your infrastructure.
Additionally, each rule can be defined using multiple conditions that combine metrics and thresholds to create precise notifications and reduce false positives.
- To access this page, go to Observability → Infrastructure.
- On the Infrastructure inventory page or the Metrics Explorer page, click Alerts → Infrastructure.
- Select Create inventory rule.
When you select Create inventory rule, the parameters you configured on the Infrastructure inventory page will automatically populate the rule. You can use the Inventory first to view which nodes in your infrastructure you’d like to be notified about and then quickly create a rule in just a few clicks.
To create inventory rules, you need the following:
- The Elastic Stack includes Elastic's core products such as Elasticsearch, Kibana, Logstash, and Beats. Availability Generally available This functionality is generally available and ready for production usage. Unless stated otherwise on the page, this functionality is available when your Elastic Stack is deployed on Elastic Cloud Hosted, Elastic Cloud Enterprise, Elastic Cloud on Kubernetes, and self-managed environments. This documentation corresponds to the latest patch available for each minor version. If you're not using the latest patch, check the release notes for changes. The permission for the Infrastructure application.
- Elastic Cloud Serverless projects are autoscaled environments, fully managed by Elastic and available on Elastic Cloud. Availability Generally available This functionality is generally available and ready for production usage. Serverless interfaces and procedures might differ from classic Elastic Stack deployments. The Editor role or higher for Observability serverless projects. To learn more, refer to Assign user roles and privileges.
Rules use an API key to authorize all background tasks, including condition checks and triggered actions. The key type depends on your deployment. For details on how API keys authorize rules, refer to API keys.
This rule queries the index patterns defined by the observability:logSources setting in Kibana Advanced Settings, and the metrics indices from the Infrastructure / Metrics Explorer settings. The defaults are metrics-* and metricbeat-* for metrics; logs-*-* and filebeat-* for log rate. You cannot override these indices on a per-rule basis.
Conditions for each rule can be applied to specific metrics relating to the inventory type you select. You can choose the aggregation type, the metric, and by including a warning threshold value, you can be alerted on multiple threshold values based on severity scores. When creating the rule, you can still get notified if no data is returned for the specific metric or if the rule fails to query Elasticsearch.
In the following example, Kubernetes Pods is the selected inventory type. The conditions state that you will receive a critical alert for any pods within the ingress-nginx namespace with a memory usage of 95% or above and a warning alert if memory usage is 90% or above. The chart shows the results of applying the rule to the last 20 minutes of data. Note that the chart time range is 20 times the value of the look-back window specified in the FOR THE LAST field.
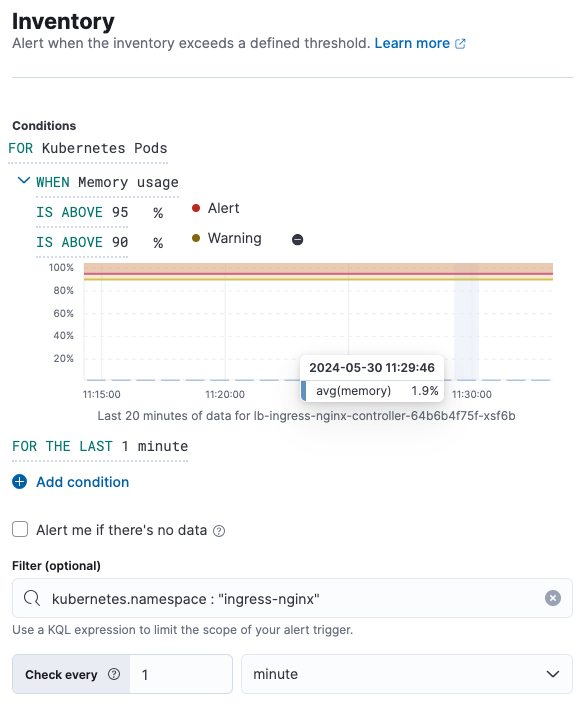
Elastic Cloud Serverless projects are autoscaled environments, fully managed by Elastic and available on Elastic Cloud. Availability This functionality is generally available and ready for production usage. Serverless interfaces and procedures might differ from classic Elastic Stack deployments. The Elastic Stack includes Elastic's core products such as Elasticsearch, Kibana, Logstash, and Beats. Availability This functionality is generally available and ready for production usage. Unless stated otherwise on the page, this functionality is available when your Elastic Stack is deployed on Elastic Cloud Hosted, Elastic Cloud Enterprise, Elastic Cloud on Kubernetes, and self-managed environments. This documentation corresponds to the latest patch available for each minor version. If you're not using the latest patch, check the release notes for changes.
Serverless
Generally available
Stack
9.2+
Generally available since 9.2
Most inventory types respect the default data collection method, for example the Elastic System Integration. For some inventory types, however, you can use the Schema dropdown menu to explicitly target data collected using OpenTelemetry or the Elastic System Integration.
| Inventory type | Schema menu |
|---|---|
| Hosts | Available |
| The Elastic Stack includes Elastic's core products such as Elasticsearch, Kibana, Logstash, and Beats. Availability Planned We plan to add this functionality in a future Elastic Stack update. Subject to changes. Unless stated otherwise on the page, this functionality is available when your Elastic Stack is deployed on Elastic Cloud Hosted, Elastic Cloud Enterprise, Elastic Cloud on Kubernetes, and self-managed environments. This documentation corresponds to the latest patch available for each minor version. If you're not using the latest patch, check the release notes for changes. Kubernetes Pods | Available |
| Docker Containers | Not available |
| AWS | Not available |
The Elastic Stack includes Elastic's core products such as Elasticsearch, Kibana, Logstash, and Beats.
Availability
Planned
We plan to add this functionality in a future Elastic Stack update. Subject to changes.
Unless stated otherwise on the page, this functionality is available when your Elastic Stack is deployed on Elastic Cloud Hosted, Elastic Cloud Enterprise, Elastic Cloud on Kubernetes, and self-managed environments.
This documentation corresponds to the latest patch available for each minor version. If you're not using the latest patch, check the release notes for changes.
For the Kubernetes Pods inventory type, the selected schema also determines the field the rule groups on: k8s.pod.uid for OpenTelemetry, or kubernetes.pod.uid for the Elastic System Integration.
If you saved a Kubernetes Pods rule with the OpenTelemetry schema before 9.6, that rule was evaluated against Kubernetes integration data despite the saved schema. From 9.6, it evaluates and groups on OpenTelemetry data instead. After you upgrade, check any such rules to confirm they still alert on the pods you expect.
For more on the data supported by each inventory type, refer to the following references:
You can extend your rules with actions that interact with third-party systems, write to logs or indices, or send user notifications. You can add an action to a rule at any time. You can create rules without adding actions, and you can also define multiple actions for a single rule.
To add actions to rules, you must first create a connector for that service (for example, an email or external incident management system), which you can then use for different rules, each with their own action frequency.
Connector types
Connectors provide a central place to store connection information for services and integrations with third party systems. The following connectors are available when defining actions for alerting rules:
- Cases
- D3 Security
- IBM Resilient
- Index
- Jira
- Microsoft Teams
- Observability AI Assistant
- Opsgenie
- PagerDuty
- Server log
- ServiceNow ITOM
- ServiceNow ITSM
- ServiceNow SecOps
- Slack
- Swimlane
- Torq
- Webhook
- xMatters
Some connector types are paid commercial features, while others are free. For a comparison of the Elastic subscription levels, go to the subscription page.
For more information on creating connectors, refer to Connectors.
Action frequency
After you select a connector, you must set the action frequency. You can choose to create a summary of alerts on each check interval or on a custom interval. For example, send email notifications that summarize the new, ongoing, and recovered alerts each hour:
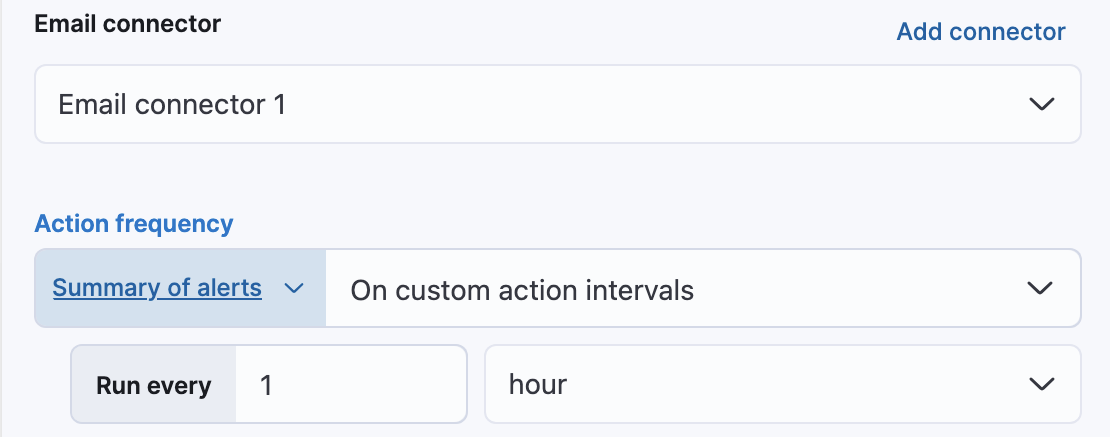
Alternatively, you can set the action frequency such that you choose how often the action runs (for example, at each check interval, only when the alert status changes, or at a custom action interval). In this case, you define precisely when the alert is triggered by selecting a specific threshold condition: Alert, Warning, or Recovered (a value that was once above a threshold has now dropped below it).
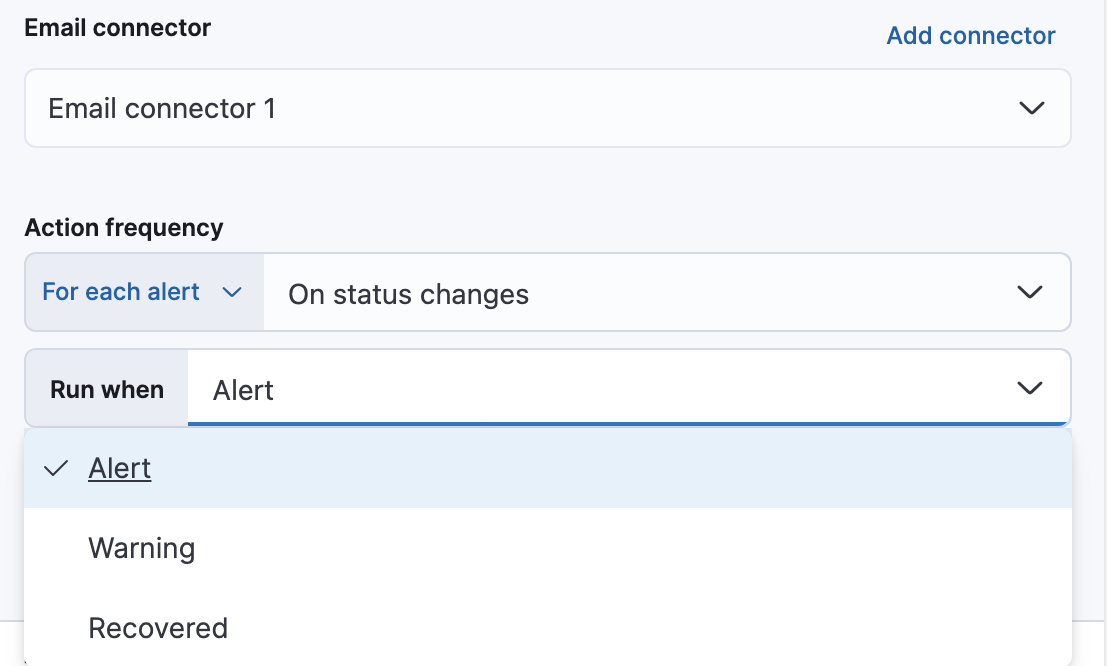
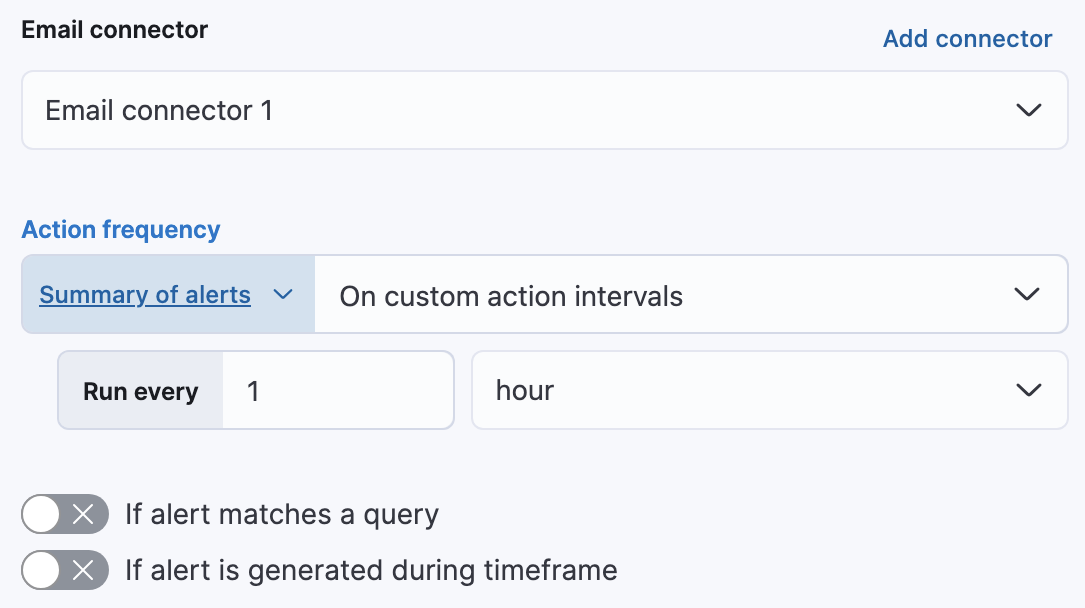
You can also further refine the conditions under which actions run by specifying that actions only run when they match a KQL query or when an alert occurs within a specific time frame:
- If alert matches query: Enter a KQL query that defines field-value pairs or query conditions that must be met for notifications to send. The query only searches alert documents in the indices specified for the rule.
- If alert is generated during timeframe: Set timeframe details. Notifications are only sent if alerts are generated within the timeframe you define.
Action variables
Use the default notification message or customize it. You can add more context to the message by clicking the Add variable icon  and selecting from a list of available variables.
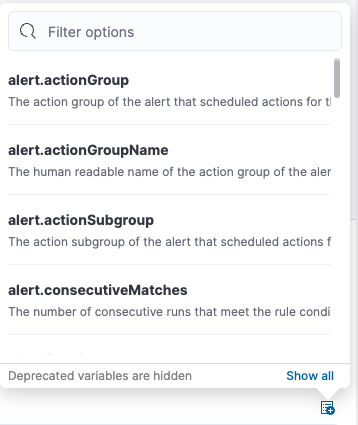
The following variables are specific to this rule type. You can also specify variables common to all rules.
context.alertDetailsUrl- Link to the alert troubleshooting view for further context and details. This will be an empty string if the
server.publicBaseUrlis not configured. context.alertState- Current state of the alert.
context.cloud- The cloud object defined by ECS if available in the source.
context.container- The container object defined by ECS if available in the source.
context.group- Name of the group reporting data.
context.groupingThe Elastic Stack includes Elastic's core products such as Elasticsearch, Kibana, Logstash, and Beats. Availability Generally available since 9.2 This functionality is generally available and ready for production usage. Unless stated otherwise on the page, this functionality is available when your Elastic Stack is deployed on Elastic Cloud Hosted, Elastic Cloud Enterprise, Elastic Cloud on Kubernetes, and self-managed environments. This documentation corresponds to the latest patch available for each minor version. If you're not using the latest patch, check the release notes for changes.- The object containing groups that are reporting data.
context.host- The host object defined by ECS if available in the source.
context.labels- List of labels associated with the entity where this alert triggered.
context.metric- The metric name in the specified condition. Usage: (
ctx.metric.condition0,ctx.metric.condition1, and so on). context.orchestrator- The orchestrator object defined by ECS if available in the source.
context.originalAlertState- The state of the alert before it recovered. This is only available in the recovery context.
context.originalAlertStateWasALERT- Boolean value of the state of the alert before it recovered. This can be used for template conditions. This is only available in the recovery context.
context.originalAlertStateWasWARNING- Boolean value of the state of the alert before it recovered. This can be used for template conditions. This is only available in the recovery context.
context.reason- A concise description of the reason for the alert.
context.tags- List of tags associated with the entity where this alert triggered.
context.threshold- The threshold value of the metric for the specified condition. Usage: (
ctx.threshold.condition0,ctx.threshold.condition1, and so on) context.timestamp- A timestamp of when the alert was detected.
context.value- The value of the metric in the specified condition. Usage: (
ctx.value.condition0,ctx.value.condition1, and so on). context.viewInAppUrl-
Link to the alert source.
With infrastructure threshold rules, it’s not possible to set an explicit index pattern as part of the configuration. The index pattern is instead inferred from Metrics indices on the Settings page of the Infrastructure app.
With each execution of the rule check, the Metrics indices setting is checked, but it is not stored when the rule is created.