Visualize a field from Discover
Elastic Cloud Serverless projects are autoscaled environments, fully managed by Elastic and available on Elastic Cloud. Availability This functionality is generally available and ready for production usage. Serverless interfaces and procedures might differ from classic Elastic Stack deployments. The Elastic Stack includes Elastic's core products such as Elasticsearch, Kibana, Logstash, and Beats. Availability This functionality is generally available and ready for production usage. Unless stated otherwise on the page, this functionality is available when your Elastic Stack is deployed on Elastic Cloud Hosted, Elastic Cloud Enterprise, Elastic Cloud on Kubernetes, and self-managed environments. This documentation corresponds to the latest patch available for each minor version. If you're not using the latest patch, check the release notes for changes.
Serverless
Generally available
Stack
Generally available
When a field in the fields list looks interesting, you can open it in Lens to see how its values break down, without building a chart from scratch. Lens is the default visualization editor in Kibana.
- Make sure Discover is in classic mode. ES|QL mode doesn't support this functionality. To switch, refer to Switch to Discover's classic mode.
- Discover must have a data view selected, and a search must have run on a time range that contains data, so the fields list appears.
- This example uses the ecommerce sample data. To follow along, add it and select its data view.
In the fields list in the sidebar, find a field that can be aggregated, for example
day_of_weekin the ecommerce sample data. Select the field name to open its details.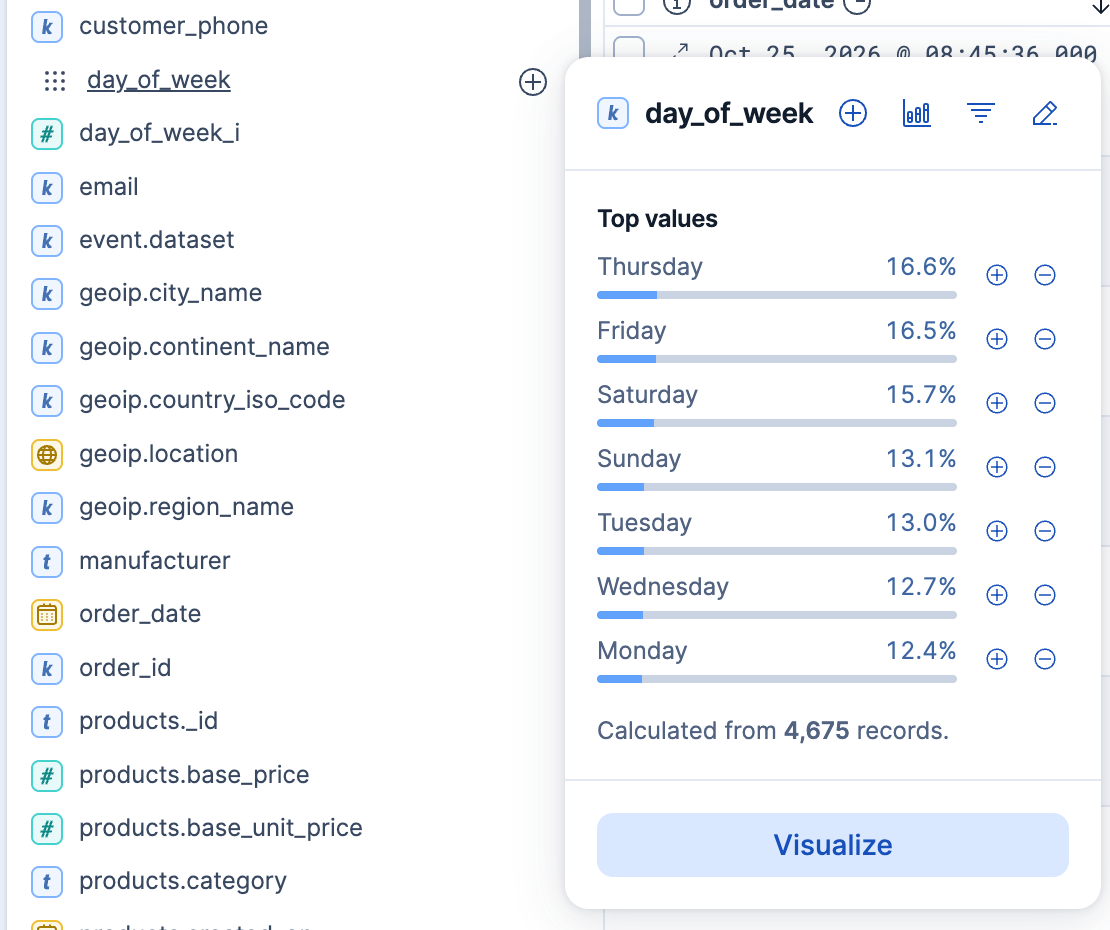
In the field details, select Visualize.
Kibana creates a Lens visualization best suited for this field. For geo point fields (
 ), your data appears on a map instead.
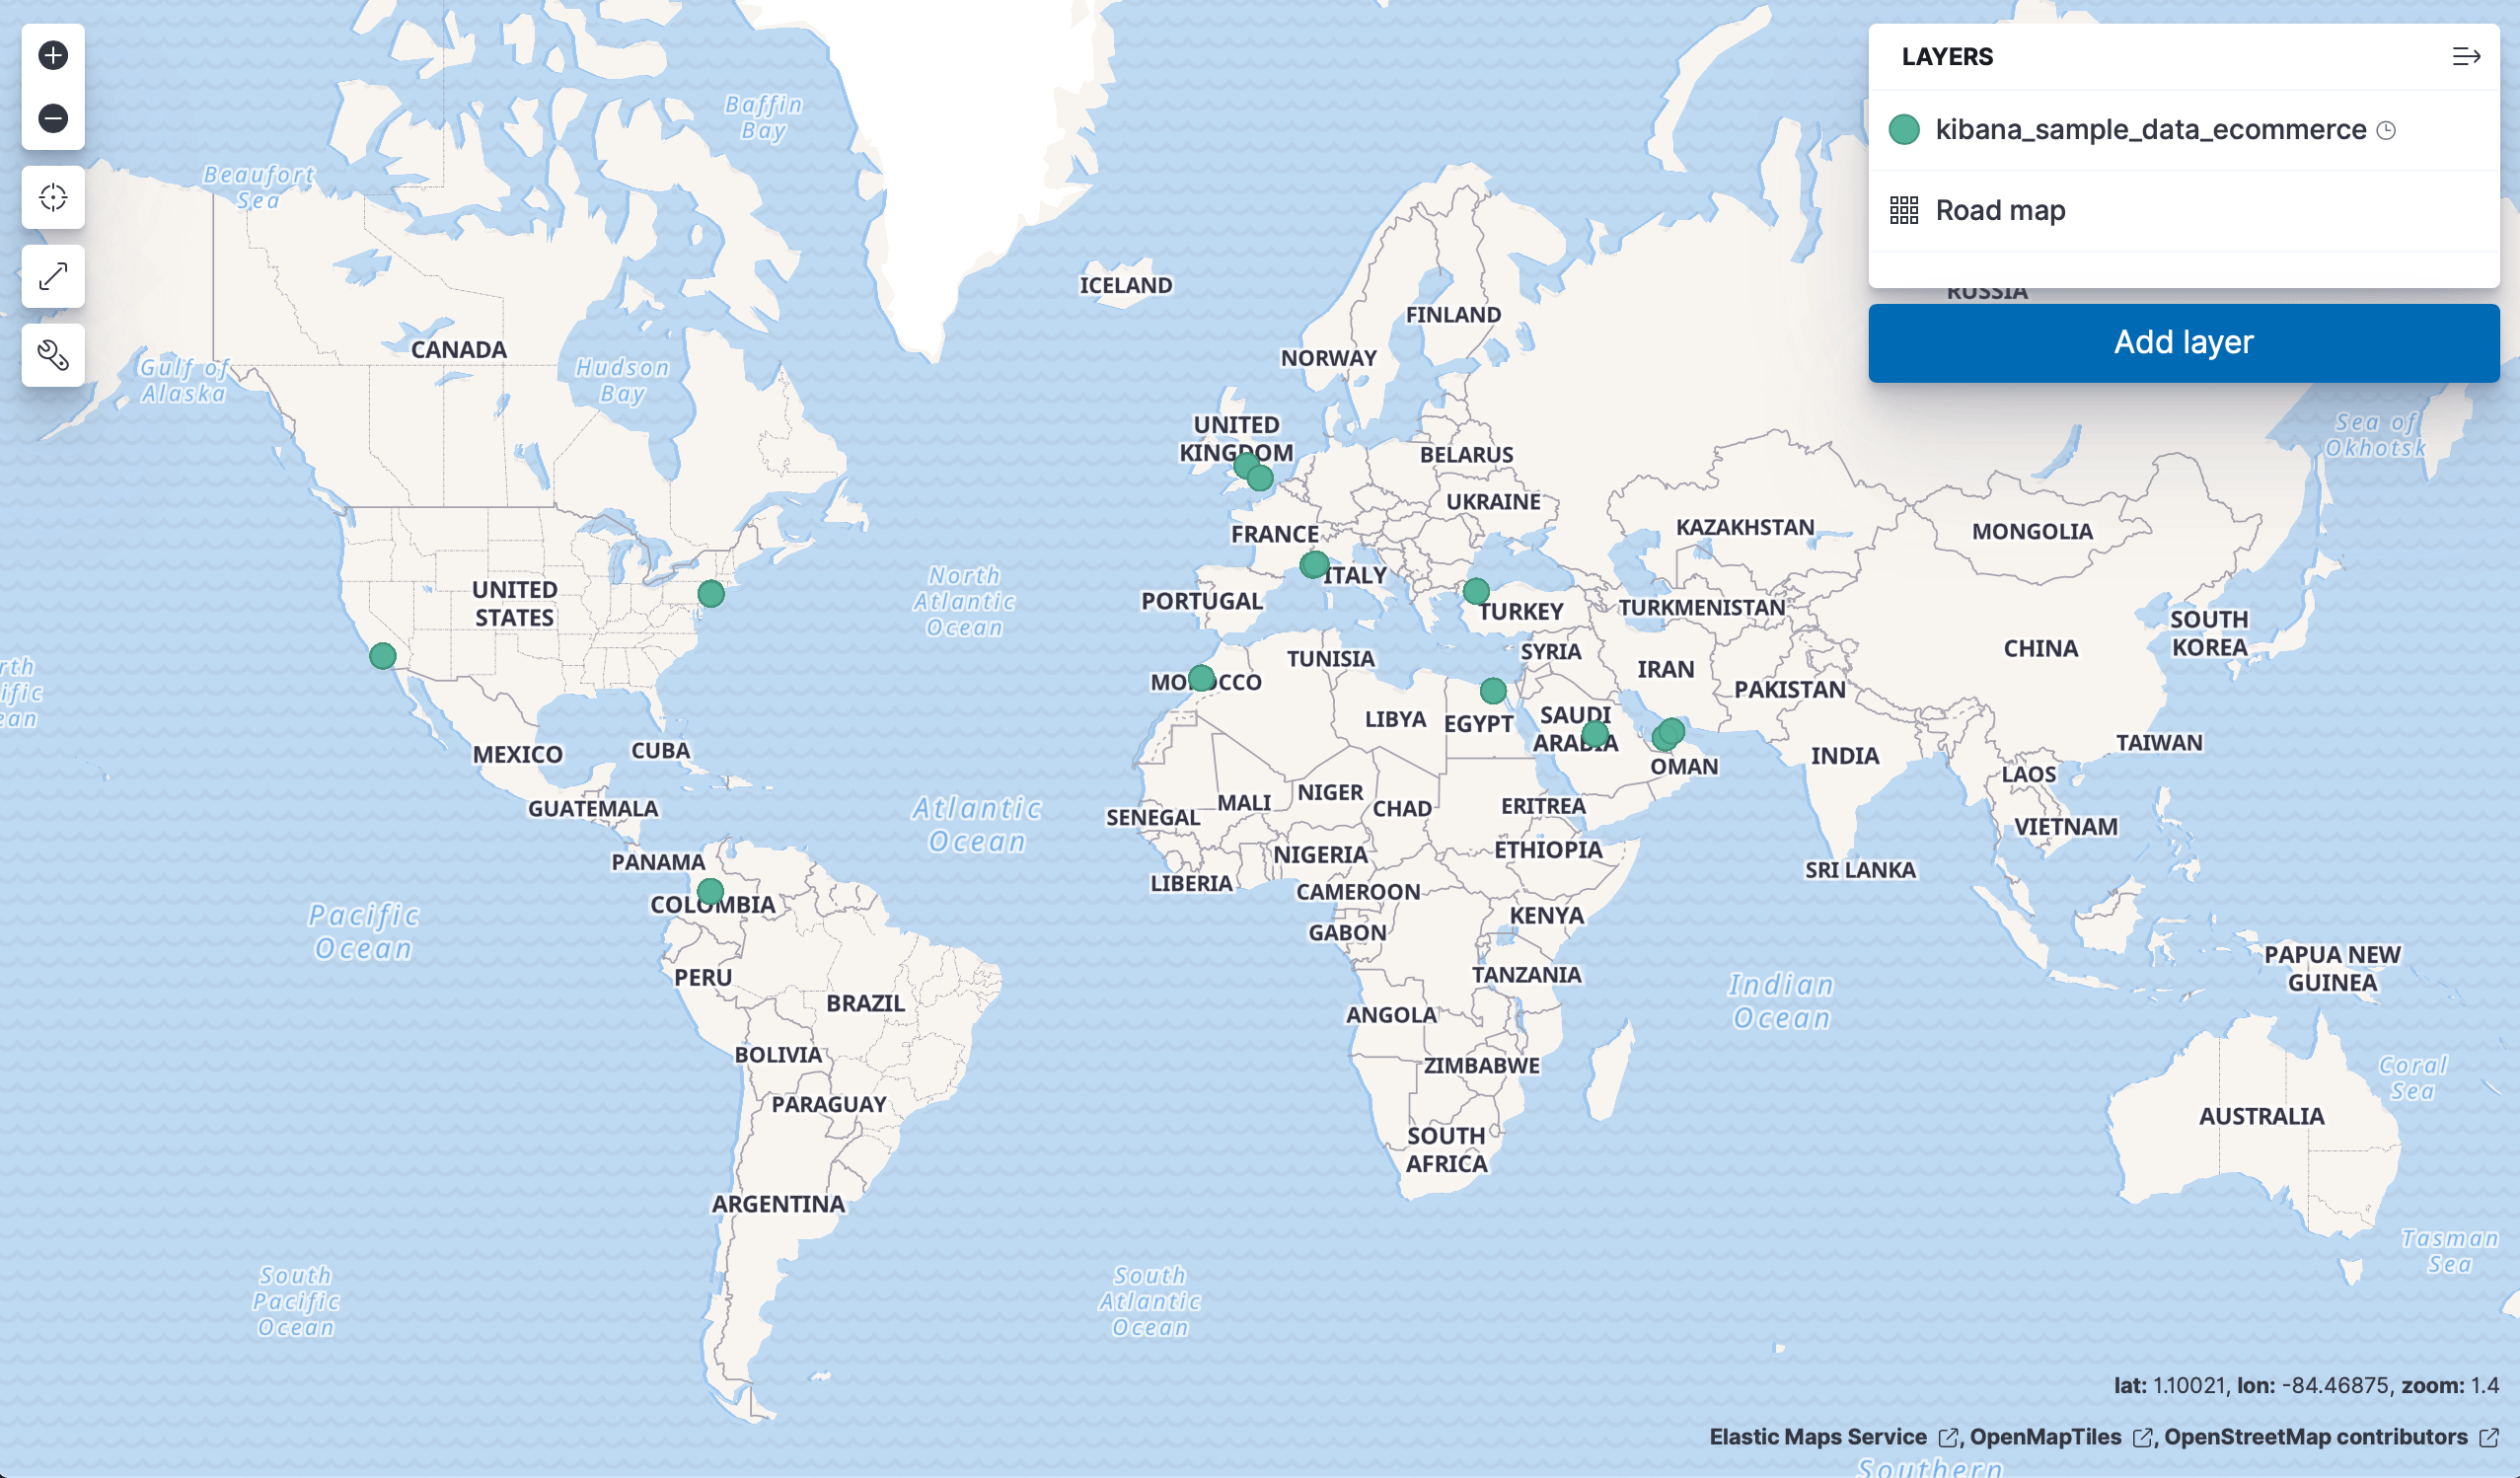
Optional: In Lens, from the Available fields list, drag more fields onto the chart to refine the visualization. In this example, adding the
manufacturer.keywordfield automatically adds a breakdown of the top values to the visualization.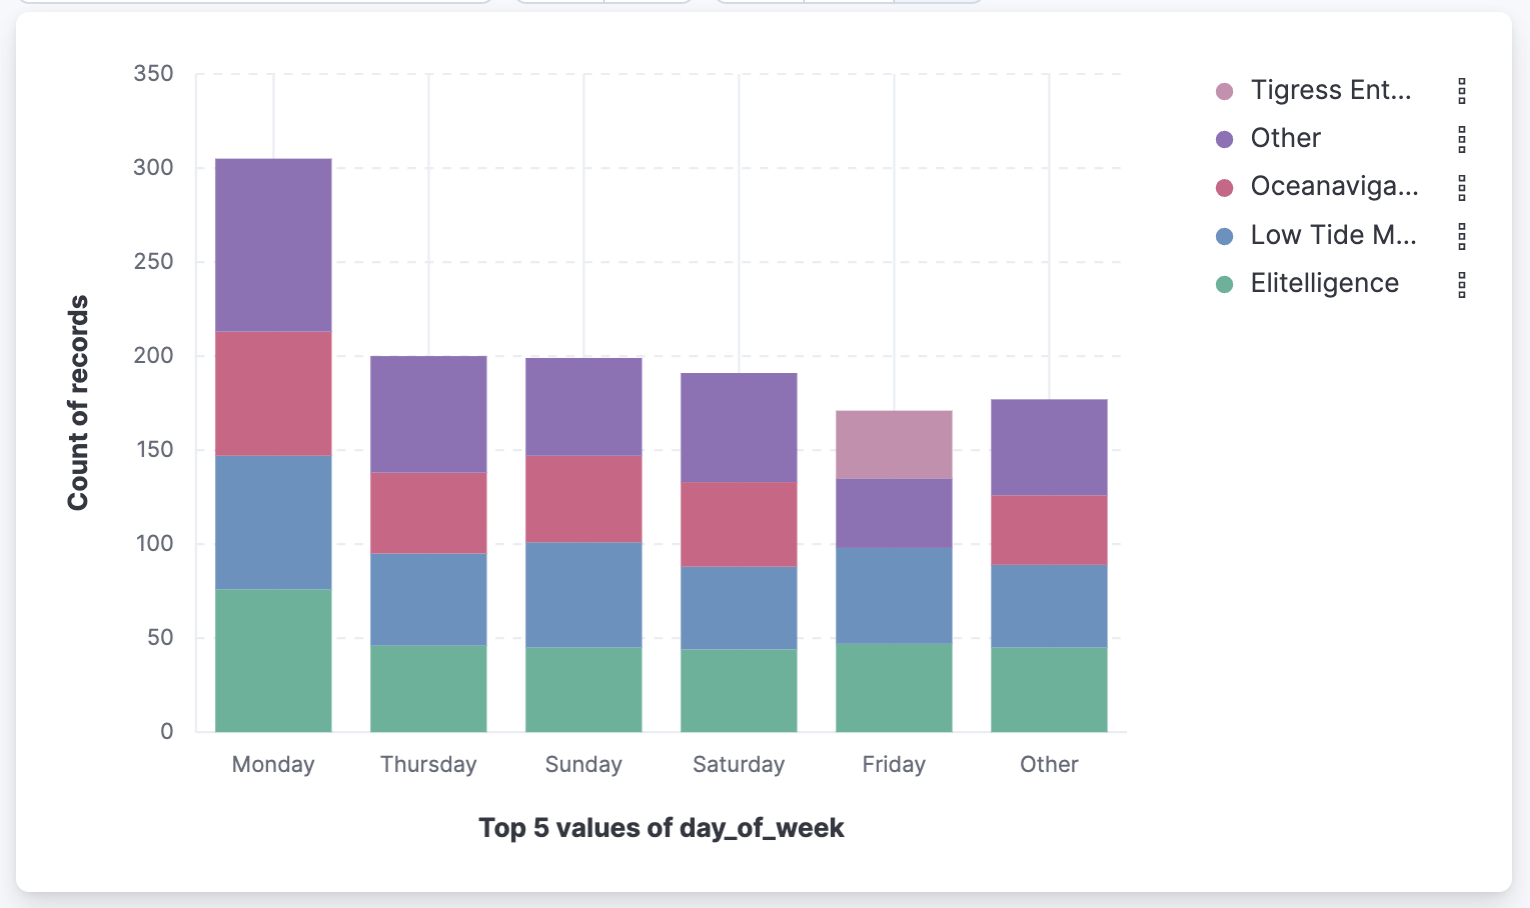
To keep the visualization, select Save. In the save dialog, you can add the visualization to a dashboard, save it to the Visualize library, or both.
Result: You have a visualization of the field that you can refine in Lens, add to a dashboard, or reopen from the Visualize library.
- To check a field's values before you chart it, refer to Explore fields in Discover.