Isolate a host
Elastic Cloud Serverless projects are autoscaled environments, fully managed by Elastic and available on Elastic Cloud. Availability This functionality is generally available and ready for production usage. The Elastic Stack includes Elastic's core products such as Elasticsearch, Kibana, Logstash, and Beats. Availability This functionality is generally available and ready for production usage. Unless stated otherwise on the page, this functionality is available when your Elastic Stack is deployed on Elastic Cloud Hosted, Elastic Cloud Enterprise, Elastic Cloud on Kubernetes, and self-managed environments. This documentation corresponds to the latest patch available for each minor version. If you're not using the latest patch, check the release notes for changes.
Serverless Security
Generally available
Stack
Generally available
Host isolation allows you to isolate hosts from your network, blocking communication with other hosts on your network until you release the host. Isolating a host is useful for responding to malicious activity or preventing potential attacks, as it prevents lateral movement across other hosts.
Isolated hosts, however, can still send data to Elastic Security. You can also create host isolation exceptions for specific IP addresses that isolated hosts are still allowed to communicate with, even when blocked from the rest of your network.
Host isolation requires the appropriate subscription in Elastic Stack or project feature tier in Serverless.
Hosts must have Elastic Agent installed with the Elastic Defend integration.
For Elastic Stack versions >= 7.15.0 and Serverless, host isolation is supported for endpoints running Windows, macOS, and these Linux distributions:
- CentOS/RHEL 8
- Debian 11
- Ubuntu 18.04, 20.04, and 22.04
- AWS Linux 2
To isolate and release hosts running any operating system, you must have the Host Isolation privilege or the appropriate user role.
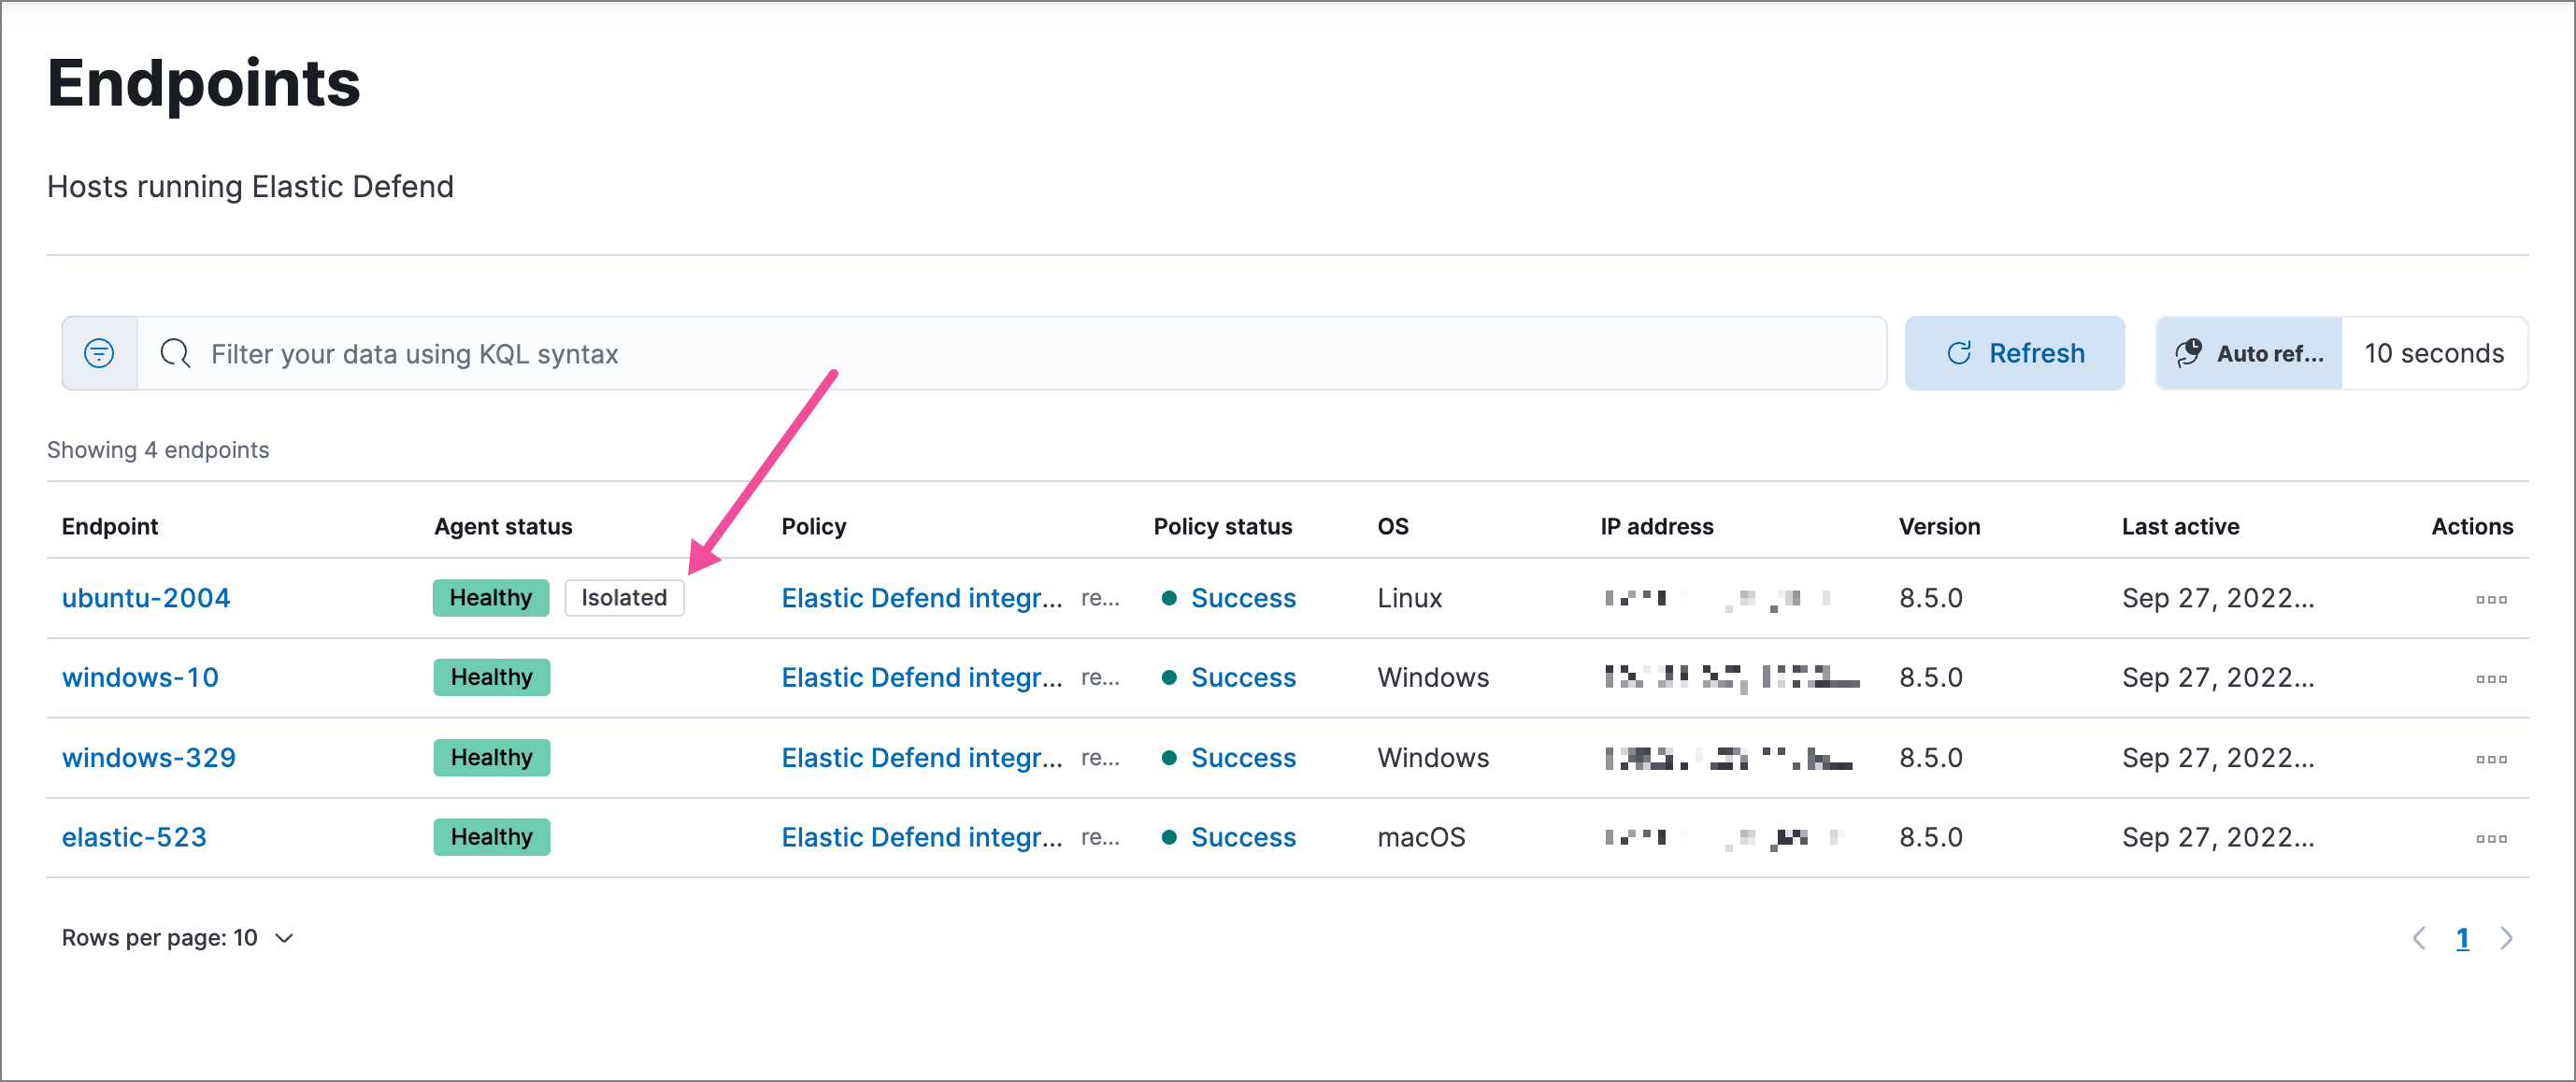
You can isolate a host from a detection alert’s details flyout, from the Endpoints page, or from the endpoint response console. Once a host is successfully isolated, an Isolated status displays next to the Agent status field, which you can view on the alert details flyout or Endpoints list table.
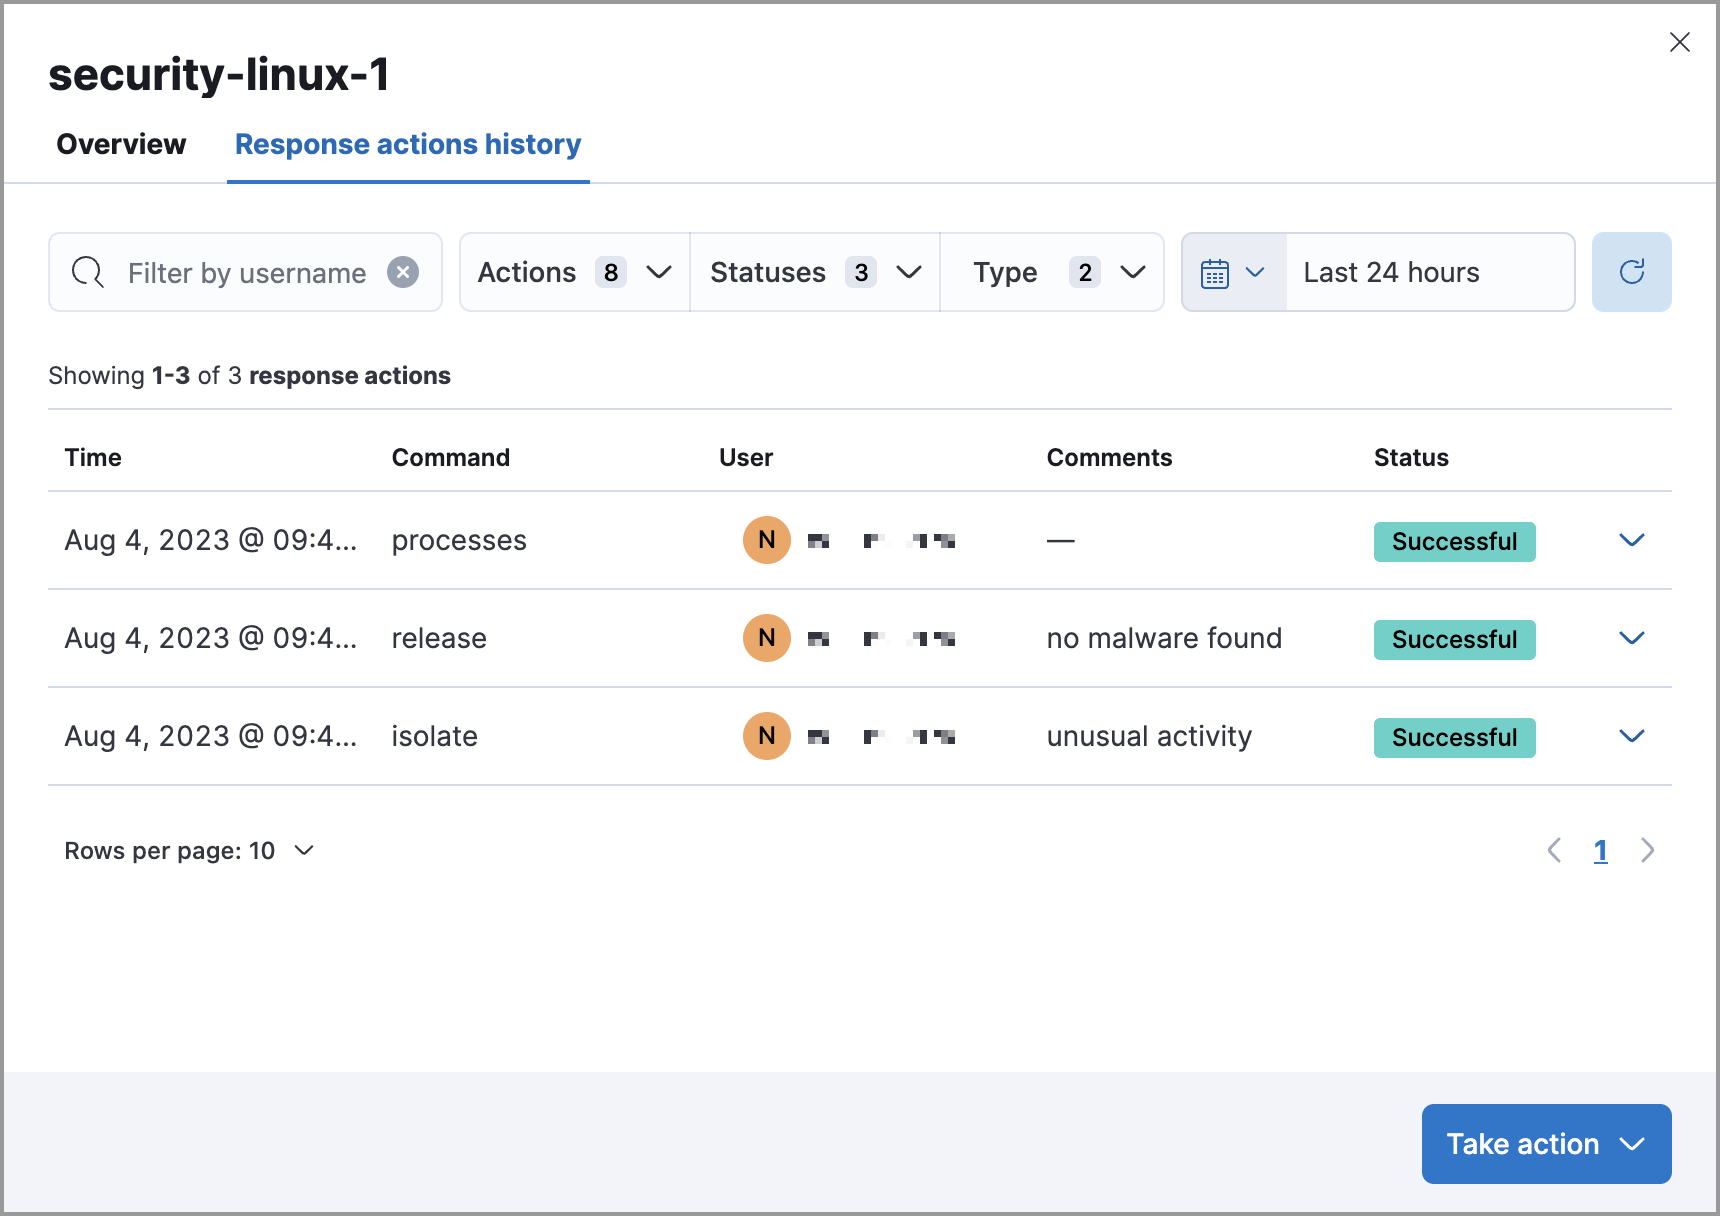
All actions executed on a host are tracked in the host’s response actions history, which you can access from the Endpoints page. Refer to Isolate a host > View host isolation history for more information.
Isolate a host from an event or a detection alert
Do one of the following:
- The Elastic Stack includes Elastic's core products such as Elasticsearch, Kibana, Logstash, and Beats. Availability Generally available since 9.1 This functionality is generally available and ready for production usage. Unless stated otherwise on the page, this functionality is available when your Elastic Stack is deployed on Elastic Cloud Hosted, Elastic Cloud Enterprise, Elastic Cloud on Kubernetes, and self-managed environments. This documentation corresponds to the latest patch available for each minor version. If you're not using the latest patch, check the release notes for changes. From the event analyzer view: Click an event.
- From the Alerts table or Timeline: Click View details (
 ).
- From a case with an attached alert: Click Show alert details (>).
Click Take action → Isolate host.
Enter a comment describing why you’re isolating the host (optional).
Click Confirm.
Isolate a host from an endpoint
Find Endpoints in the navigation menu or use the global search field, then either:
- Select the appropriate endpoint in the Endpoint column, and click Take action → Isolate host in the endpoint details flyout.
- Click the Actions menu (…) on the appropriate endpoint, then select Isolate host.
Enter a comment describing why you’re isolating the host (optional).
Click Confirm.
Isolate a host from the response console
The response console requires the appropriate subscription in Elastic Stack or project feature tier in Serverless.
Open the response console for the host (select the Respond button or actions menu option on the host, endpoint, or alert details view).
Enter the
isolatecommand and an optional comment in the input area, for example:isolate --comment "Isolate this host"Press Return.
Automatically isolate a host using a rule’s endpoint response action
The host isolation endpoint response action requires the appropriate subscription in Elastic Stack or project feature tier in Serverless.
Be aware that automatic host isolation can result in unintended consequences, such as disrupting legitimate user activities or blocking critical business processes.
Add an endpoint response action to a new or existing custom query rule. The endpoint response action will run whenever rule conditions are met:
- New rule: On the last step of custom query rule creation, go to the Response Actions section and select Elastic Defend.
- Existing rule: Edit the rule’s settings, then go to the Actions tab. In the tab, select Elastic Defend under the Response Actions section.
In the Response action field, select Isolate.
Enter a comment describing why you’re isolating the host (optional).
To finish adding the response action, click Create & enable rule (for a new rule) or Save changes (for existing rules).
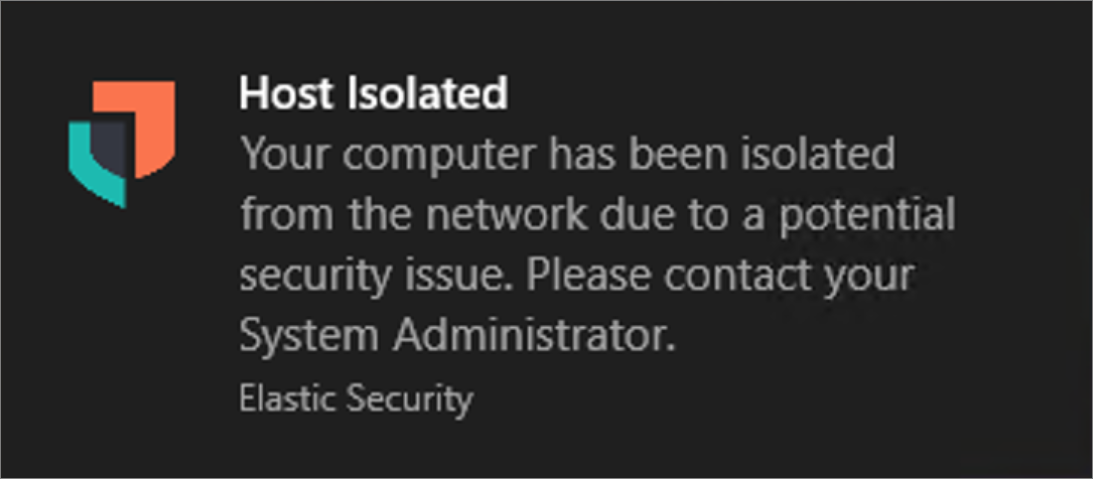
After the host is successfully isolated, an Isolated status is added to the endpoint. Active end users receive a notification that the computer has been isolated from the network:
Release a host from an event or detection alert
Do one of the following:
- The Elastic Stack includes Elastic's core products such as Elasticsearch, Kibana, Logstash, and Beats. Availability Generally available since 9.1 This functionality is generally available and ready for production usage. Unless stated otherwise on the page, this functionality is available when your Elastic Stack is deployed on Elastic Cloud Hosted, Elastic Cloud Enterprise, Elastic Cloud on Kubernetes, and self-managed environments. This documentation corresponds to the latest patch available for each minor version. If you're not using the latest patch, check the release notes for changes. From the event analyzer view: Click an event.
- From the Alerts table or Timeline: Click View details ().
- From a case with an attached alert: Click Show alert details (>).
From the alert details flyout, click Take action → Release host.
Enter a comment describing why you’re releasing the host (optional).
Click Confirm.
Release a host from an endpoint
Find Endpoints in the navigation menu or use the global search field, then either:
- Select the appropriate endpoint in the Endpoint column, and click Take action → Release host in the endpoint details flyout.
- Click the Actions menu (…) on the appropriate endpoint, then select Release host.
Enter a comment describing why you’re releasing the host (optional).
Click Confirm.
Release a host from the response console
The response console requires the appropriate subscription in Elastic Stack or project feature tier in Serverless.
Open the response console for the host (select the Respond button or actions menu option on the host, endpoint, or alert details view).
Enter the
releasecommand and an optional comment in the input area, for example:release --comment "Release this host"Press Return.
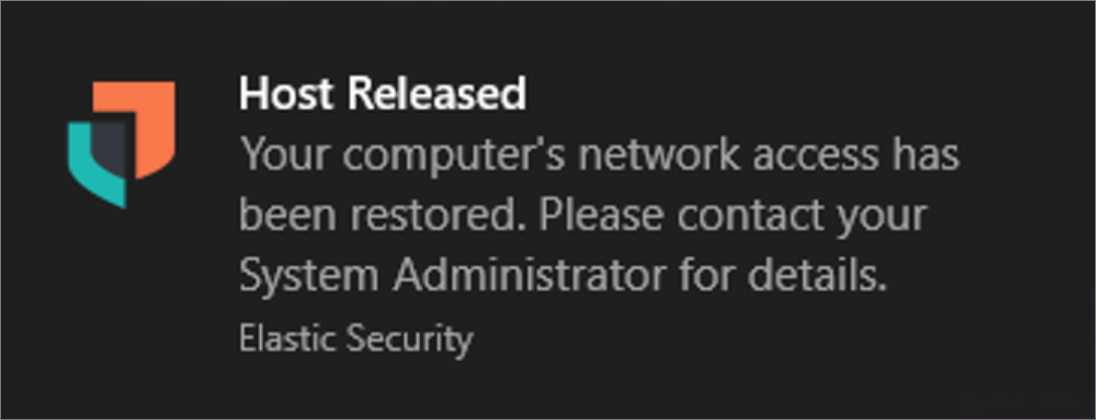
After the host is successfully released, the Isolated status is removed from the endpoint. Active end users receive a notification that the computer has been reconnected to the network:
To confirm if a host has been successfully isolated or released, check the response actions history, which logs the response actions performed on a host.
Go to the Endpoints page, click an endpoint’s name, then click the Response action history tab. You can filter the information displayed in this view. Refer to Response actions history for more details.