Discover tables in Elastic Agent Builder chat
Elastic Cloud Serverless projects are autoscaled environments, fully managed by Elastic and available on Elastic Cloud. Availability This functionality is experimental and is not ready for production usage. Experimental features may change or be removed at any time. Elastic will work to fix any issues, but experimental features are not subject to the support SLA of official GA features. Specific Support terms apply. Serverless interfaces and procedures might differ from classic Elastic Stack deployments. The Elastic Stack includes Elastic's core products such as Elasticsearch, Kibana, Logstash, and Beats. Availability We plan to add this functionality in a future Elastic Stack update. Subject to changes. Unless stated otherwise on the page, this functionality is available when your Elastic Stack is deployed on Elastic Cloud Hosted, Elastic Cloud Enterprise, Elastic Cloud on Kubernetes, and self-managed environments. This documentation corresponds to the latest patch available for each minor version. If you're not using the latest patch, check the release notes for changes.
Serverless
Experimental
Experimental
Stack
Planned
Planned
When you ask an agent to show matching documents, events, or logs, it can display them in an interactive Discover table in the conversation. Without leaving the chat, you can inspect individual documents, change the time range, open the results in Discover, or save the table to a dashboard.
The built-in discover-session skill powers this feature. Requests for charts, metrics, trends, or aggregated summaries produce a Lens visualization instead.
- Turn on the
agentBuilder:experimentalFeaturesadvanced setting. Thediscover-sessionskill is hidden until you do. You don't need this setting when you start from Discover. - Use the default Elastic AI Agent, or a custom agent that has either Elastic capabilities turned on or the
discover-sessionskill assigned. - To open the table in Discover, you need the Read or All privilege for Discover.
- To save the table to a dashboard, you need the All privilege for Dashboard.
Describe the documents you want to see. The agent writes an ES|QL query and shows the results in a Discover table in the conversation. For example:
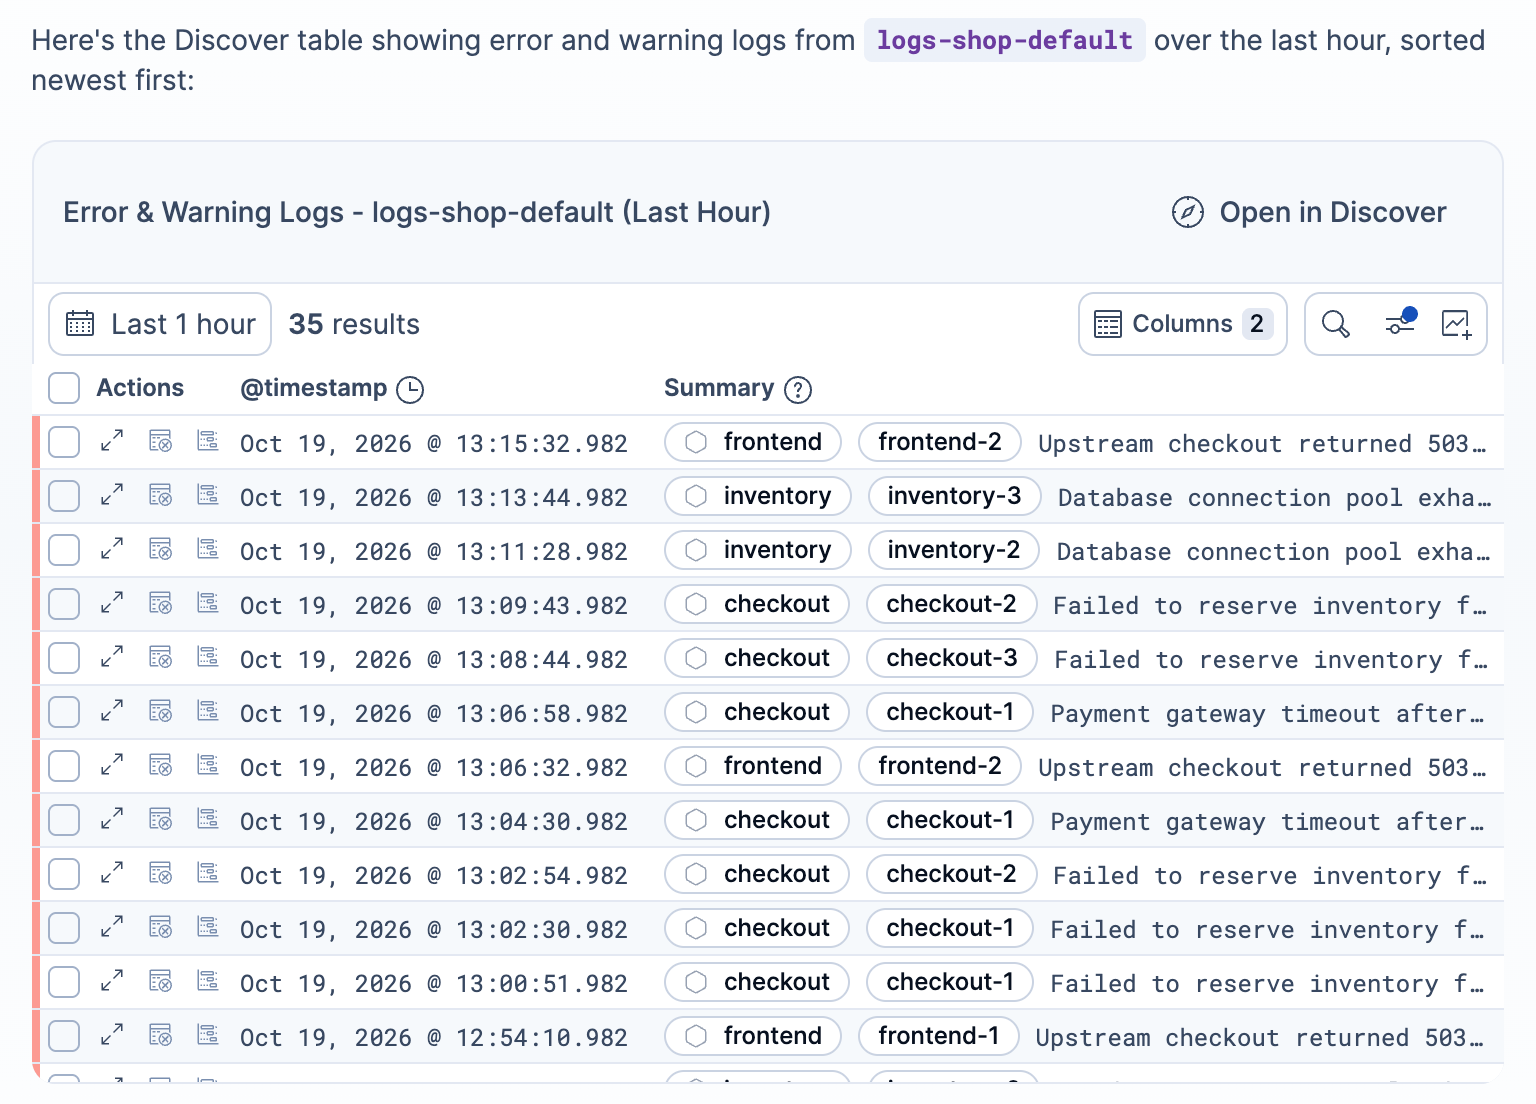
Show me error and warning logs from logs-* for the last hour in a Discover table in this chat.
Discover tables support ES|QL queries only, and the agent can't use aggregating queries, such as queries with STATS or PROMQL, for a table. To see aggregated results, ask for a chart instead. For example, Chart error logs over time produces a Lens visualization.
The Elastic Stack includes Elastic's core products such as Elasticsearch, Kibana, Logstash, and Beats.
Availability
Planned
We plan to add this functionality in a future Elastic Stack update. Subject to changes.
Unless stated otherwise on the page, this functionality is available when your Elastic Stack is deployed on Elastic Cloud Hosted, Elastic Cloud Enterprise, Elastic Cloud on Kubernetes, and self-managed environments.
This documentation corresponds to the latest patch available for each minor version. If you're not using the latest patch, check the release notes for changes.
Elastic Cloud Serverless projects are autoscaled environments, fully managed by Elastic and available on Elastic Cloud.
Availability
Preview
This functionality is in technical preview and is ready for evaluation. Use with caution in production; it is not recommended for mission-critical workloads. Elastic will work to fix any issues, but features in technical preview are not subject to the support SLA of official GA features. Specific Support terms apply.
Serverless interfaces and procedures might differ from classic Elastic Stack deployments.
If you start the conversation from Discover in ES|QL mode, the discover-data-analysis skill can also show the current documents in a Discover table, even when the agentBuilder:experimentalFeatures setting is off. For details on starting a conversation from Discover, refer to Analyze your data with AI.
The table works like a compact version of the Discover document table:
- Context-aware columns and cells: When your data matches a context-aware experience, the table uses its columns, cell rendering, row indicators, and document views. The experience depends on the solution view or project type you're chatting from. For example, when you chat from an Observability solution view or project, logs data shows log-level badges, severity row indicators, the Summary column, and the Log overview document view.
- Local time range: The table has its own time picker. Changing it updates only this table, not the global Kibana time range. If you don't ask for a specific time range, the table uses the time range of the page you're chatting from. If that page has no time range, the table uses the last 24 hours.
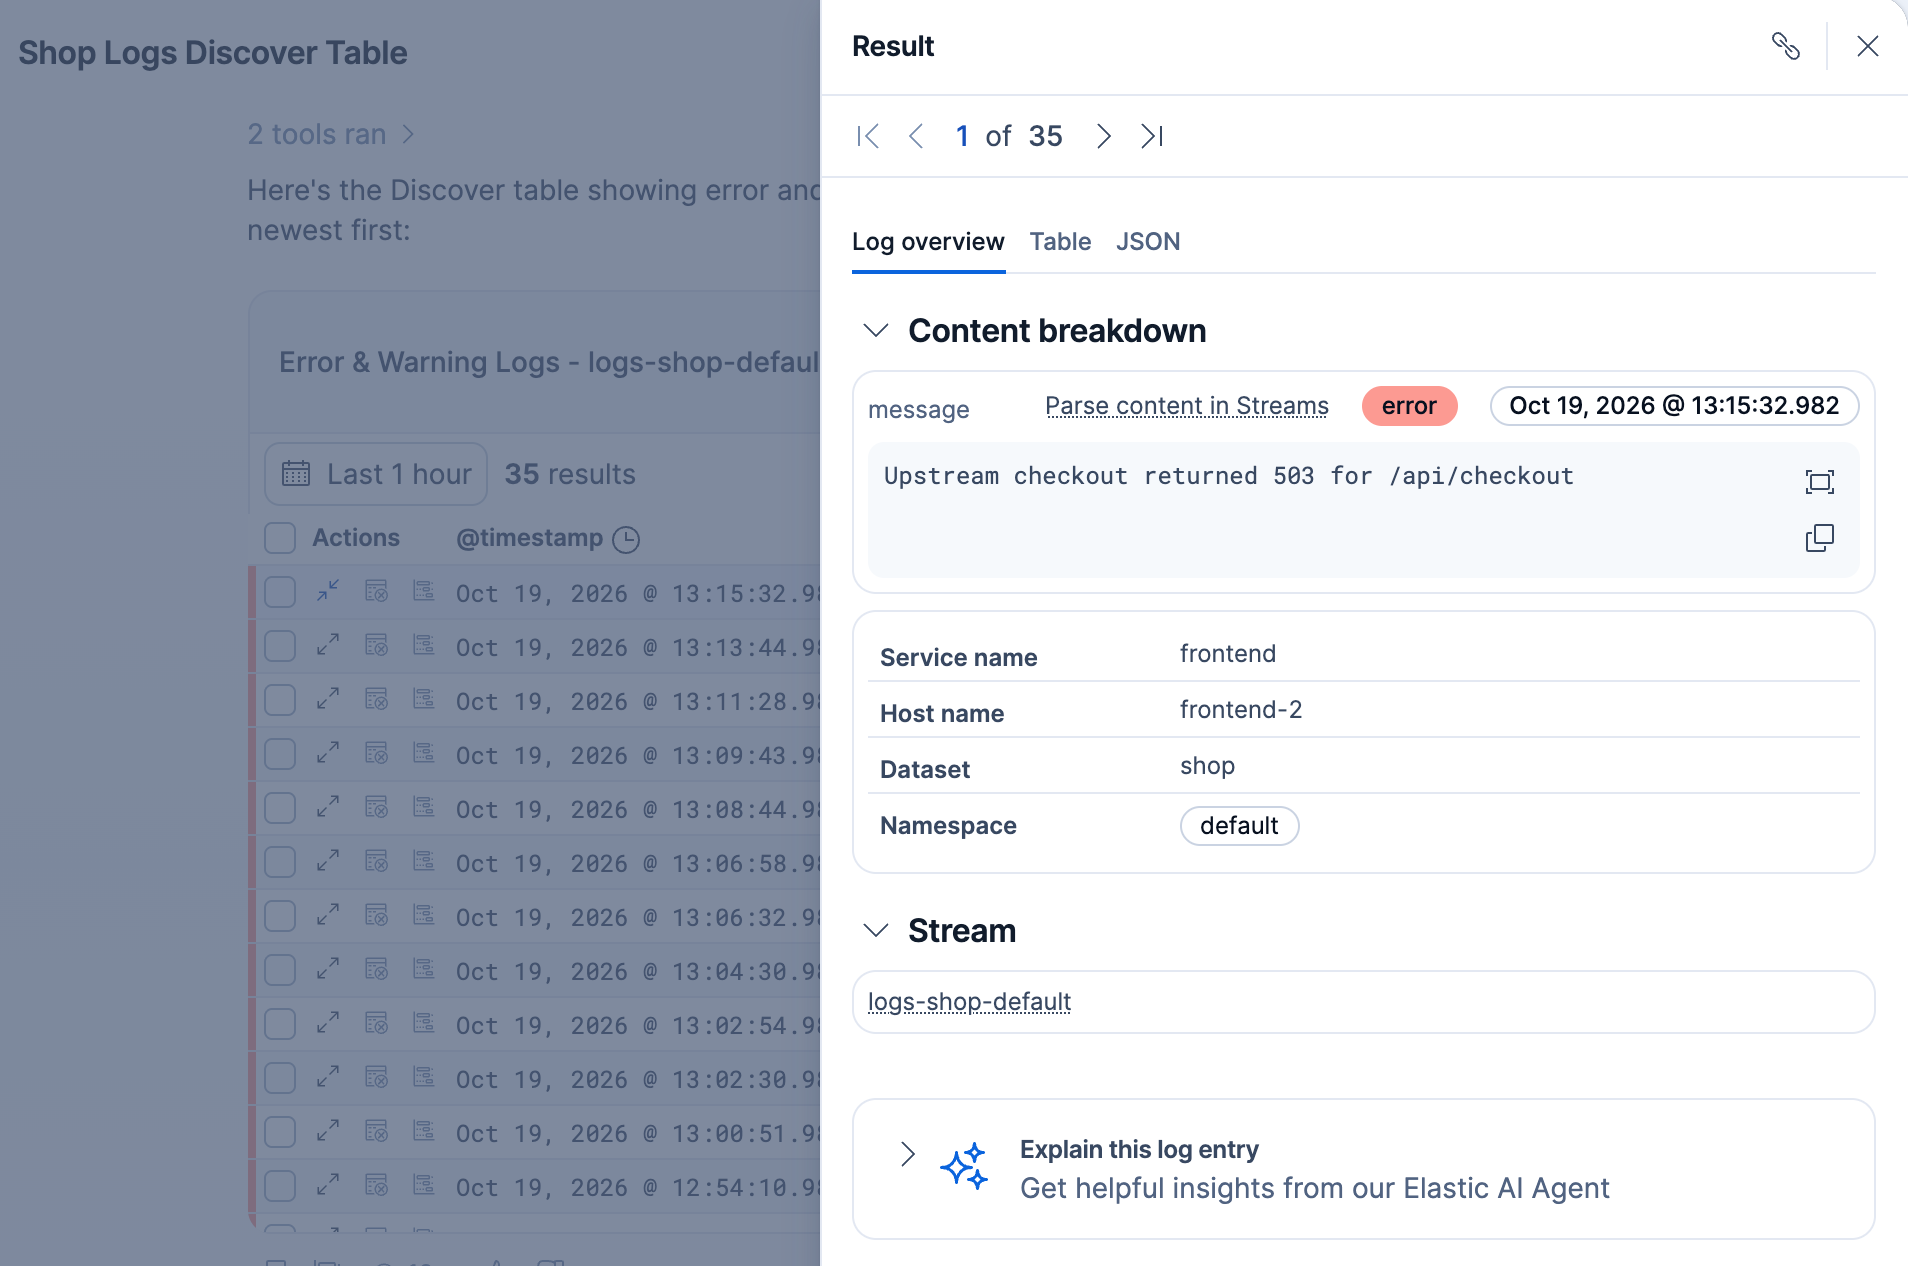
- Document details: Select View details on a row to open the document in a flyout over the conversation.
- Columns: Select Columns in the table toolbar to change which columns appear. Your column changes carry over when you open the table in Discover or save it to a dashboard.
- Horizontal scrolling: Scroll sideways to see more columns in the narrow chat area.
The following example shows a Discover table of error and warning logs in a conversation:
The following example shows the document flyout for a log document:
Send a follow-up message to change the table. For example, after asking for error and warning logs from the last hour, ask for only errors from the last 15 minutes. The agent updates the existing table instead of creating a new one.
To keep the first table and add another, ask for a new table. If the conversation contains more than one table and your request is unclear, the agent asks which one to update.
Select Open in Discover to continue working in Discover. The results open in a new Discover tab with the same ES|QL query, time range, columns, and sort order as the table.
This button appears only if you have the Read or All privilege for Discover.
Add the table to a new or existing dashboard as a panel. This works like saving a table to a dashboard from Discover.
- In the table toolbar, select Save table to dashboard. The Save Discover session dialog opens.
- Edit the pre-filled title for the panel if needed, and optionally add a description.
- In Add to dashboard, select Existing and then select a dashboard from the list, or select New to create one.
- Select Save and go to dashboard. The dashboard opens in edit mode with the table added as a panel.
- Save the dashboard to keep the panel.
The panel stores the query and your visible columns with the dashboard. It uses the dashboard's time range, not the table's. Despite the dialog title, the table isn't saved as a separate Discover session.
If you don't have the All privilege for Dashboard, Save table to dashboard is disabled.
Discover tables in chat have the following limitations:
- You can't save a table as a Discover session, or attach an existing Discover session to the conversation.
- Tables support ES|QL only. KQL queries and Discover sessions saved in classic mode aren't supported.
- Tables don't have a filter bar.
- The agent can't add Discover tables to the dashboards it creates. You can still save a table to a dashboard yourself.