Run a pattern analysis on your log data in Discover
Elastic Cloud Serverless projects are autoscaled environments, fully managed by Elastic and available on Elastic Cloud. Availability This functionality is generally available and ready for production usage. Serverless interfaces and procedures might differ from classic Elastic Stack deployments. The Elastic Stack includes Elastic's core products such as Elasticsearch, Kibana, Logstash, and Beats. Availability This functionality is generally available and ready for production usage. Unless stated otherwise on the page, this functionality is available when your Elastic Stack is deployed on Elastic Cloud Hosted, Elastic Cloud Enterprise, Elastic Cloud on Kubernetes, and self-managed environments. This documentation corresponds to the latest patch available for each minor version. If you're not using the latest patch, check the release notes for changes.
Serverless
Generally available
Stack
Generally available
If your logs are free-form messages, pattern analysis groups similar messages into patterns, so you can see which ones are common, filter out the noise, and focus on unusual messages while you troubleshoot. For each pattern, Discover shows how its messages are distributed over time in a chart, and gives example documents.
- Make sure Discover is in classic mode. ES|QL mode doesn't support this functionality. To switch, refer to Switch to Discover's classic mode.
- You need a Platinum or Enterprise subscription or an active trial for Elastic Stack. Pattern analysis relies on a feature that requires it.
- Discover must have a data view selected that has a time field and contains a text field, and a time range that contains data.
- This example uses the web logs sample data. To follow along, add it and select its data view, or use your own log data.
In ES|QL mode, you can group similar messages in a query.
Go to Discover.
Expand the data view menu, and select Kibana Sample Data Logs.
If you don't see any results, expand the time range, for example, to Last 7 days.
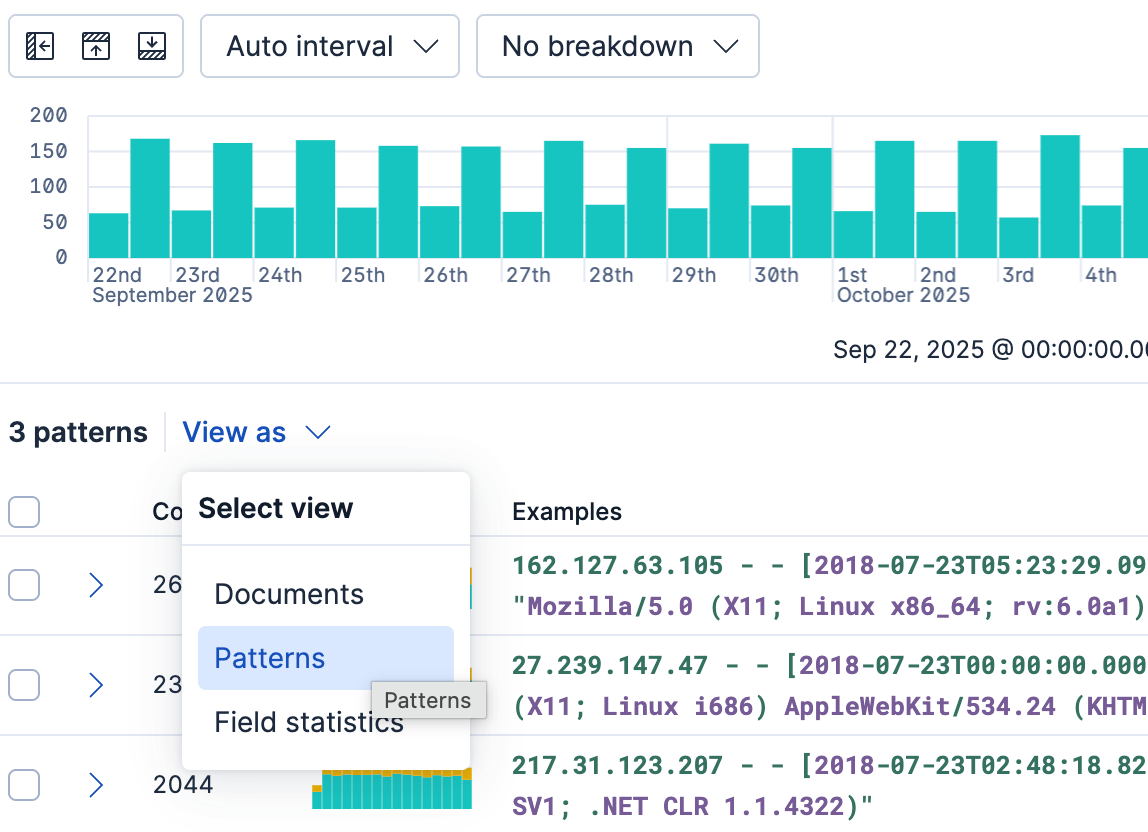
Select Patterns (or View as → Patterns, depending on your version). Discover groups the messages of a text field into patterns and lists them with the chart.
Optional: To analyze a different text field, change the field in the field selector.
Optional: To calculate patterns over a longer period than the time range you set in step 3, select the Options button to open the Pattern analysis settings, and set the Minimum time range. A longer range improves accuracy. The list still shows the patterns for the time range you set in step 3.
Optional: To focus on specific messages, select one or more patterns, and then select Filter for patterns in Discover. To hide the messages that match them instead, select Filter out patterns in Discover.
Result: Discover shows the patterns in your log messages. After you filter, the table shows only the documents that match the patterns you kept, or only the ones that don't match the patterns you filtered out.
To find unusual behavior in a pattern, create a categorization anomaly detection job from the Patterns view. This needs permission to create anomaly detection jobs, and Discover doesn't show the button without it.