Infrastructure
Elastic Cloud Serverless projects are autoscaled environments, fully managed by Elastic and available on Elastic Cloud. Availability This functionality is generally available and ready for production usage. Serverless interfaces and procedures might differ from classic Elastic Stack deployments. The Elastic Stack includes Elastic's core products such as Elasticsearch, Kibana, Logstash, and Beats. Availability This functionality is generally available and ready for production usage. This functionality is in beta and is not ready for production usage. For beta features, the design and code is less mature than official GA features and is being provided as-is with no warranties. Beta features are not subject to the support SLA of official GA features. Specific Support terms apply. Unless stated otherwise on the page, this functionality is available when your Elastic Stack is deployed on Elastic Cloud Hosted, Elastic Cloud Enterprise, Elastic Cloud on Kubernetes, and self-managed environments. This documentation corresponds to the latest patch available for each minor version. If you're not using the latest patch, check the release notes for changes.
Serverless
Generally available
Stack
GA
9.5+
…
Generally available since 9.5
Beta from 9.0 to 9.4
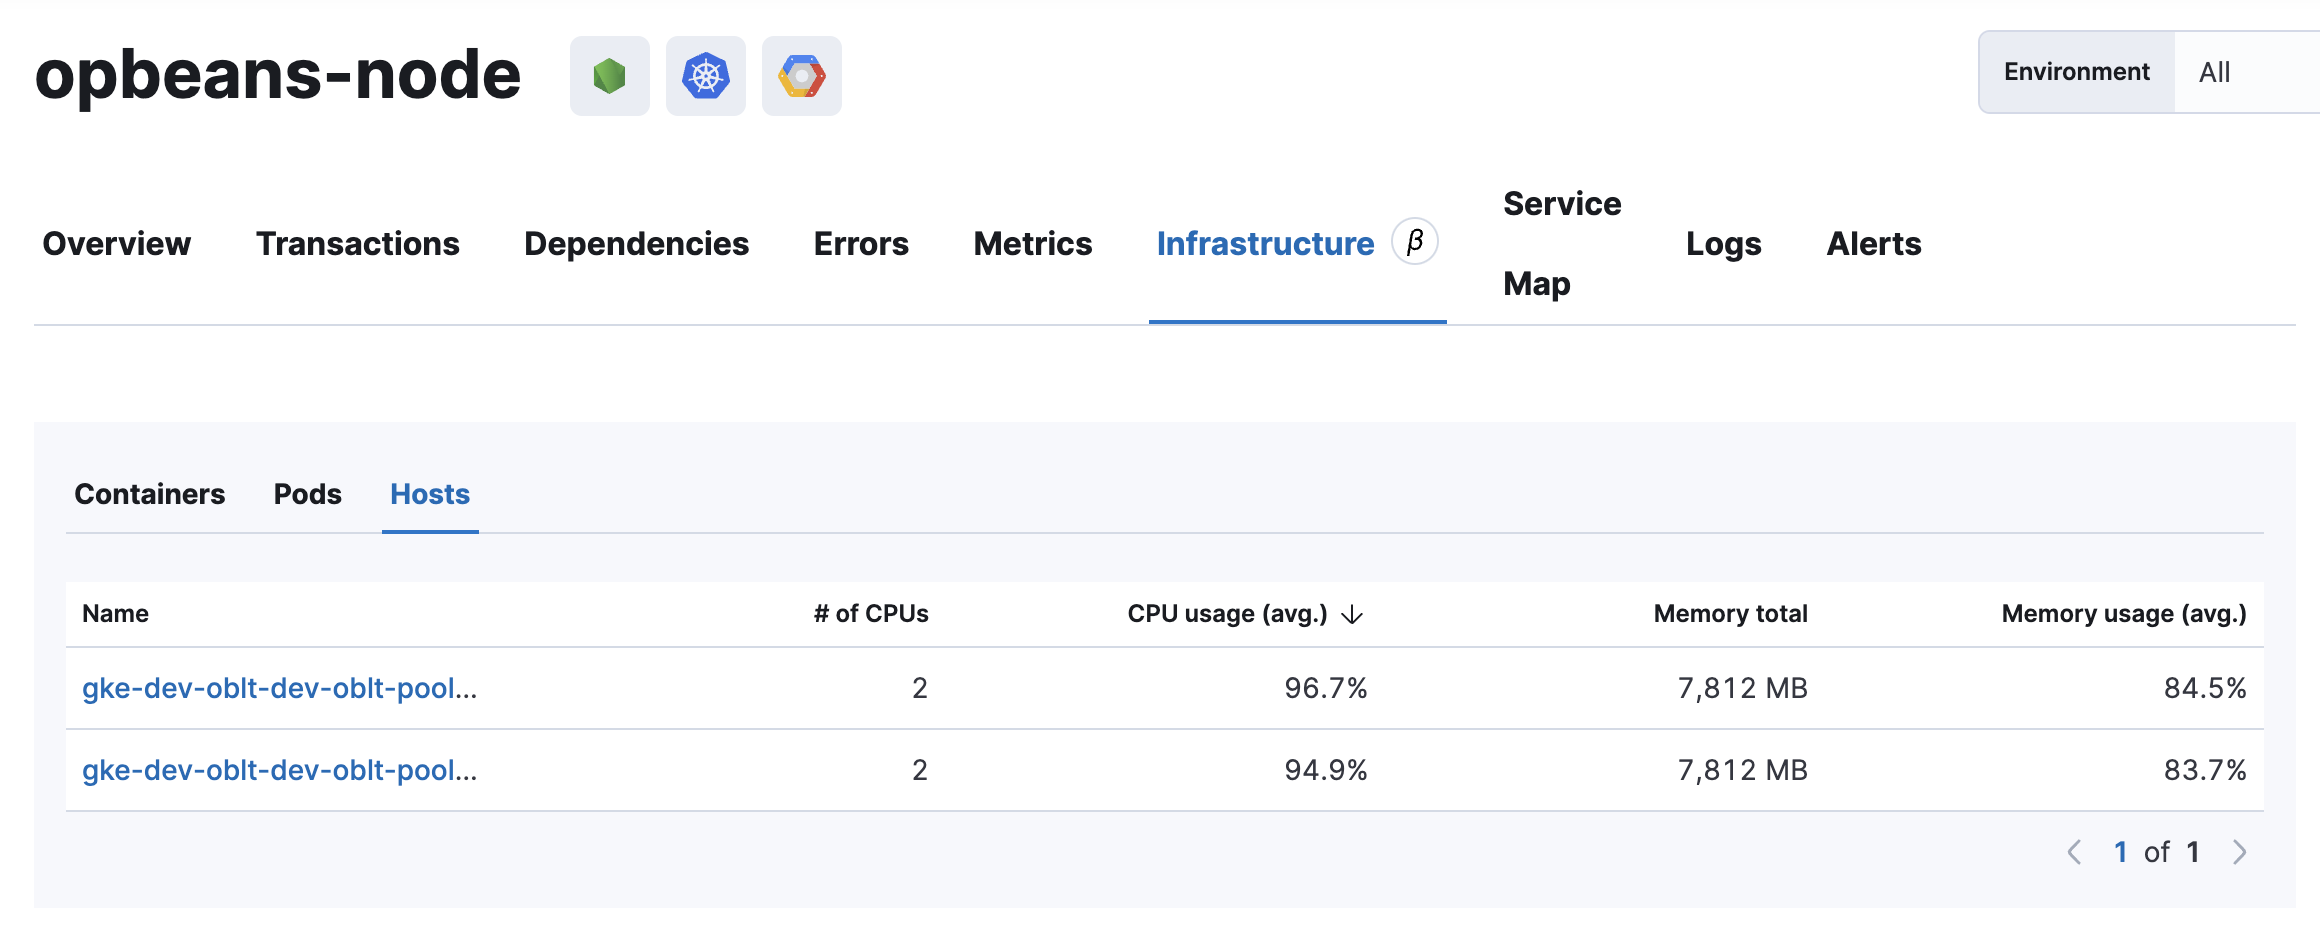
The Infrastructure tab provides information about the containers, pods, and hosts that the selected service is linked to. The data sources and navigation behavior depend on whether the service is instrumented with Elastic APM or OpenTelemetry (OTel).
IT ops and software reliability engineers (SREs) can use this tab to quickly find a service’s underlying infrastructure resources when debugging a problem. Knowing what infrastructure is related to a service allows you to remediate issues by restarting, killing hanging instances, changing configuration, rolling back deployments, scaling up, scaling out, and so on.
Why is the infrastructure tab empty?
If there is no data in the Application UI’s infrastructure tab for a selected service, you can read more about why this happens and how to fix it in the troubleshooting docs.
For services instrumented with Elastic APM, the tab uses the following data sources:
- Pods: Uses the
kubernetes.pod.namefrom the APM metrics data streams. - Containers: Uses the
container.idfrom the APM metrics data streams. - Hosts: If the application is containerized—if the APM metrics documents include
container.id—thehost.nameis used from the infrastructure data streams (filtered bycontainer.id). If not,host.hostnameis used from the APM metrics data streams.
Elastic Cloud Serverless projects are autoscaled environments, fully managed by Elastic and available on Elastic Cloud. Availability This functionality is generally available and ready for production usage. Serverless interfaces and procedures might differ from classic Elastic Stack deployments. The Elastic Stack includes Elastic's core products such as Elasticsearch, Kibana, Logstash, and Beats. Availability This functionality is generally available and ready for production usage. Unless stated otherwise on the page, this functionality is available when your Elastic Stack is deployed on Elastic Cloud Hosted, Elastic Cloud Enterprise, Elastic Cloud on Kubernetes, and self-managed environments. This documentation corresponds to the latest patch available for each minor version. If you're not using the latest patch, check the release notes for changes.
Serverless
Generally available
Stack
9.4+
Generally available since 9.4
For services instrumented with OpenTelemetry, the tab exclusively shows OTel-observed infrastructure. Click-through destinations differ by resource type:
Hosts: Links to the Hosts UI, which supports OpenTelemetry and its semantic conventions.
Containers and Pods: Link to Metrics in Discover.
Elastic Cloud Serverless projects are autoscaled environments, fully managed by Elastic and available on Elastic Cloud. Availability Generally available This functionality is generally available and ready for production usage. Serverless interfaces and procedures might differ from classic Elastic Stack deployments. The Elastic Stack includes Elastic's core products such as Elasticsearch, Kibana, Logstash, and Beats. Availability Planned We plan to add this functionality in a future Elastic Stack update. Subject to changes. Unless stated otherwise on the page, this functionality is available when your Elastic Stack is deployed on Elastic Cloud Hosted, Elastic Cloud Enterprise, Elastic Cloud on Kubernetes, and self-managed environments. This documentation corresponds to the latest patch available for each minor version. If you're not using the latest patch, check the release notes for changes. The Infrastructure Inventory does show Kubernetes pods collected using OpenTelemetry, but this tab still links to Metrics in Discover for both containers and pods. Refer to Select the data collection schema for how that view chooses which pods to show.
The Infrastructure tab assumes you're observing the service and its underlying infrastructure (hosts, pods, containers) using the same schema. The schema is inferred from the APM agent name:
Elastic APM Agent or Elastic Agent system integration: Queries ECS data from Metricbeat or Elastic Agent integrations.
OTel SDK or EDOT SDK: Queries OpenTelemetry semantic convention (semconv) data from the OTel Collector or Elastic Agent (for example, hostmetricsreceiver.otel, kubeletstatsreceiver.otel, dockerstatsreceiver.otel).
Cross-schema setups show as N/A:
- A service instrumented with Elastic APM or Elastic Agent, but running on infrastructure observed only by the OTel Collector.
- A service instrumented with an OTel or EDOT SDK, but running on infrastructure observed only by Metricbeat or the Elastic Agent system, Kubernetes, or Docker integrations.
To see infrastructure metrics, make sure the service instrumentation and the infrastructure collector use the same schema.
Elastic Cloud Serverless projects are autoscaled environments, fully managed by Elastic and available on Elastic Cloud. Availability This functionality is generally available and ready for production usage. Serverless interfaces and procedures might differ from classic Elastic Stack deployments. The Elastic Stack includes Elastic's core products such as Elasticsearch, Kibana, Logstash, and Beats. Availability This functionality is generally available and ready for production usage. Unless stated otherwise on the page, this functionality is available when your Elastic Stack is deployed on Elastic Cloud Hosted, Elastic Cloud Enterprise, Elastic Cloud on Kubernetes, and self-managed environments. This documentation corresponds to the latest patch available for each minor version. If you're not using the latest patch, check the release notes for changes.
Serverless
Generally available
Stack
9.5+
Generally available since 9.5
To compare infrastructure metric trends across all entities a service depends on, select the Hosts, Pods, or Containers tab, then click Compare metrics in Discover. This opens the data in Discover, broken down by entity so you can compare trends side by side.
The breakdown field for each resource type:
| Resource | Breakdown field |
|---|---|
| Hosts | host.name |
| Pods | k8s.pod.name |
| Containers | container.id |