Import a dashboard
Elastic Cloud Serverless projects are autoscaled environments, fully managed by Elastic and available on Elastic Cloud. Availability This functionality is generally available and ready for production usage. Serverless interfaces and procedures might differ from classic Elastic Stack deployments. The Elastic Stack includes Elastic's core products such as Elasticsearch, Kibana, Logstash, and Beats. Availability This functionality is generally available and ready for production usage. Unless stated otherwise on the page, this functionality is available when your Elastic Stack is deployed on Elastic Cloud Hosted, Elastic Cloud Enterprise, Elastic Cloud on Kubernetes, and self-managed environments. This documentation corresponds to the latest patch available for each minor version. If you're not using the latest patch, check the release notes for changes.
Serverless
Generally available
Stack
Generally available
If you exported a dashboard from another Kibana space, instance, deployment, or project, you can import it into your own in one of these ways:
- Elastic Cloud Serverless projects are autoscaled environments, fully managed by Elastic and available on Elastic Cloud. Availability Generally available This functionality is generally available and ready for production usage. Serverless interfaces and procedures might differ from classic Elastic Stack deployments. The Elastic Stack includes Elastic's core products such as Elasticsearch, Kibana, Logstash, and Beats. Availability Planned We plan to add this functionality in a future Elastic Stack update. Subject to changes. Unless stated otherwise on the page, this functionality is available when your Elastic Stack is deployed on Elastic Cloud Hosted, Elastic Cloud Enterprise, Elastic Cloud on Kubernetes, and self-managed environments. This documentation corresponds to the latest patch available for each minor version. If you're not using the latest patch, check the release notes for changes. From the Dashboards app: Import a JSON file from Export JSON or from the Dashboards API.
- Elastic Cloud Serverless projects are autoscaled environments, fully managed by Elastic and available on Elastic Cloud. Availability Generally available This functionality is generally available and ready for production usage. Serverless interfaces and procedures might differ from classic Elastic Stack deployments. The Elastic Stack includes Elastic's core products such as Elasticsearch, Kibana, Logstash, and Beats. Availability Generally available since 9.5 This functionality is generally available and ready for production usage. Preview in 9.4 This functionality is in technical preview and is ready for evaluation. Use with caution in production; it is not recommended for mission-critical workloads. Elastic will work to fix any issues, but features in technical preview are not subject to the support SLA of official GA features. Specific Support terms apply. Unless stated otherwise on the page, this functionality is available when your Elastic Stack is deployed on Elastic Cloud Hosted, Elastic Cloud Enterprise, Elastic Cloud on Kubernetes, and self-managed environments. This documentation corresponds to the latest patch available for each minor version. If you're not using the latest patch, check the release notes for changes. With the Dashboards API: Send a dashboard JSON definition to the Dashboards API. Get the definition from Export JSON or from the Dashboards API.
- From Saved Objects: Import an NDJSON file from a previous saved objects export. Use the Saved Objects page or the Saved Objects API.
The JSON methods are recommended because they rely on the Dashboards API.
Elastic Cloud Serverless projects are autoscaled environments, fully managed by Elastic and available on Elastic Cloud. Availability Generally available This functionality is generally available and ready for production usage. Serverless interfaces and procedures might differ from classic Elastic Stack deployments. The Elastic Stack includes Elastic's core products such as Elasticsearch, Kibana, Logstash, and Beats. Availability Planned We plan to add this functionality in a future Elastic Stack update. Subject to changes. Unless stated otherwise on the page, this functionality is available when your Elastic Stack is deployed on Elastic Cloud Hosted, Elastic Cloud Enterprise, Elastic Cloud on Kubernetes, and self-managed environments. This documentation corresponds to the latest patch available for each minor version. If you're not using the latest patch, check the release notes for changes. Recreate a dashboard from its JSON file without writing an API request. Kibana checks the file as soon as you select it, so you can see what it removes and what the dashboard depends on before you import.
Prerequisites
- A dashboard JSON file of 1 MB or less, from Export JSON or from the Dashboards API.
- All privilege for the Dashboard feature in Kibana. Without it, Import dashboard doesn't appear.
Import the file
- Go to Dashboards.
- From the application menu, select Import dashboard.
- In the Import dashboard flyout, select your file under Select a JSON file. Kibana checks the file right away.
- Review any messages in the flyout. If Kibana shows an error, fix the file or select a different one. If it shows a warning, review it before you continue.
- Select Import.
Kibana creates a new dashboard in the current space, closes the flyout, shows a confirmation message, and refreshes the list of dashboards so the new dashboard appears. It never updates an existing dashboard, so importing the same file again creates another dashboard.
Messages after you select a file
| Message | What it means | What to do |
|---|---|---|
| The selected file is too large. The maximum size is 1 MB. | The file is larger than 1 MB. Import stays unavailable. | Select a smaller file. |
| The selected file does not contain valid JSON. | The file isn't valid JSON. Import stays unavailable. | Select a different file. |
| The file could not be imported. | Kibana can't validate the file, for example because it isn't a full dashboard definition. Import stays unavailable. | Select Show details to see why Kibana rejected the file, such as a missing title or a property it doesn't recognize. Then fix the file or select a different one. A valid file comes from Export JSON or is the JSON you send to the Dashboards API to create a dashboard. If Show details doesn't appear, check the file and try again later. If the error persists, contact your administrator. |
| Unsupported properties were removed. | The file includes panel types or properties that the Dashboards API doesn't support. Kibana leaves them out of the imported dashboard. Import stays available. | Select Show details to see what Kibana removed. |
| Review import warnings. | The file references related items, such as data views, tags, or library visualizations. Kibana imports only the dashboard. This warning also lists any removed properties. Import stays available. | Select Show details to see each item's type and ID. Make sure these items exist in the space or cluster where you import. |
Elastic Cloud Serverless projects are autoscaled environments, fully managed by Elastic and available on Elastic Cloud. Availability Generally available This functionality is generally available and ready for production usage. Serverless interfaces and procedures might differ from classic Elastic Stack deployments. The Elastic Stack includes Elastic's core products such as Elasticsearch, Kibana, Logstash, and Beats. Availability Generally available since 9.5 This functionality is generally available and ready for production usage. Preview in 9.4 This functionality is in technical preview and is ready for evaluation. Use with caution in production; it is not recommended for mission-critical workloads. Elastic will work to fix any issues, but features in technical preview are not subject to the support SLA of official GA features. Specific Support terms apply. Unless stated otherwise on the page, this functionality is available when your Elastic Stack is deployed on Elastic Cloud Hosted, Elastic Cloud Enterprise, Elastic Cloud on Kubernetes, and self-managed environments. This documentation corresponds to the latest patch available for each minor version. If you're not using the latest patch, check the release notes for changes. Recreate the dashboard by sending its JSON definition to the Dashboards API.
Prerequisites
- The dashboard's API-compatible JSON. Refer to Export and share Kibana dashboards to produce it.
- All privilege for the Dashboard feature in Kibana.
- A way to call the API, such as Kibana Dev Tools Console or an API key.
Send the JSON to the Dashboards API in the target instance, deployment, or project. The API creates the dashboard in the space identified by the request path, or updates it in place when you send it with an existing ID. The JSON export flow can open a pre-populated request in Kibana Dev Tools Console, where you set the space in the request path before sending it.
For the imported dashboard to work, the objects it references, such as data views and library visualizations, must also exist in the target environment. To version-control dashboards and keep their references portable across environments, refer to Manage dashboards as code.
Import the dashboard and its related objects from an NDJSON file on the Saved Objects page.
Prerequisites
- An NDJSON file containing the dashboard and its related objects. To produce one, refer to Export saved objects.
- All privilege for the Dashboard and Saved Objects Management features in Kibana.
- Access to Stack Management in Kibana.
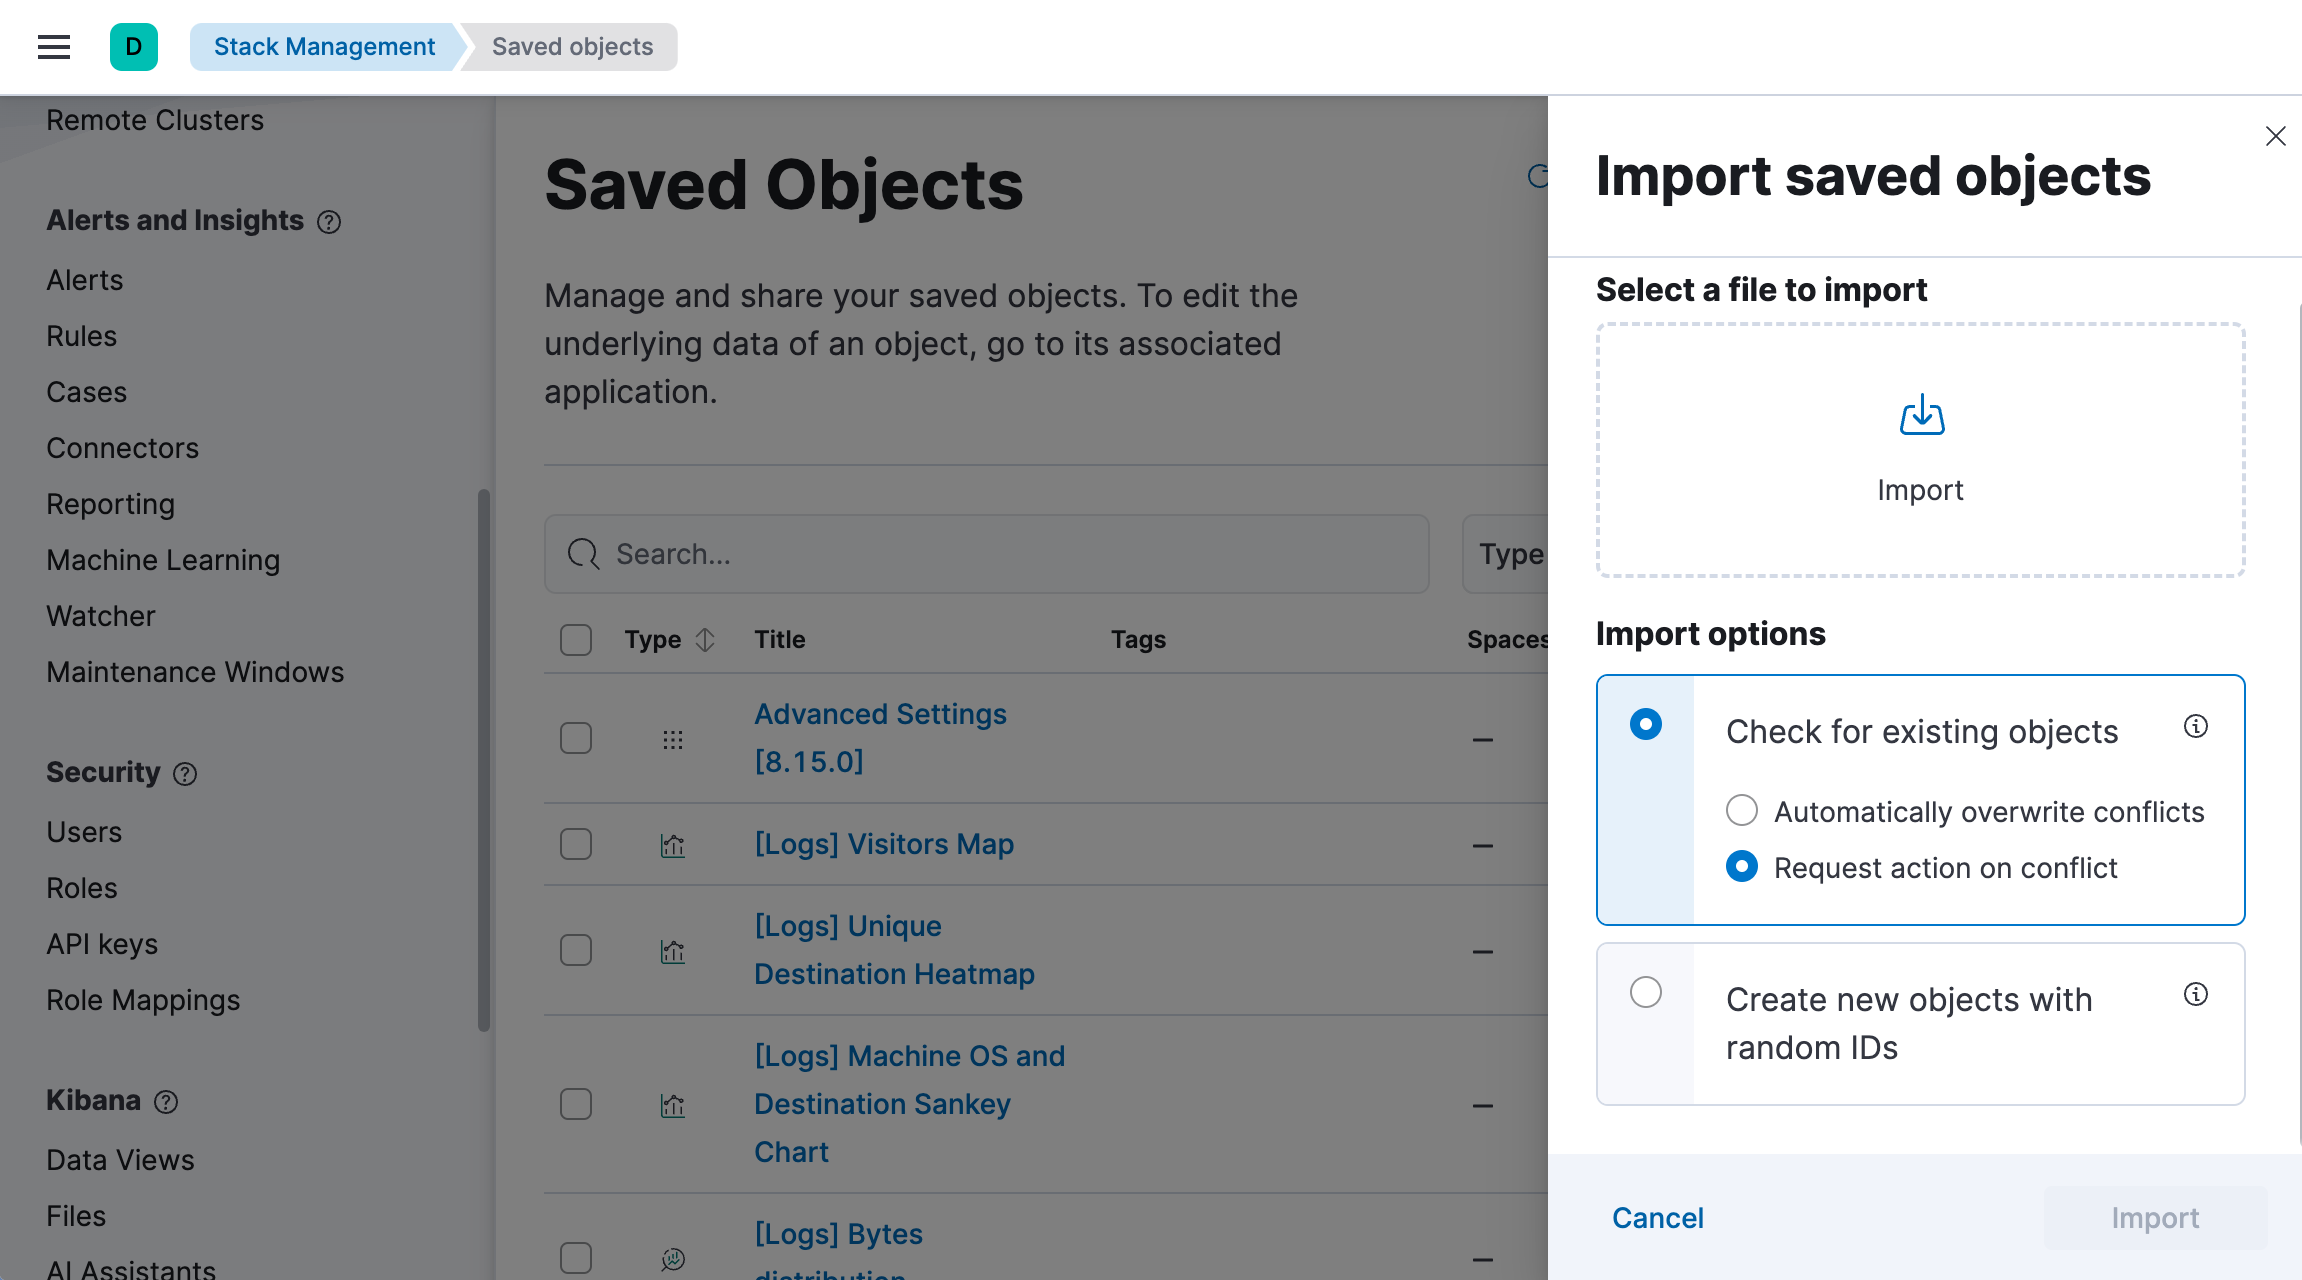
Import the dashboard from the Saved Objects page under Stack Management. When you import a dashboard, you also import its related objects, such as data views and visualizations. Import options control how the import handles these related objects:
- Check for existing objects: When selected, objects are not imported when another object with the same ID already exists in this space or cluster. For example, if you import a dashboard that uses a data view which already exists, the data view is not imported and the dashboard uses the existing data view instead. You can also choose which of the imported or existing objects to keep by selecting Request action on conflict.
- Create new objects with random IDs: All related objects are imported and are assigned a new ID to avoid conflicts.
To automate the import, use the import saved objects API instead.
To move a dashboard to another space within the same deployment, you don't need to export and import it. Instead, copy it to the target space from the Saved Objects page, together with its related objects. To automate this, use the copy saved objects to space API.