Visualize detection alerts
Elastic Cloud Serverless projects are autoscaled environments, fully managed by Elastic and available on Elastic Cloud. Availability This functionality is generally available and ready for production usage. The Elastic Stack includes Elastic's core products such as Elasticsearch, Kibana, Logstash, and Beats. Availability This functionality is generally available and ready for production usage. Unless stated otherwise on the page, this functionality is available when your Elastic Stack is deployed on Elastic Cloud Hosted, Elastic Cloud Enterprise, Elastic Cloud on Kubernetes, and self-managed environments. This documentation corresponds to the latest patch available for each minor version. If you're not using the latest patch, check the release notes for changes.
Serverless Security
Generally available
Stack
Generally available
The Alerts page includes a visualization section that helps you spot patterns, identify high-volume rules, and prioritize investigation. Choose from four view types, each designed for different analysis tasks.
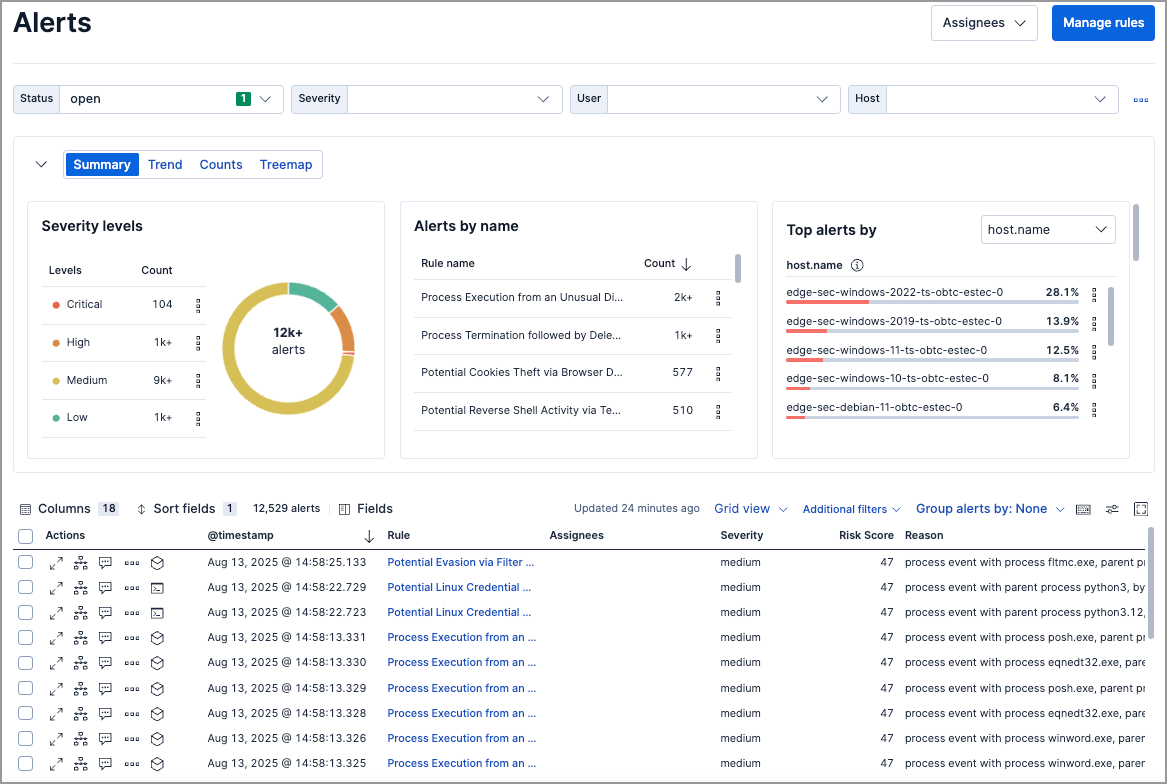
| View | Best for | Supports secondary grouping |
|---|---|---|
| Summary | Quick overview of severity, top rules, and affected hosts/users | No |
| Trend | Spotting alert spikes and patterns over time | No |
| Counts | Comparing alert volumes across rules, hosts, or other fields | Yes |
| Treemap | Identifying the most frequent and critical alert combinations | Yes |
Use the dropdown menus above the visualization to group alerts by ECS fields:
| Menu | Purpose |
|---|---|
| Group by (or Top alerts by) | Primary field for grouping alerts |
| Group by top | Secondary field for subdividing groups (available in Counts and Treemap views) |
Example: Group by kibana.alert.rule.name, then by host.name to see which rules fired and which hosts triggered each rule.
For groupings with many unique values, only the top 1,000 results are displayed.
| Action | How to do it |
|---|---|
| Reset grouping | Hover over the visualization, click , then select Reset group by fields |
| Inspect queries | Click and select Inspect |
| Add to case | Click and select Add to case (Trend and Counts views only) |
| Open in Lens | Click and select Open in Lens (Trend and Counts views only) |
| Collapse visualization | Click to show a compact summary instead |
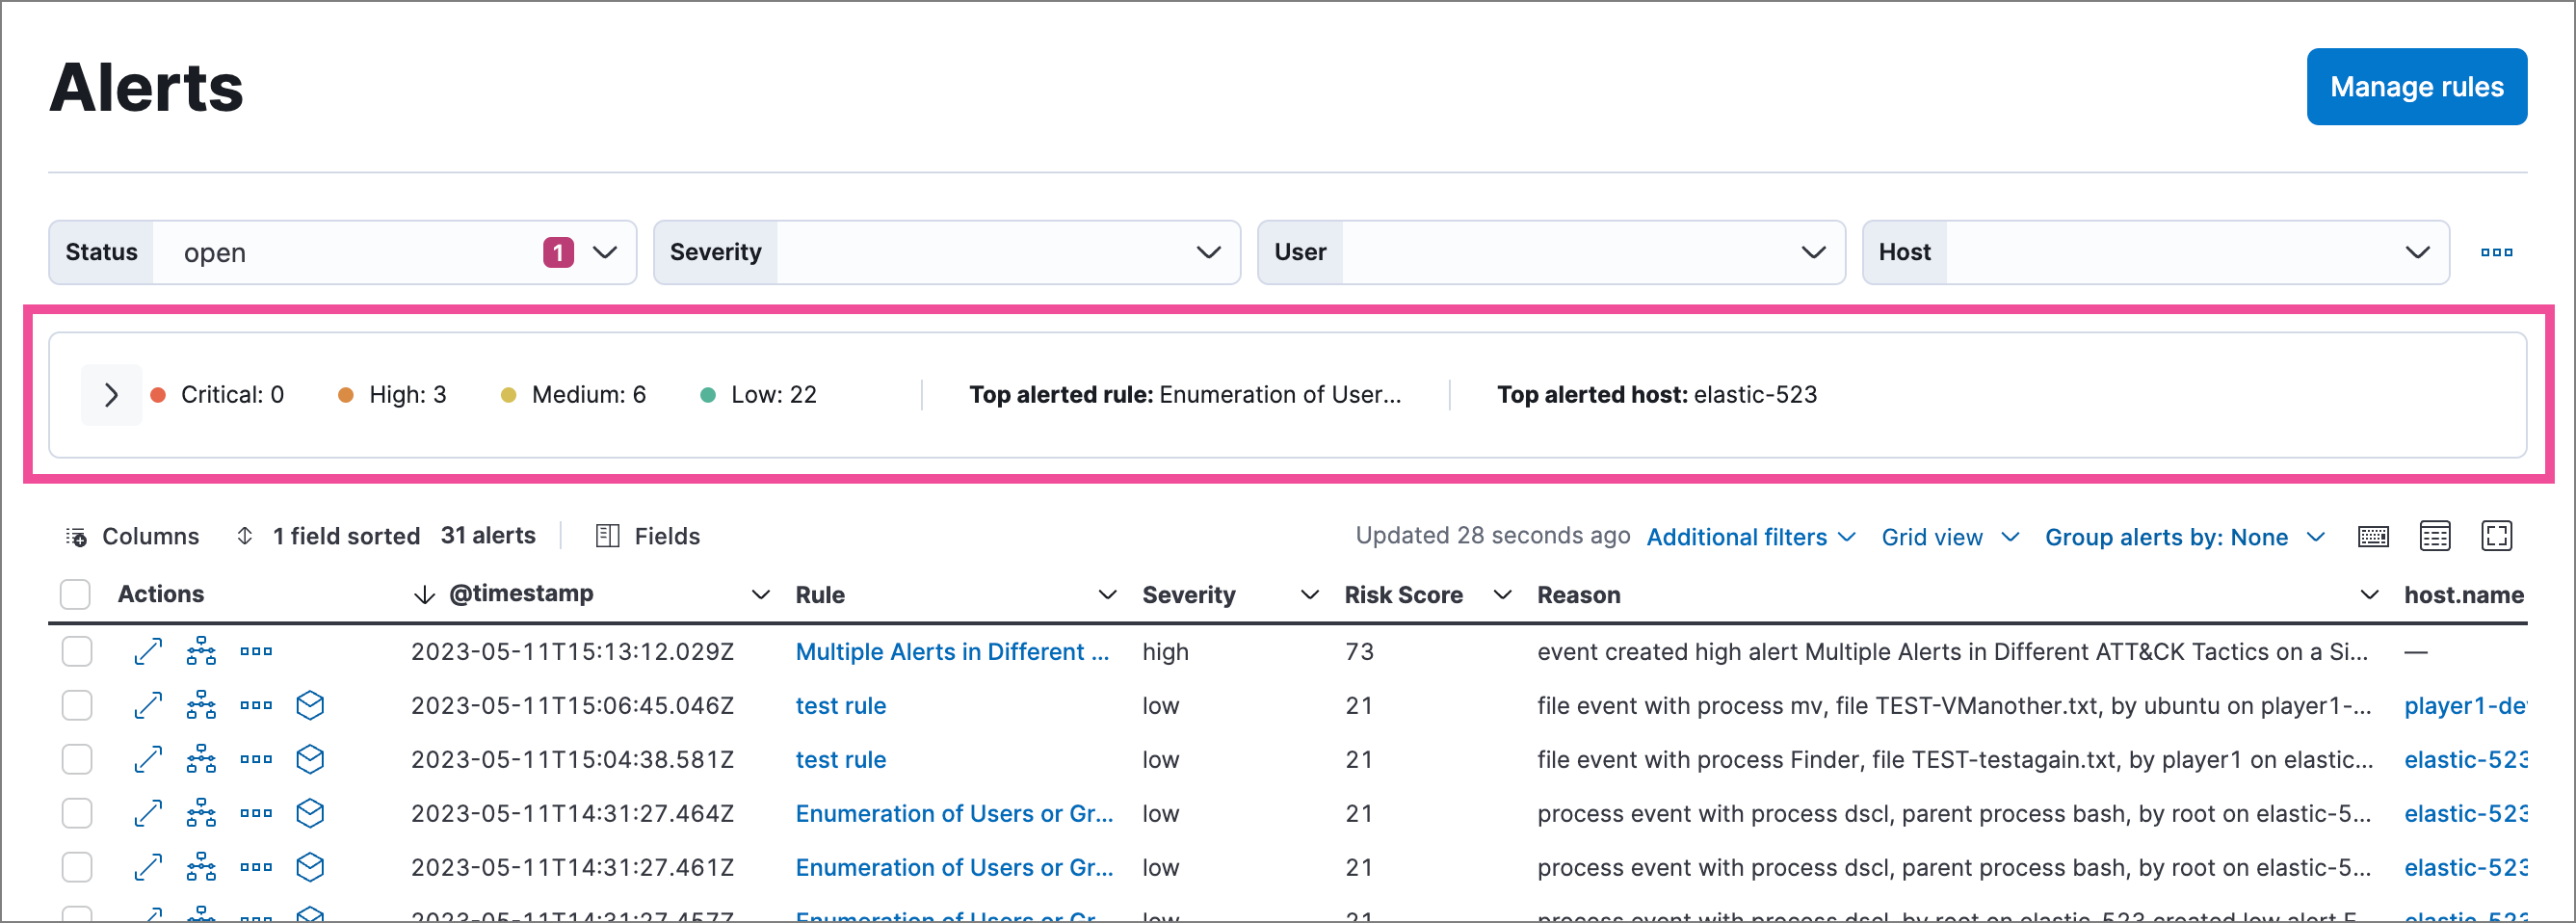
The default view. Shows alert distribution across three panels:
| Panel | What it shows |
|---|---|
| Severity levels | Count of alerts by severity (low, medium, high, critical) |
| Alerts by name | Count of alerts by detection rule |
| Top alerts by | Percentage breakdown by host.name, user.name, source.ip, or destination.ip |
Click any element (severity level, rule name, or host) to filter the Alerts table to those values.
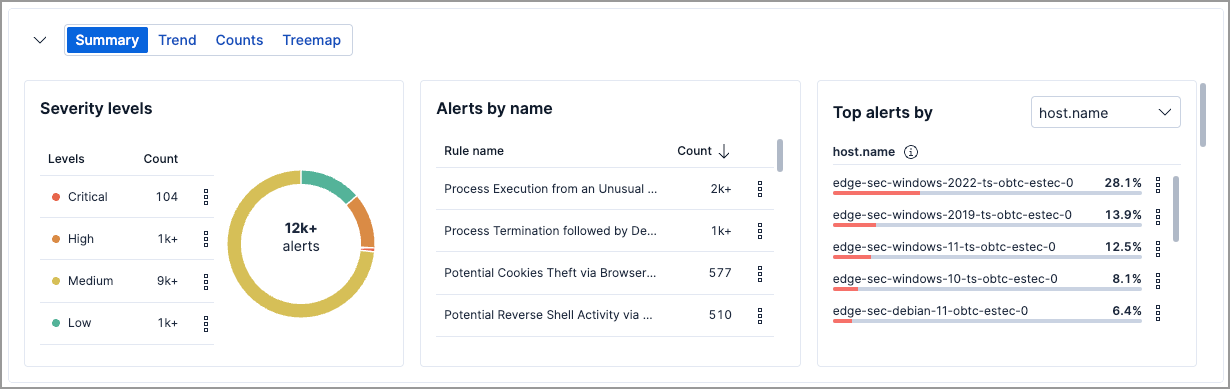
Shows alert volume over time as a stacked area chart. Use this to spot spikes, patterns, or changes in alert activity.
| Setting | Default |
|---|---|
| Group by | kibana.alert.rule.name |
| Secondary grouping | Not available |
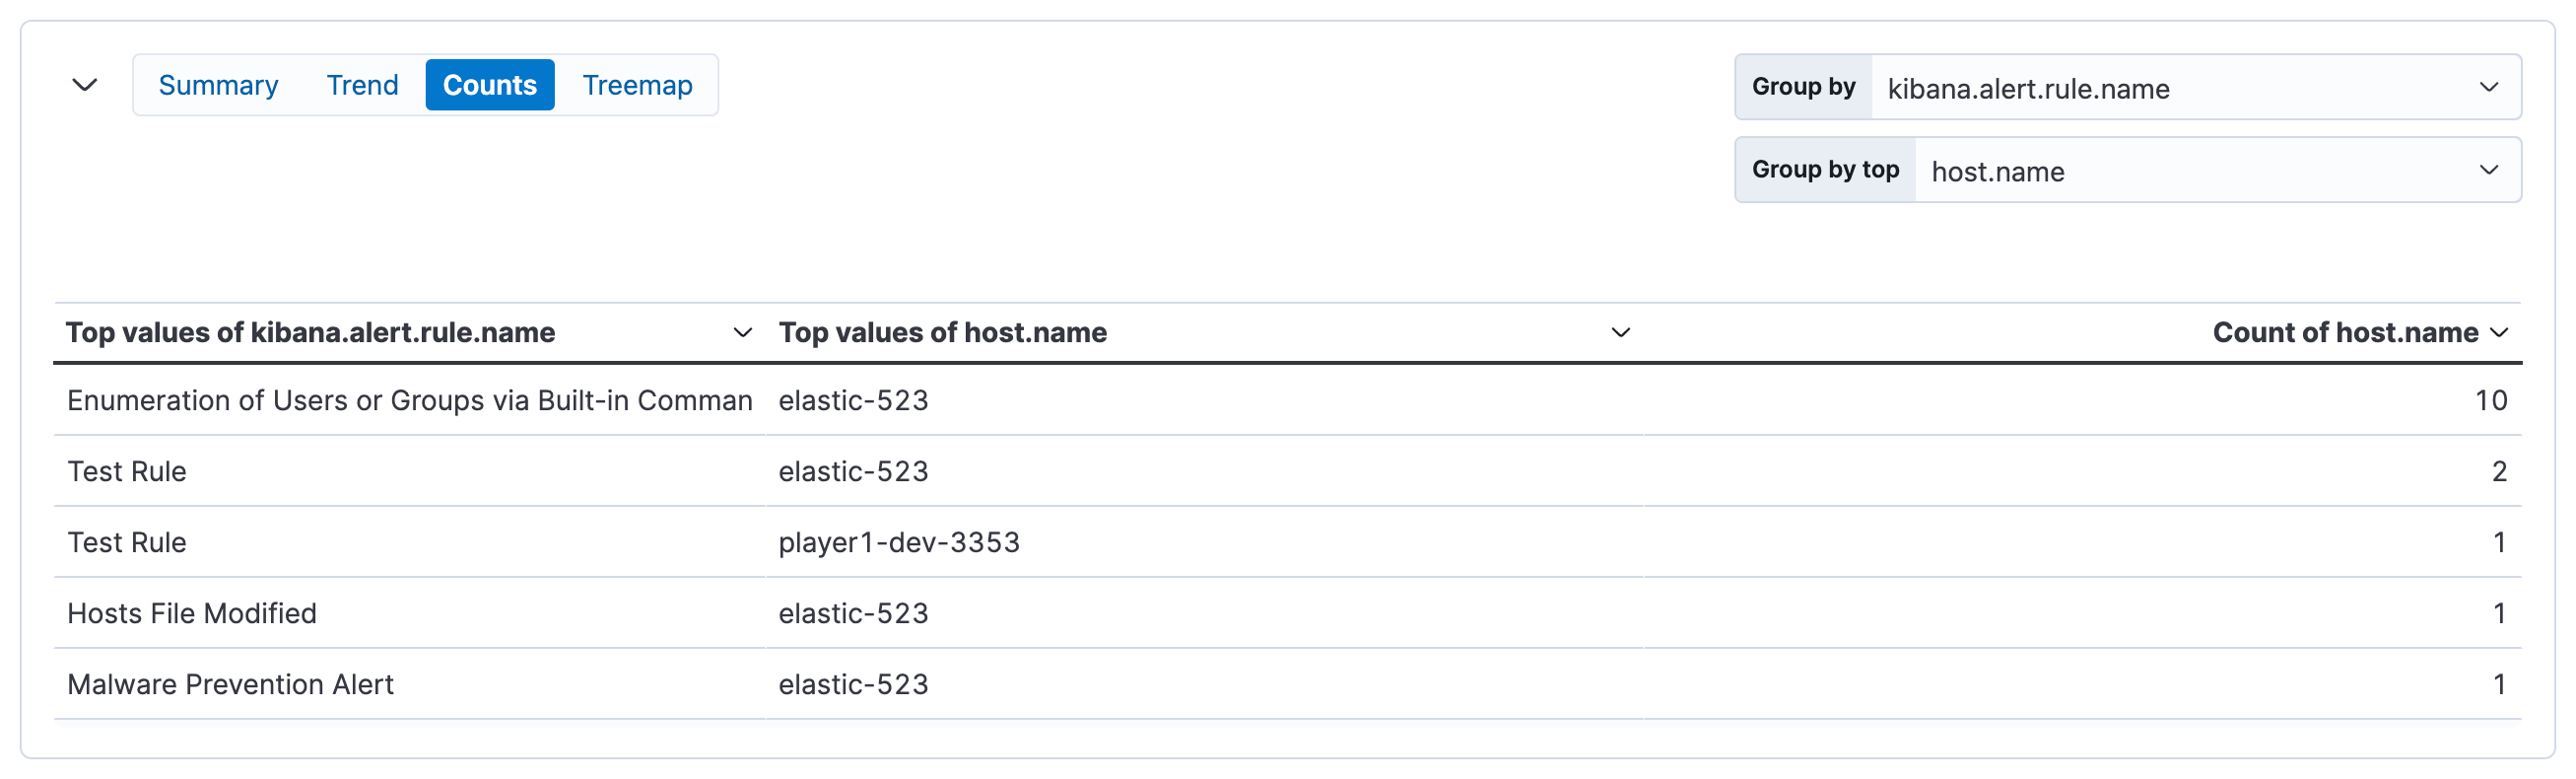
Shows alert counts as a table, grouped by one or two fields. Use this to compare alert volumes across rules, hosts, users, or other dimensions.
| Setting | Default |
|---|---|
| Group by | kibana.alert.rule.name |
| Group by top | host.name |
Shows alert distribution as nested, proportionally-sized tiles. Larger tiles indicate more alerts; colors indicate risk score.
| Setting | Default |
|---|---|
| Group by | kibana.alert.rule.name |
| Group by top | host.name |
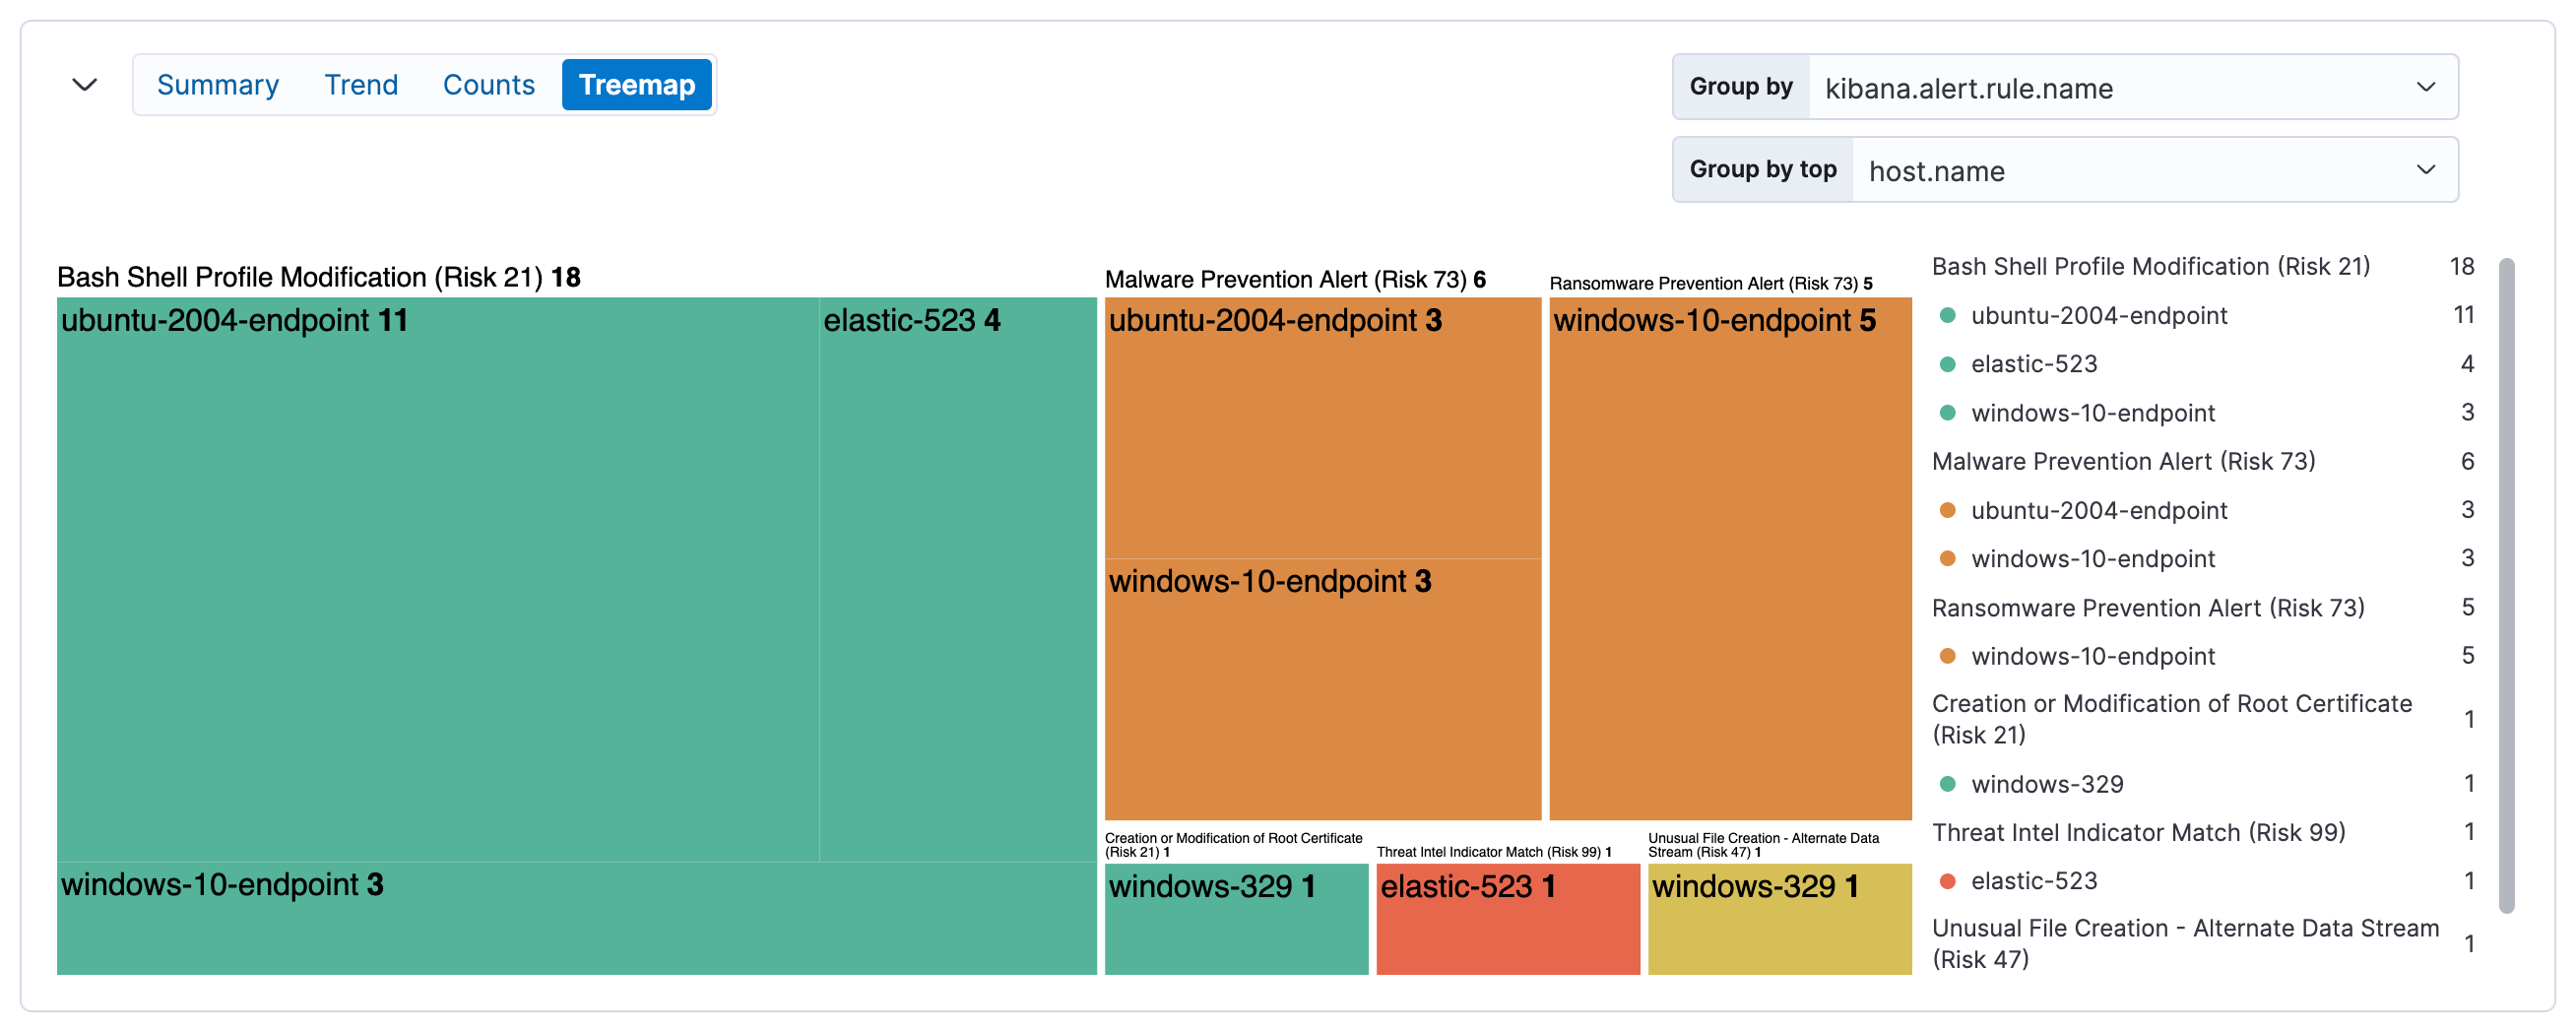
| Color | Risk score range |
|---|---|
| Green | Low (0–46) |
| Yellow | Medium (47–72) |
| Orange | High (73–98) |
| Red | Critical (99–100) |
Click elements to filter the alerts table:
- Click a group label (above a section) to filter to that group
- Click an individual tile to filter to that specific combination
Filters appear below the KQL search bar, where you can edit or remove them.
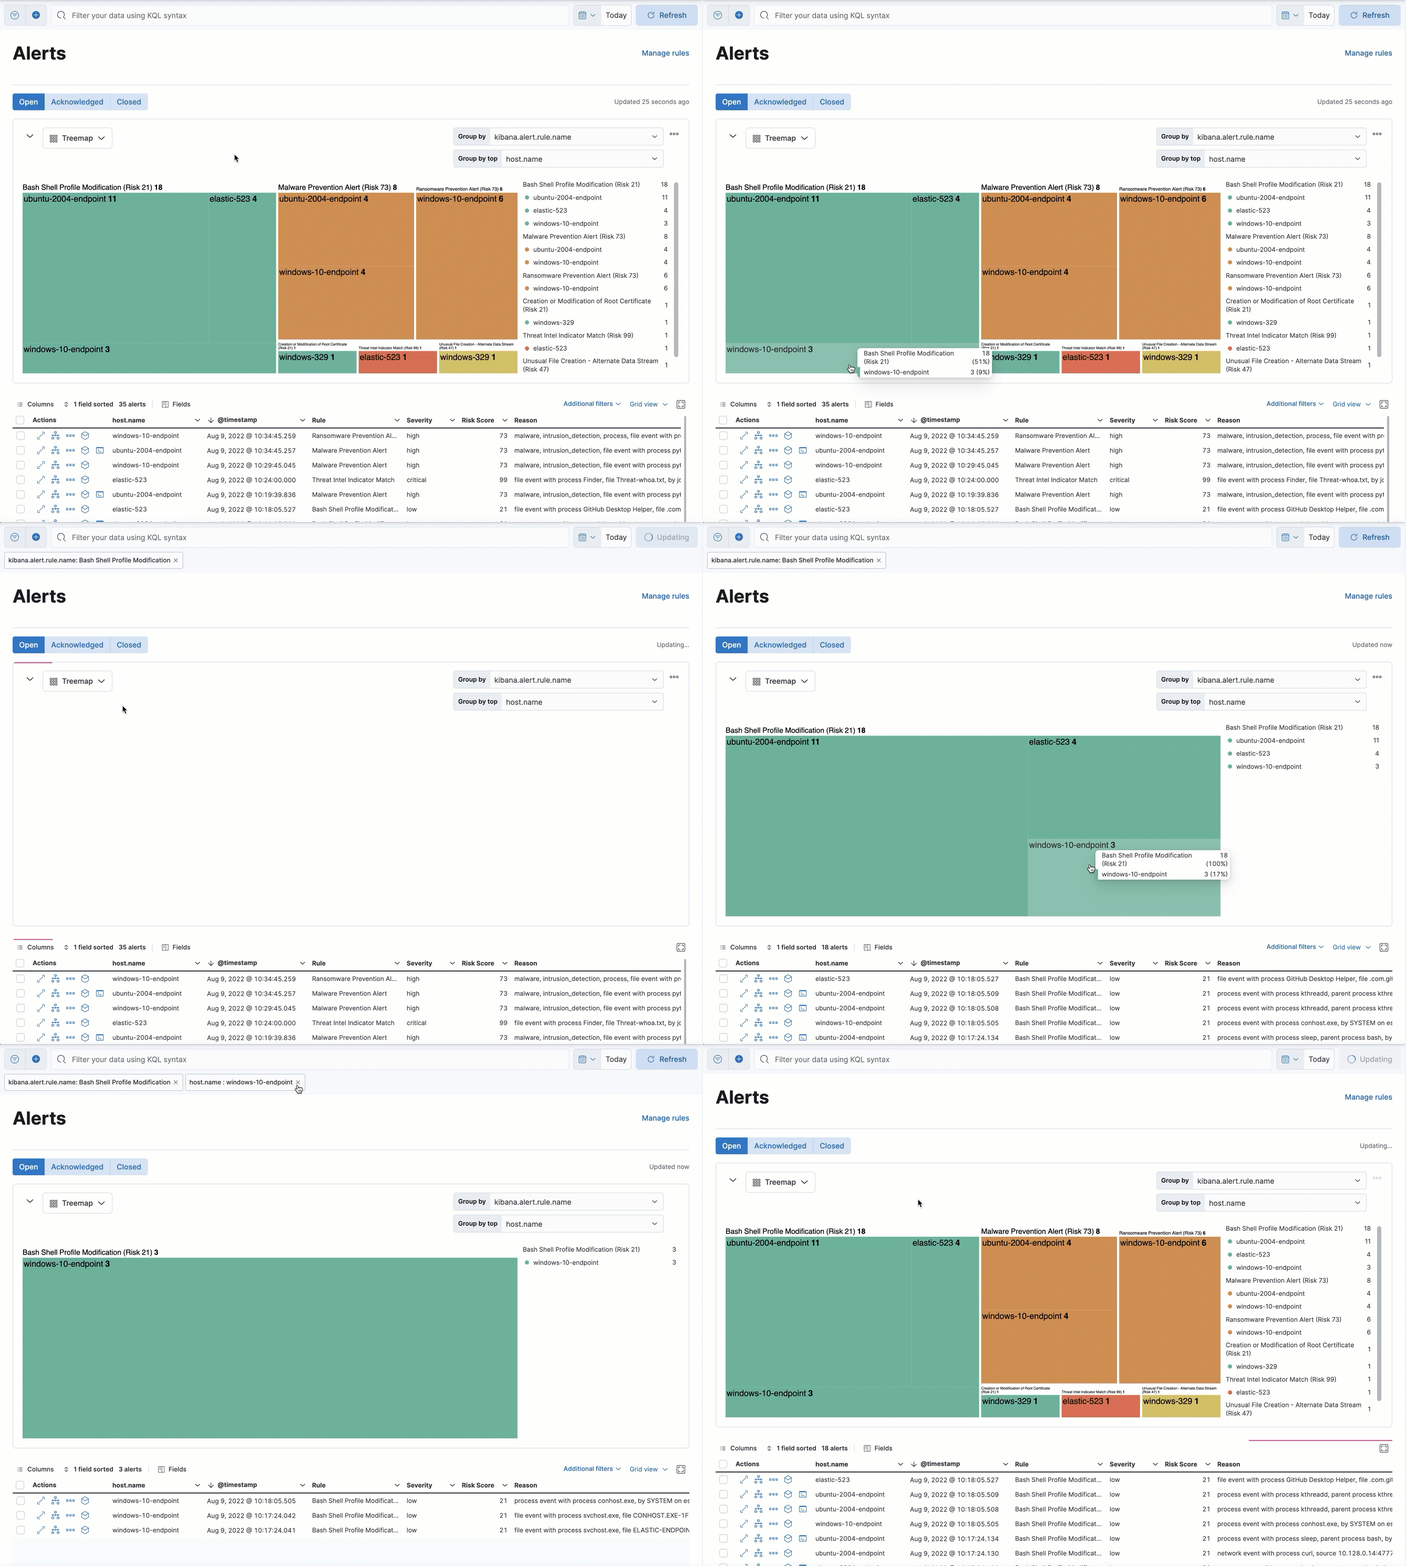
Some tiles may be small depending on alert volume. Hover over tiles to see details in a tooltip.