Run Universal Profiling on self-hosted Elastic stack
Elastic Cloud Serverless projects are autoscaled environments, fully managed by Elastic and available on Elastic Cloud. Availability This functionality is not available in Elastic Cloud Serverless. The Elastic Stack includes Elastic's core products such as Elasticsearch, Kibana, Logstash, and Beats. Availability This functionality is generally available and ready for production usage. Unless stated otherwise on the page, this functionality is available when your Elastic Stack is deployed on Elastic Cloud Hosted, Elastic Cloud Enterprise, Elastic Cloud on Kubernetes, and self-managed environments. This documentation corresponds to the latest patch available for each minor version. If you're not using the latest patch, check the release notes for changes.
Serverless
Unavailable
Unavailable
Stack
Generally available
To run Universal Profiling on self-hosted Elastic stack, you need an appropriate license.
Here you’ll find information on running Universal Profiling when hosting the Elastic stack on your own infrastructure.
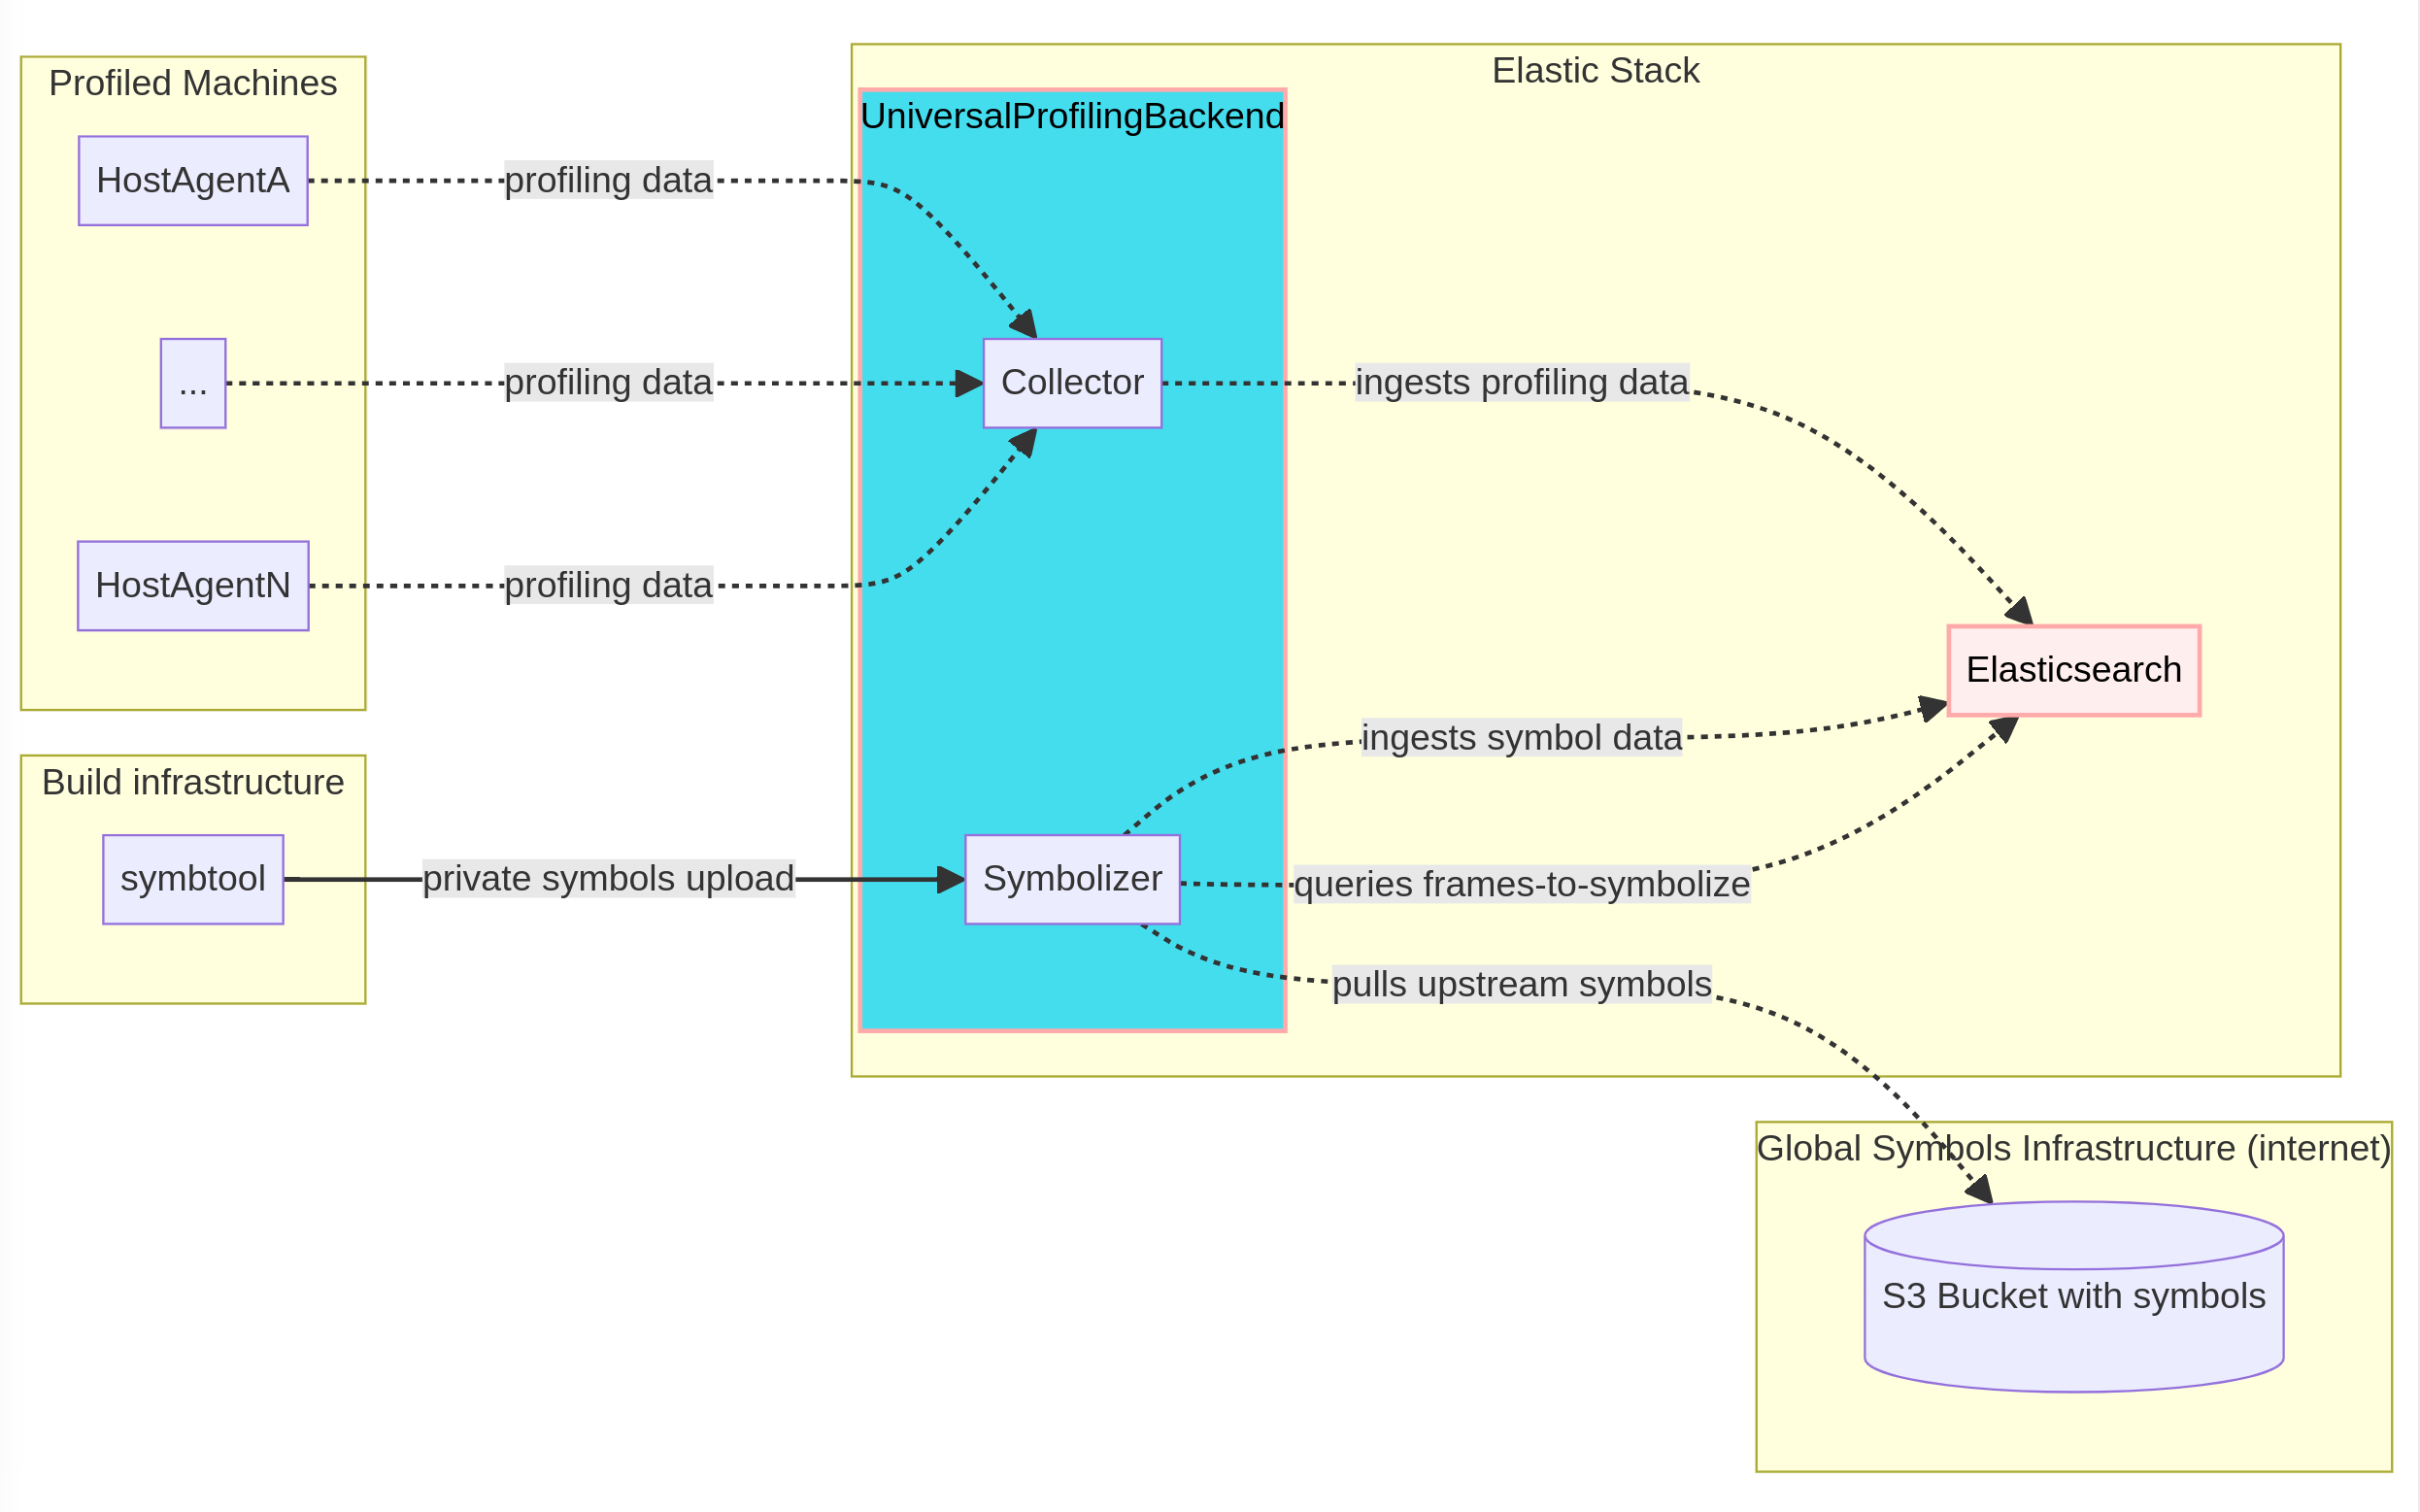
Universal Profiling consists of a client part (the Universal Profiling Agent) and a server part (the backend). This documentation focuses on the server part.
- Elastic stack: minimum version 8.12.0, on any Linux distribution (x86_64 or ARM64 architectures), with a Kernel 4.x or higher.
- ECE: minimum version 3.7.0, using the 8.12.0 stackpack or higher.
- Kubernetes: version 1.22+, using Helm charts.
For Elastic Cloud on Kubernetes (ECK), the Universal Profiling backend can be installed using helm charts in standalone mode. Once installed, you can connect the profiling backend to an existing ECK-managed stack. Currently, we do not have Profiling Operators and the CRDs necessary for running the Profiling backend natively in ECK.
The following platforms were tested and successfully ran the Universal Profiling backend.
| Platform | OS | Details |
|---|---|---|
| Linux x86_64, ARM64 | Ubuntu 20.04 LTS | Tested DEB package from the repository, Docker, and Binary |
| Linux x86_64, ARM64 | Ubuntu 22.04 LTS | Tested DEB package from the repository, Docker, and Binary |
| Linux x86_64, ARM64 | Debian Bullseye | Tested DEB package from the repository, Docker, and Binary |
| Linux x86_64, ARM64 | Debian Bookworm | Tested DEB package from the repository, Docker, and Binary |
| Linux x86_64, ARM64 | Fedora 37 | Tested YUM package from the repository, Docker, and Binary |
| Linux x86_64, ARM64 | Fedora 38 | Tested YUM package from the repository, Docker, and Binary |
| Linux x86_64, ARM64 | RHEL 9.3 | Tested YUM package from the repository, Docker, and Binary |
| Linux x86_64, ARM64 | RHEL 8.9 | Tested YUM package from the repository, Docker, and Binary |
| Linux x86_64, ARM64 | openSUSE Leap | Tested Docker and Binary |
| Linux x86_64, ARM64 | SUSE Linux Enterprise 15 | Tested Docker and Binary |
| Kubernetes 1.25, 1.26, 1.27 | Linux x86_64/ARM64 | Tested Helm charts |
The backend is made up of two services: the collector and the symbolizer.
- The collector receives profiling data from the Universal Profiling Agents and sends it to Elasticsearch. It listens on an HTTP server and serves a gRPC endpoint.
- The symbolizer processes debug symbols that are not available on the Universal Profiling Agent, and symbolizes native frames from OS packages. It also listens on an HTTP server and serves an endpoint to upload private debug symbols. Refer to Adding symbols for more information on the importance of adding symbols.