Maps
Elastic Cloud Serverless projects are autoscaled environments, fully managed by Elastic and available on Elastic Cloud. Availability This functionality is generally available and ready for production usage. Serverless interfaces and procedures might differ from classic Elastic Stack deployments. The Elastic Stack includes Elastic's core products such as Elasticsearch, Kibana, Logstash, and Beats. Availability This functionality is generally available and ready for production usage. Unless stated otherwise on the page, this functionality is available when your Elastic Stack is deployed on Elastic Cloud Hosted, Elastic Cloud Enterprise, Elastic Cloud on Kubernetes, and self-managed environments. This documentation corresponds to the latest patch available for each minor version. If you're not using the latest patch, check the release notes for changes.
Serverless
Generally available
Stack
Generally available
Create beautiful maps from your geographical data. With Maps, you can:
- Build maps with multiple layers and indices.
- Animate spatial temporal data.
- Upload GeoJSON files and shapefiles.
- Embed your map in dashboards.
- Symbolize features using data values.
- Focus on only the data that’s important to you.
Use multiple layers and indices to show all your data in a single map. Show how data sits relative to physical features like weather patterns, human-made features like international borders, and business-specific features like sales regions. Plot individual documents or use aggregations to plot any data set, no matter how large.
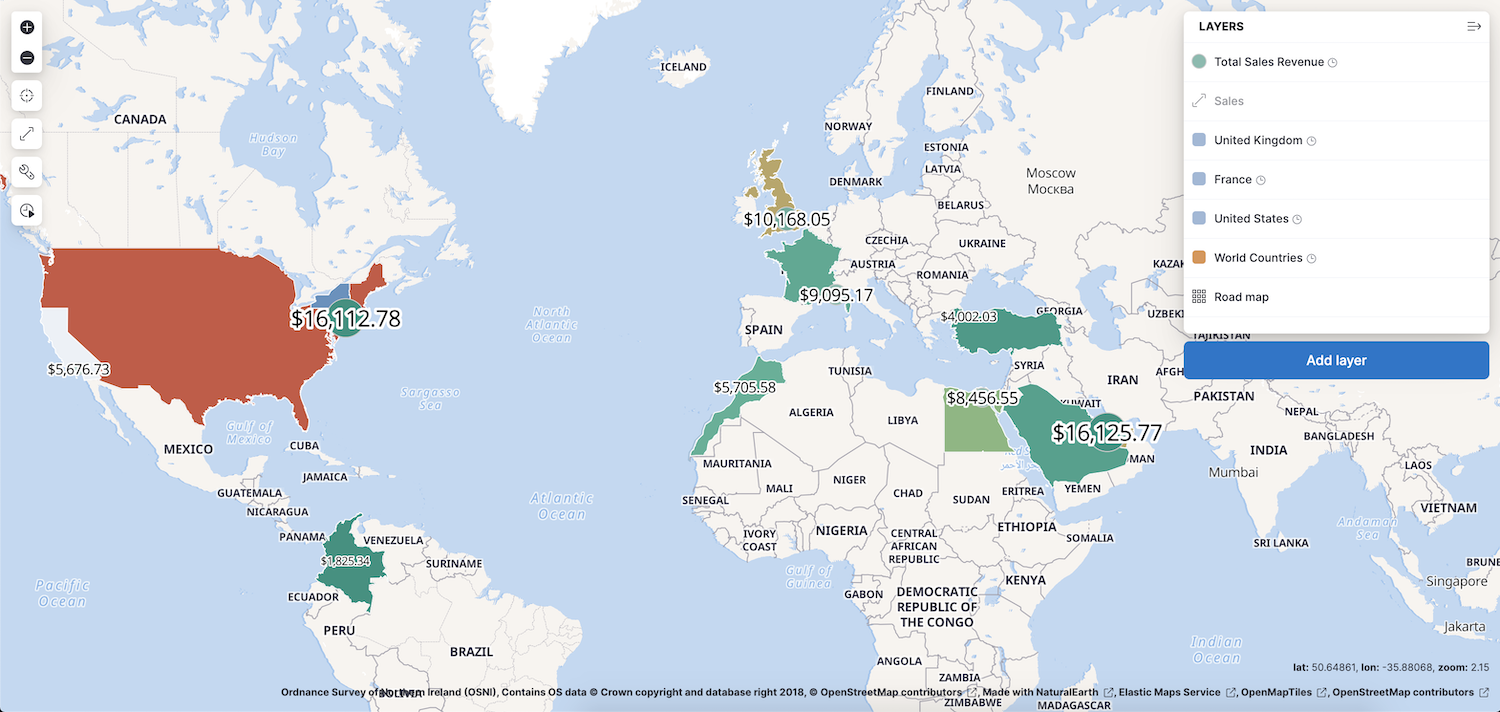
To learn about specific types of layers, check out Heat map layer, Tile layer, and Vector layer.
Data comes to life with animation. Hard to detect patterns in static data pop out with movement. Use time slider to animate your data and gain deeper insights.
This animated map uses the time slider to show Portland buses over a period of 15 minutes. The routes come alive as the bus locations update with time.
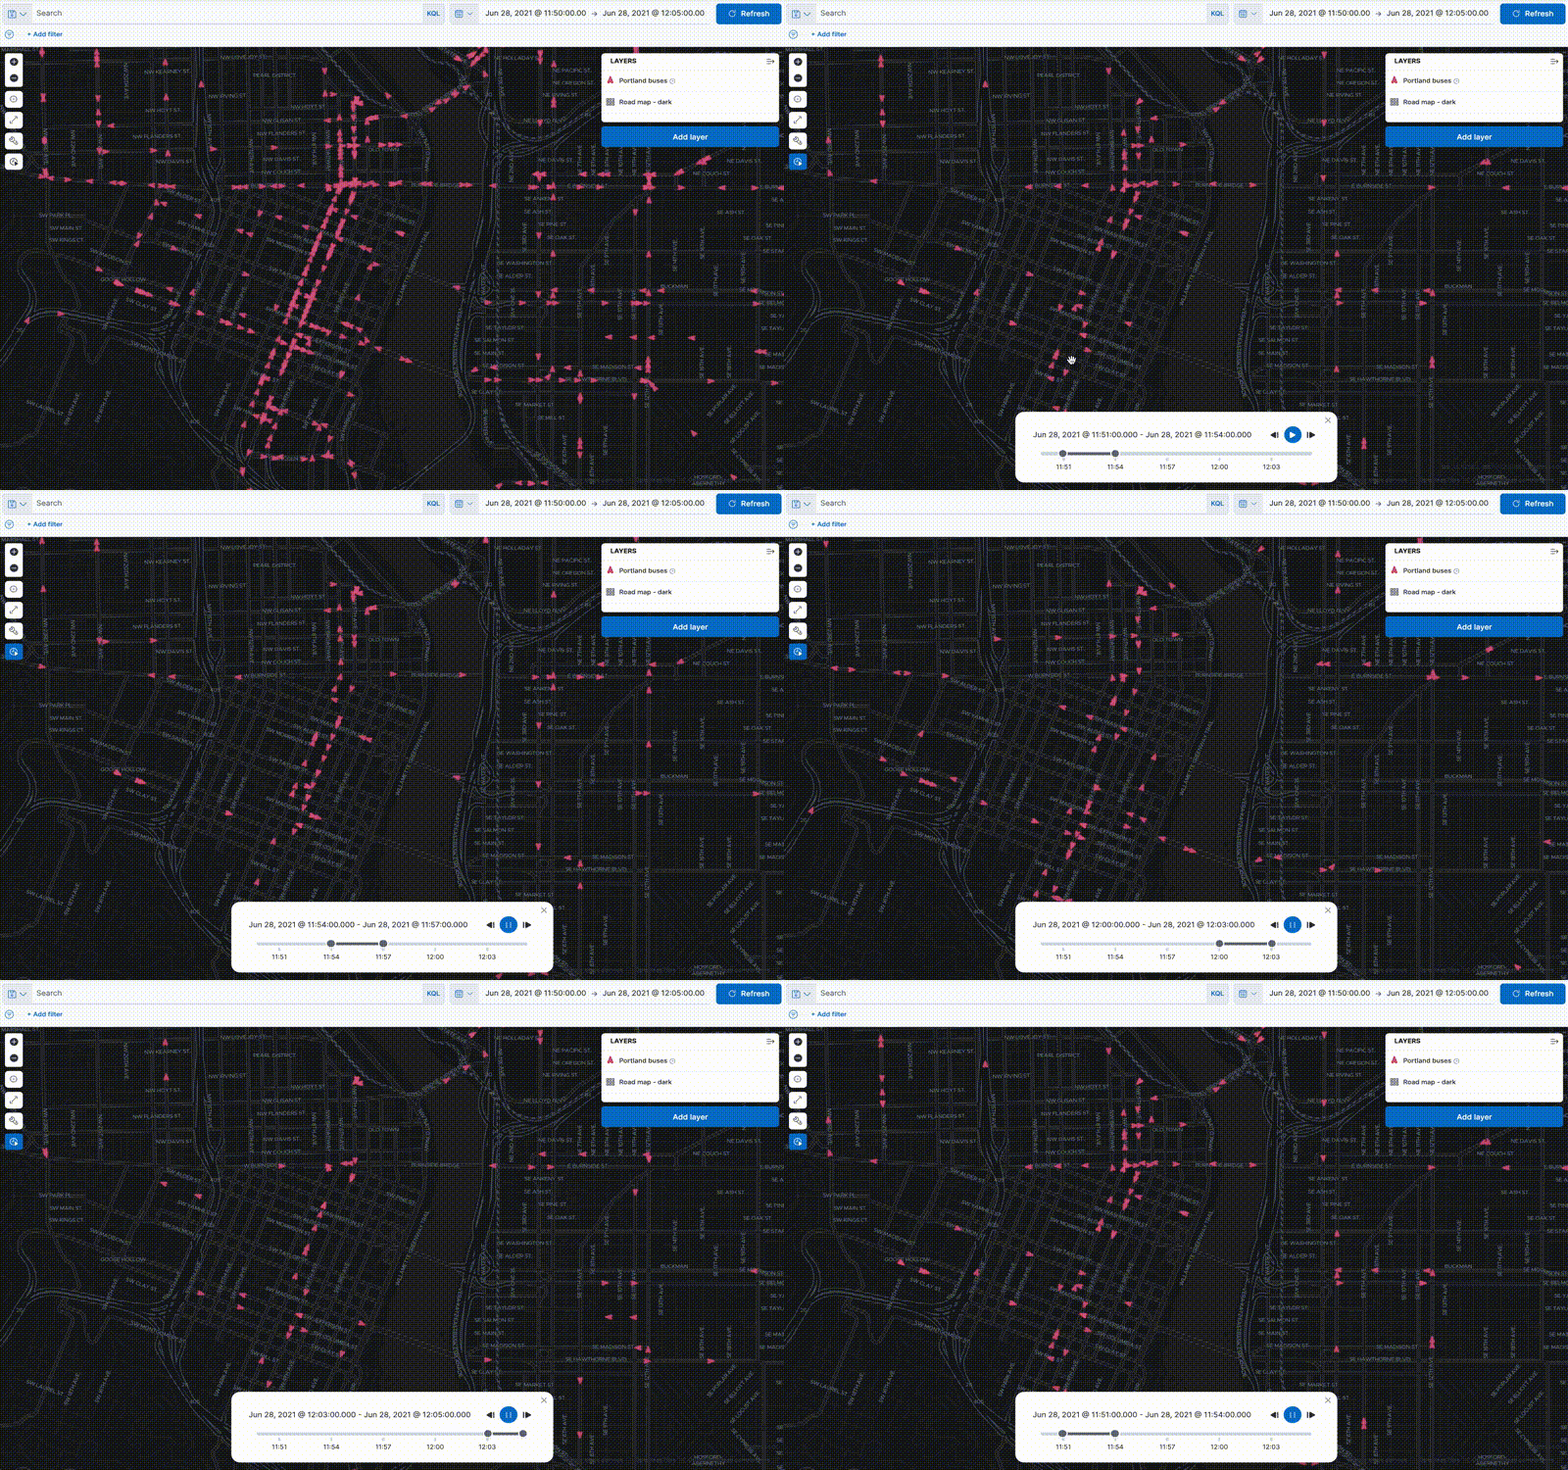
To create this type of map, check out Track, visualize, and alert assets in real time.
Use Maps to drag and drop your GeoJSON and shapefile data into Elasticsearch, and then use them as layers in your map.
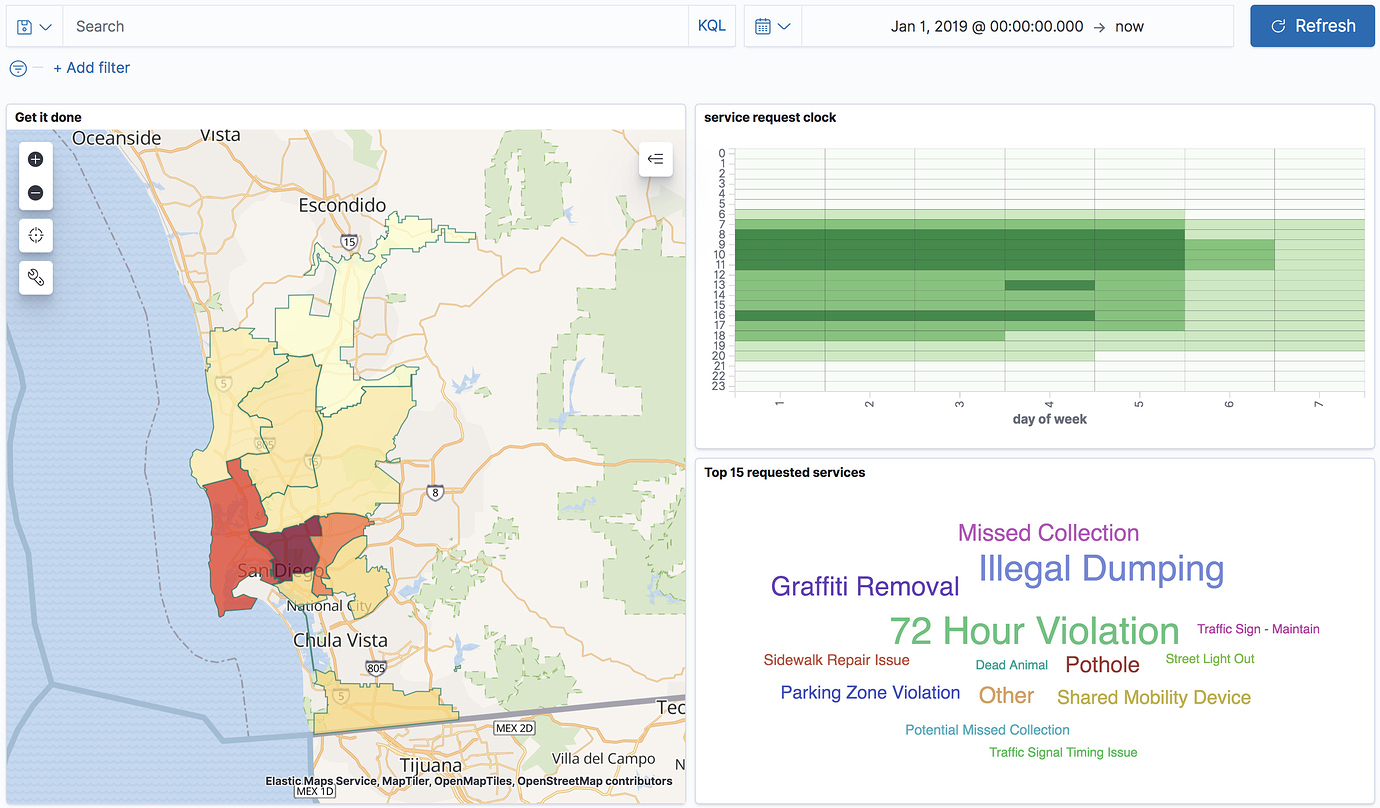
Viewing data from different angles provides better insights. Dimensions that are obscured in one visualization might be illuminated in another. Add your map to a Dashboard and view your geospatial data alongside bar charts, pie charts, tag clouds, and more.
This choropleth map shows the density of non-emergency service requests in San Diego by council district. The map is embedded in a dashboard, so users can better understand when services are requested and gain insight into the top requested services.
Elastic Cloud Serverless projects are autoscaled environments, fully managed by Elastic and available on Elastic Cloud.
Availability
Preview
This functionality is in technical preview and is ready for evaluation. Use with caution in production; it is not recommended for mission-critical workloads. Elastic will work to fix any issues, but features in technical preview are not subject to the support SLA of official GA features. Specific Support terms apply.
Serverless interfaces and procedures might differ from classic Elastic Stack deployments.
The Elastic Stack includes Elastic's core products such as Elasticsearch, Kibana, Logstash, and Beats.
Availability
Planned
We plan to add this functionality in a future Elastic Stack update. Subject to changes.
Unless stated otherwise on the page, this functionality is available when your Elastic Stack is deployed on Elastic Cloud Hosted, Elastic Cloud Enterprise, Elastic Cloud on Kubernetes, and self-managed environments.
This documentation corresponds to the latest patch available for each minor version. If you're not using the latest patch, check the release notes for changes.
If the map has an ES|QL layer, toggling the dashboard's
Fast mode option has no effect on the map. To approximate a STATS query on the map, add the SET approximation directive to the layer query. When Elasticsearch applies approximation, the map shows a
badge in its panel header. Refer to Interpret approximate results.
Customize each layer to highlight meaningful dimensions in your data. For example, use dark colors to symbolize areas with more web log traffic, and lighter colors to symbolize areas with less traffic.
Search across the layers in your map to focus on just the data you want. Combine free text search with field-based search using the Kibana Query Language. Set the time filter to restrict layers by time. Draw a polygon on the map or use the shape from features to create spatial filters. Filter individual layers to compares facets.
Check out Search geographic data.
Elastic Cloud Serverless projects are autoscaled environments, fully managed by Elastic and available on Elastic Cloud. Availability This functionality is generally available and ready for production usage. Serverless interfaces and procedures might differ from classic Elastic Stack deployments. The Elastic Stack includes Elastic's core products such as Elasticsearch, Kibana, Logstash, and Beats. Availability This functionality is not available in Elastic Stack. This documentation corresponds to the latest patch available for each minor version. If you're not using the latest patch, check the release notes for changes.
Serverless
Generally available
Stack
Unavailable
Unavailable
When cross-project search is enabled and you have linked projects, use the CPS scope selector to control which projects your map queries. All Elasticsearch-backed layers, including vector layers, joins, and heat map layers, pull data from linked projects based on the current cross-project search scope. When you change the scope, these layers update to reflect the new set of projects.
ES|QL layers additionally support query-level overrides using SET project_routing. When you embed a map in a dashboard and a layer uses a project routing override, the map panel displays a Custom CPS scope badge. Refer to View data from multiple projects for details.